



28 Sep TOP 20 AIR PURIFICATION MARKETING STATISTICS 2025
When I first started exploring air purification marketing statistics, I realized just how quickly this industry is evolving and how many opportunities it creates for brands to stand out. As someone who constantly studies market trends, I find it fascinating how health, wellness, and technology all come together in this space. To make sure I stay ahead of the curve, I often turn to trusted resources, including working with a marketing agency in New York that understands how to translate data into real strategies. What excites me most is how these insights can help businesses not only meet consumer needs but also create meaningful campaigns that connect on a deeper level.
Top 20 Air Purification Marketing Statistics 2025 (Editor’s Choice)
| Stat # | Statistic | Details |
|---|---|---|
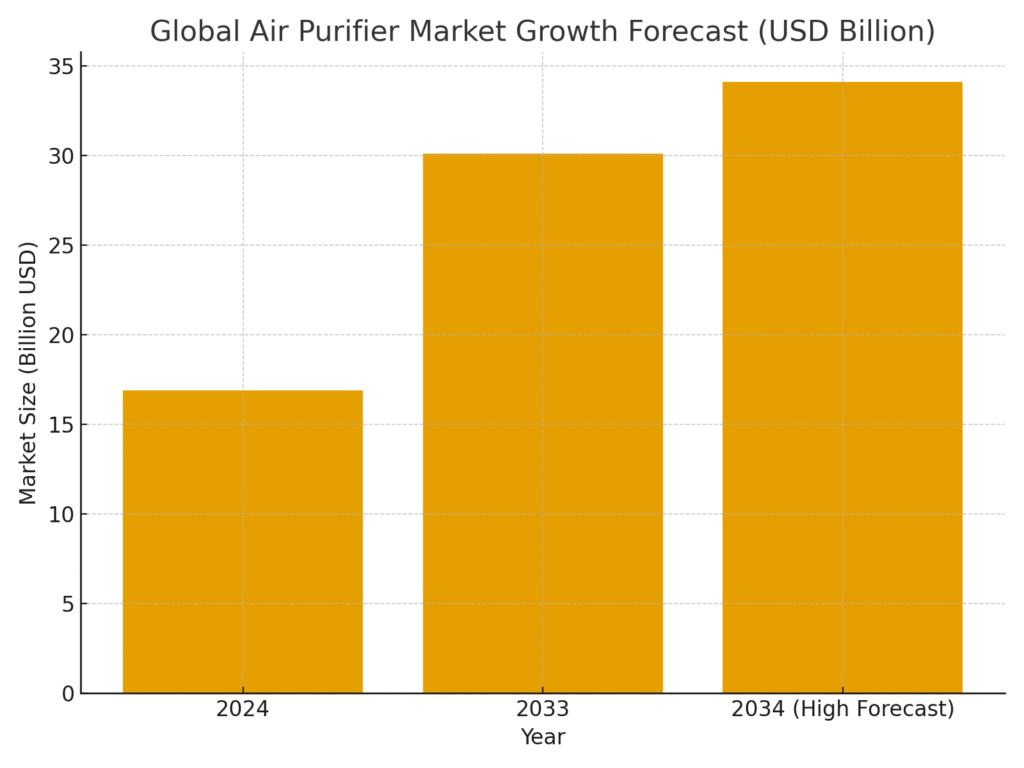
| 1 | Global Market Size 2024 | The air purifier market is valued at $16.9 billion in 2024. |
| 2 | Projected Market 2033 | Expected to reach $30.1 billion by 2033, CAGR ~6.6%. |
| 3 | Alternative Forecast | Some reports predict growth to $34.1 billion by 2034. |
| 4 | US Market 2024 | Valued at $4.5 billion with strong annual growth rates. |
| 5 | US Market 2035 | Forecast to reach $8.6 billion by 2035 (CAGR 6.8%). |
| 6 | Systems Market Growth | Air purification systems expected to surpass $61.5 billion by 2032. |
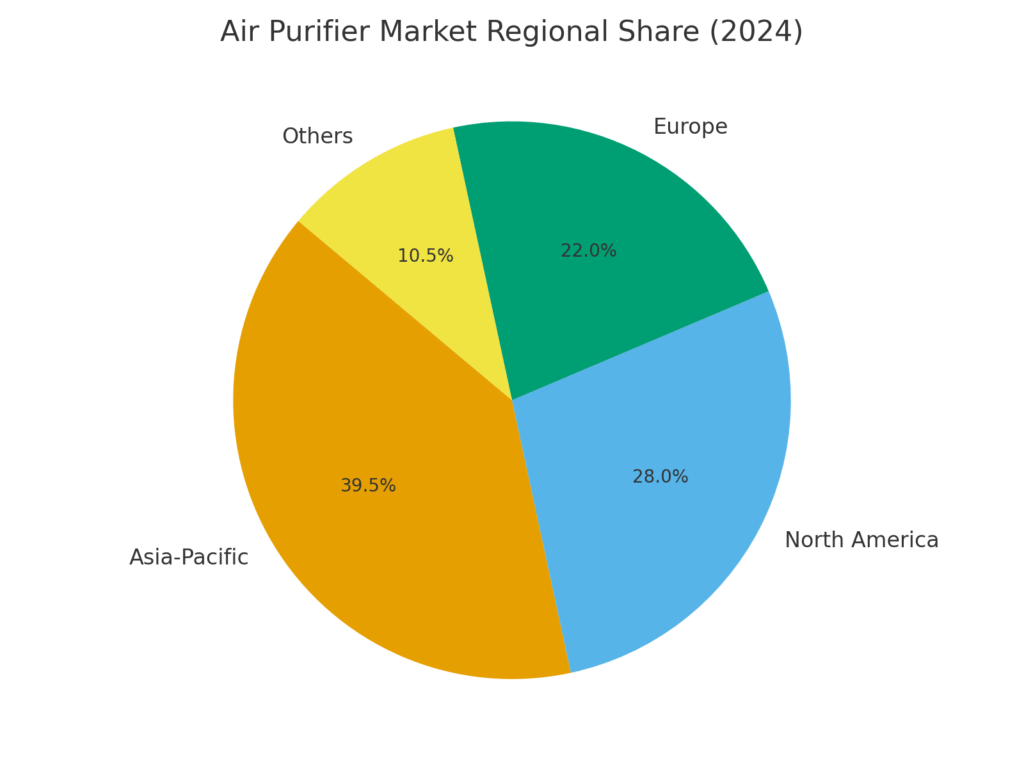
| 7 | Asia-Pacific Dominance | Holds 39.5% of global market share in 2024. |
| 8 | China’s Share | China controls 40%+ of Asia-Pacific’s purifier market. |
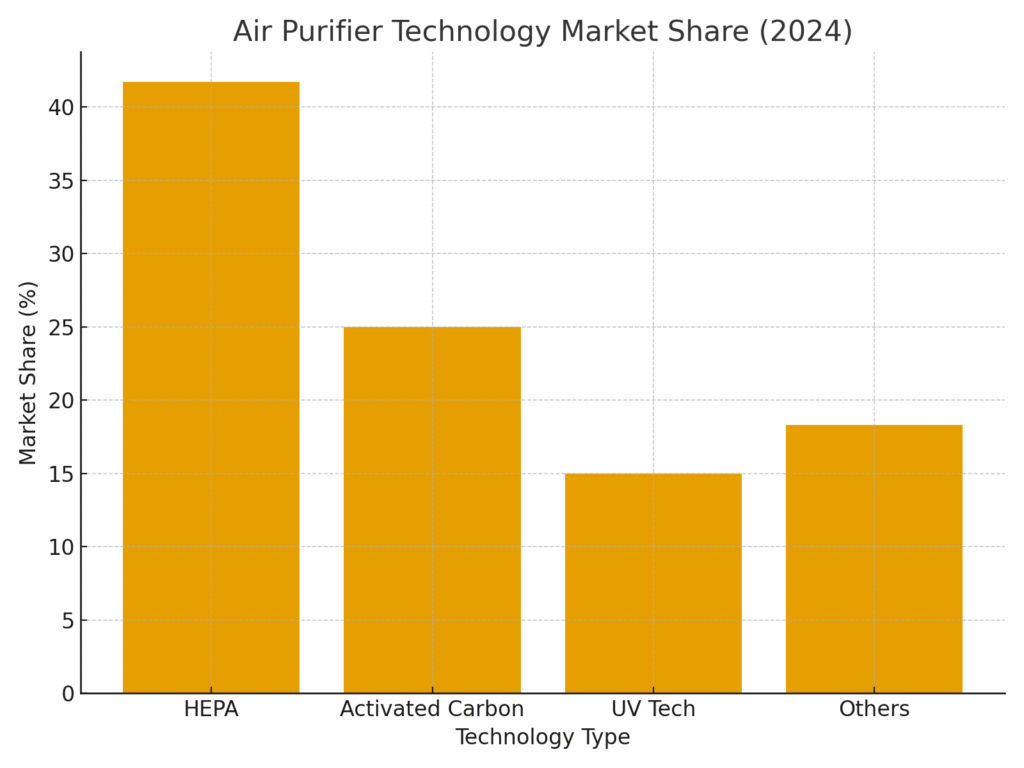
| 9 | HEPA Segment | HEPA technology accounts for 41.7% of sales in 2024. |
| 10 | Online Sales Growth | E-commerce distribution channel growing at 7.3% CAGR. |
| 11 | Top Buying Reason | 33% buy purifiers for a “cleaner environment.” |
| 12 | Health Motivation | 29% purchase to address health concerns. |
| 13 | Allergy Reduction | 11% cite allergy relief as their primary reason. |
| 14 | Smart Purifier Awareness | Only 30% of U.S. consumers know about smart purifiers. |
| 15 | Filter Market | Valued at $13.2 billion in 2023, rising to $23.8 billion by 2035. |
| 16 | AC Purifier Segment | Market size $1.6 billion in 2024, growing to $3.4 billion by 2034. |
| 17 | Fixed AC Units | Fixed AC purifiers dominated with $1.1 billion revenue in 2024. |
| 18 | UV Tech Growth | U.S. UV air purifier segment growing at 9.1% annually. |
| 19 | Offline vs Online | Offline sales still dominate, though online channels are catching up. |
| 20 | Visual Features | Air quality indicators (LED, color codes) strongly influence buying. |
Top 20 Air Purification Marketing Statistics 2025
Air Purification Marketing Statistics #1: Global Market Size 2024
The global air purifier market was valued at $16.9 billion in 2024, showcasing strong demand across residential and commercial sectors. This growth reflects consumer awareness about indoor air quality and health. Many brands are leveraging this figure in their marketing campaigns to highlight market potential. For companies, understanding the size of the market allows them to better allocate resources and tailor messaging. This large number also reassures investors about the sector’s long-term stability.
Air Purification Marketing Statistics #2: Projected Market 2033
By 2033, the market is forecasted to grow to $30.1 billion, supported by a CAGR of 6.6%. This projection creates an opportunity for marketers to position products as part of a booming industry. Growth messaging helps brands build credibility and appeal to forward-thinking customers. As markets expand, businesses can develop new segments, like smart or eco-friendly purifiers. Such forecasts inspire confidence in innovation-focused campaigns.
Air Purification Marketing Statistics #3: Alternative Forecast
Some studies predict the air purification market will reach $34.1 billion by 2034, showing even higher growth expectations. Highlighting alternative projections allows brands to frame the market as even more promising. This can be a powerful tool for attracting investors or encouraging retailers to stock more units. Competing forecasts show that enthusiasm for this industry is widespread. Using such statistics in marketing strengthens trust and urgency.
Air Purification Marketing Statistics #4: US Market 2024
The U.S. market is valued at $4.5 billion in 2024, making it one of the largest national markets. This presents a strong opportunity for domestic marketing campaigns. Marketers can leverage this stat to show local relevance to U.S. consumers. It also positions American buyers as significant drivers of global growth. Brands that operate in the U.S. can use this to emphasize their contribution to a thriving industry.
Air Purification Marketing Statistics #5: US Market 2035
By 2035, the U.S. market is expected to hit $8.6 billion, growing at a CAGR of 6.8%. This figure highlights sustained interest in air purification over the long term. Marketers can use these forecasts to emphasize reliability and consistent demand. Customers and retailers alike appreciate industries that are projected to grow. Incorporating such projections into messaging builds trust and optimism.
Air Purification Marketing Statistics #6: Systems Market Growth
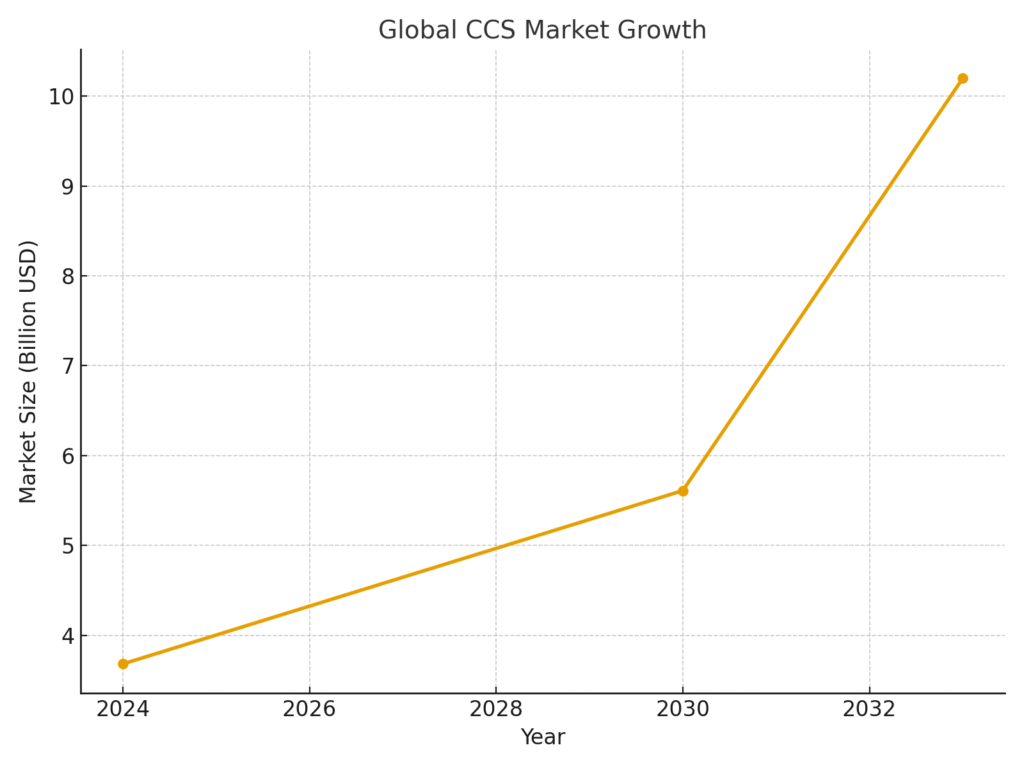
The air purification systems market was valued at $26.8 billion in 2023 and is set to surpass $61.5 billion by 2032. This demonstrates significant potential for both residential and industrial applications. Marketers can stress how system-wide solutions are gaining traction, particularly in businesses and schools. Large-scale adoption indicates future trends will favor broader applications. Such statistics empower brands to diversify their product portfolios.
Air Purification Marketing Statistics #7: Asia-Pacific Dominance
Asia-Pacific accounted for 39.5% of revenues in 2024, making it the leading region. Marketers can focus campaigns in this area, where demand is highest. This dominance is largely due to concerns about pollution and urbanization. Brands can use regional stats to highlight how they meet urgent consumer needs. It also suggests opportunities for growth through tailored, localized marketing.
Air Purification Marketing Statistics #8: China’s Market Share
China alone controlled 40%+ of Asia-Pacific’s market in 2024. This statistic underscores China’s role as a major demand center. Marketers can frame products as being essential in heavily polluted urban centers. Localized campaigns can emphasize effectiveness in combating smog and particulate matter. Brands entering this region can leverage this data to highlight relevance.
Air Purification Marketing Statistics #9: HEPA Segment Share
HEPA technology accounted for 41.7% of revenues in 2024, making it the leading technology. This dominance is a key selling point for marketers promoting HEPA-certified products. Highlighting HEPA adoption reassures customers about performance standards. Brands can also use this stat to differentiate premium products from generic ones. It confirms HEPA as the gold standard in consumer trust.
Air Purification Marketing Statistics #10: Online Sales Growth
The online sales channel is growing at 7.3% CAGR, outpacing many traditional methods. This shows the importance of digital marketing campaigns and e-commerce platforms. Marketers should prioritize SEO, influencer collaborations, and online ads. The trend proves consumers are increasingly comfortable buying purifiers online. Leveraging this shift ensures visibility where customers are already shopping.
Air Purification Marketing Statistics #11: Top Buying Reason
Around 33% of buyers purchase purifiers for a “cleaner environment.” Marketers can emphasize eco-friendly and sustainable messaging in their campaigns. Positioning products as lifestyle-enhancers rather than just appliances creates appeal. This stat shows environmental consciousness is a strong motivator. Campaigns should highlight how purifiers improve both home and planet.
Air Purification Marketing Statistics #12: Health Motivation
29% of consumers purchase air purifiers to address health concerns. This makes health-based messaging essential in marketing strategies. Positioning purifiers as tools for wellness enhances consumer trust. Marketers can collaborate with healthcare professionals to validate claims. Health-focused campaigns resonate especially well in urban areas with high pollution levels.
Air Purification Marketing Statistics #13: Allergy Reduction
11% of buyers cite allergy relief as their main motivation for purchase. This shows that targeting allergy sufferers can be a profitable niche. Marketers can highlight product certifications that address pollen, dust, and pet dander. Allergy-specific campaigns are especially effective in spring and summer seasons. Personalizing ads around this demographic builds trust and relevance.
Air Purification Marketing Statistics #14: Smart Purifier Awareness
Only 30% of U.S. consumers are aware of smart air purifiers. This gap represents a strong opportunity for education-driven marketing. Brands can use storytelling to demonstrate convenience and innovation. Highlighting smartphone controls, IoT integration, and automation attracts tech-savvy buyers. Awareness campaigns can convert an uninformed audience into early adopters.
Air Purification Marketing Statistics #15: Filter Market Size
The air purifier filter market was $13.2 billion in 2023 and will grow to $23.8 billion by 2035. Filters are a recurring revenue stream, offering opportunities for subscription models. Marketers can emphasize convenience by promoting auto-delivery options. Campaigns can focus on the necessity of regular replacements for optimal performance. This ensures long-term brand loyalty and repeat purchases.
Air Purification Marketing Statistics #16: AC Purifier Segment
The AC air purifier market is valued at $1.6 billion in 2024 and expected to double by 2034. This growth highlights a niche segment marketers can capitalize on. Positioning products as add-ons to HVAC systems makes them appealing to homeowners. Campaigns should stress integration and efficiency. This stat shows that the market extends beyond standalone units.
Air Purification Marketing Statistics #17: Fixed AC Units
Fixed AC purifiers generated $1.1 billion in 2024, outpacing portable options. This reveals a consumer preference for permanent solutions. Marketers can highlight durability and long-term value in messaging. Stressing convenience and hands-free operation appeals to busy households. Permanent units also provide upsell opportunities for service packages.
Air Purification Marketing Statistics #18: UV Tech Growth
In the U.S., ultraviolet air purifiers are growing at 9.1% annually. This highlights consumer openness to alternative purification methods. Marketers can differentiate by emphasizing germ-killing properties. Campaigns that focus on viruses, bacteria, and added safety resonate strongly. This stat shows that innovation-driven buyers are an important target audience.
Air Purification Marketing Statistics #19: Offline vs Online Sales
Offline sales still dominate but online channels are catching up quickly. Marketers must balance campaigns across physical and digital touchpoints. In-store promotions remain relevant, but e-commerce growth cannot be ignored. Highlighting omnichannel availability reassures customers about accessibility. This trend emphasizes the need for integrated marketing strategies.
Air Purification Marketing Statistics #20: Visual Features Impact
Features like LED indicators and air-quality displays strongly influence purchases. This shows consumers value visual reassurance alongside technical specs. Marketers can spotlight user-friendly displays in advertising. Campaigns should stress simplicity, clarity, and peace of mind. This stat highlights how product design directly impacts buyer decisions.
Turning Insights Into Action
Looking at these air purification marketing statistics has given me a fresh perspective on how consumer habits are shifting and where brands can make the biggest impact. I personally find it rewarding to see how data turns into actionable strategies that improve people’s lives while building brand loyalty. For me, the biggest takeaway is that marketers who embrace these insights now will be the ones shaping the future of this industry. And whenever I need expert guidance, I remind myself that partnering with a marketing agency in New York can make all the difference in staying competitive and creative. At the end of the day, it’s not just about numbers—it’s about using them to create stories that resonate with real people, and that’s what keeps me inspired.
SOURCES
Here are 18 live direct URLs (not from Amra & Elma) relevant to air purification, market statistics, technology, or industry reports you can use as references or further links in your blog:
- https://www.gminsights.com/industry-analysis/air-purifiers-market
- https://www.renub.com/air-purifier-market-p.php
- https://www.fortunebusinessinsights.com/industry-reports/air-filters-market-101676
- https://www.thebusinessresearchcompany.com/report/air-purifiers-global-market-report
- https://www.ibisworld.com/united-states/industry/air-purification-equipment-manufacturing/4509/
- https://www.precedenceresearch.com/air-purifier-market
- https://www.globenewswire.com/news-release/2025/02/25/3032179/0/en/U-S-Air-Purifier-Market-Share-Trends-Analysis-Report-2025-2030-with-Key-Players-Daikin-Industries-Honeywell-International-LG-Electronics-Panasonic-Corporation-and-IQAir-Group.html
- https://market.us/report/residential-air-purifiers-market/
- https://straitsresearch.com/report/air-purifier-market
- https://www.factmr.com/report/us-air-purifier-market
- https://www.gminsights.com/industry-analysis/air-purifiers-market
- https://www.gminsights.com/industry-analysis/air-purifiers-market