




31 Mar TOP 20 MARKETING ANALYTICS AND DATA STATISTICS 2026 REVEAL SHOCKING INSIGHT-DRIVEN MARKETING POWER
Updated for 2026. This page has been fully refreshed with the latest marketing analytics adoption rates, real-time performance tracking data, and AI-driven measurement trends, grounded in recent global surveys, enterprise marketing reports, and cross-channel campaign performance insights.
Marketing analytics in 2026 is less about raw data and more about interpreting it in real time to drive smarter decisions. Businesses are moving beyond vanity metrics and shifting toward insights that influence budget allocation, creative direction, and long-term strategy. AI and automation continue to reshape how marketers collect and act on performance data across every digital touchpoint. Social platforms, email tools, and content systems are becoming more integrated, enabling seamless tracking of the customer journey from discovery to purchase.
The demand for personalization has never been higher, and data is what makes that possible—whether it’s customizing email flows, retargeting with precision, or tailoring website content. Marketers are also under more pressure to tie every campaign to clear ROI, pushing analytics to the center of strategy sessions.
As mobile, video, and influencer channels mature, the focus is shifting toward not just reaching audiences but truly understanding them. Amra and Elma shares the following 20 marketing analytics and data statistics to reveal where brands are investing, what’s working, and how the landscape will evolve over the next few years.
TOP 20 MARKETING ANALYTICS AND DATA STATISTICS 2026 THAT SHOCK EVERY DIGITAL MARKETER
That Define Where the Money Goes in 2026
The marketing landscape continues its rapid evolution, shaped by AI acceleration, a $786B digital ad economy, and consumers who demand personalization at every touchpoint. Every figure below carries direct revenue implications for brands that move fast — and a steep cost for those that don't.
| # | Statistic | Key Figure | What It Means for Your Business | Category |
|---|---|---|---|---|
| 💰 Paid Media & Advertising Revenue | ||||
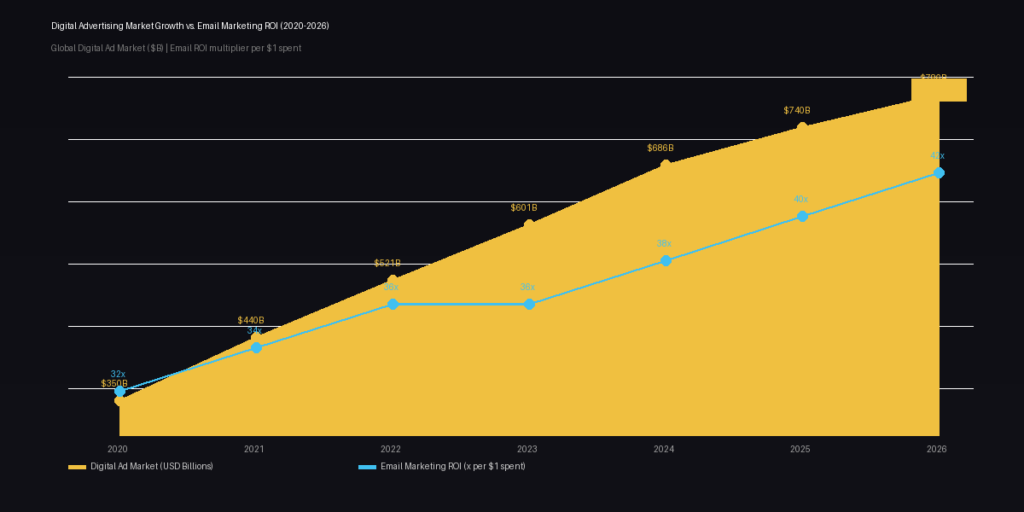
| 01 | Digital Advertising Growth Global digital ad & marketing market projected to hit $786.2B by 2026 — U.S. alone at $460B. Programmatic & AI-powered bidding are the new standard. | $786B Global by 2026 | Brands not aligned with performance-based platforms risk irrelevance. Upskill in analytics and adopt tools with campaign transparency now. | Paid Media |
| 05 | Email Marketing ROI Delivers $36–$42 return per $1 spent — the highest ROI of any digital channel. AI-driven personalization and behavioral triggers push numbers even further. | 42x ROI per $1 spent | Generic blasts are dead. Invest in segmentation, AI scheduling, and first-party data to turn email into a repeatable revenue engine. | |
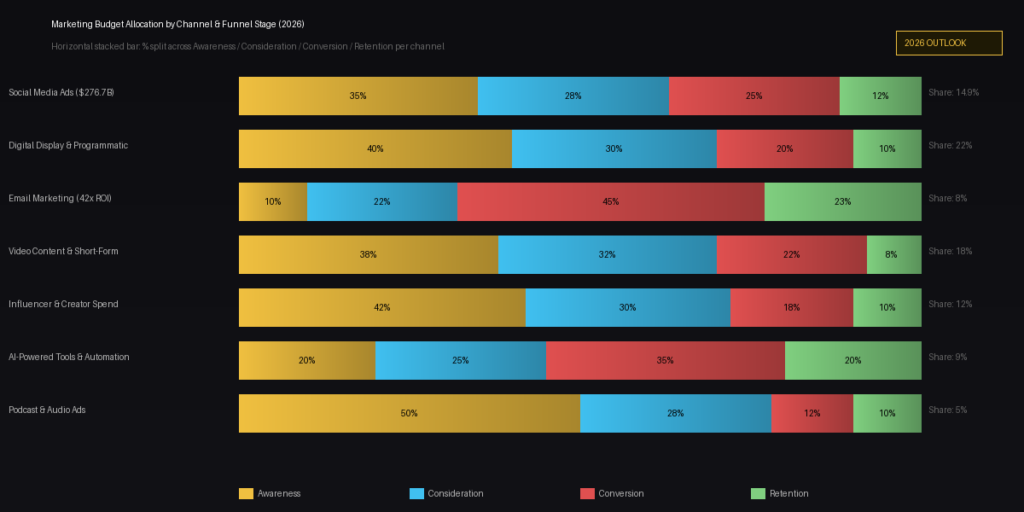
| 19 | Social Media Ad Spend Global social ad spend approaching $277B — shoppable posts, live commerce, and ROAS-based bidding intensify the battle for every impression. | $277B Global social ad spend | Rely on ROAS, CAC, and LTV metrics. Without smart attribution, budgets balloon with little return. Shift toward performance placements. | Social Ads |
| 13 | Marketing Budget: Social Share Businesses allocate an average 14.9% of total marketing budgets to social. Dynamic allocation is replacing static quarterly planning as ROAS dashboards mature. | 14.9% Of budget to social media | Every dollar is scrutinized. ROI modeling tools that forecast before launch and shift spend in real-time are now table stakes, not a luxury. | Budget |
| 🤖 AI, Technology & Content Investment | ||||
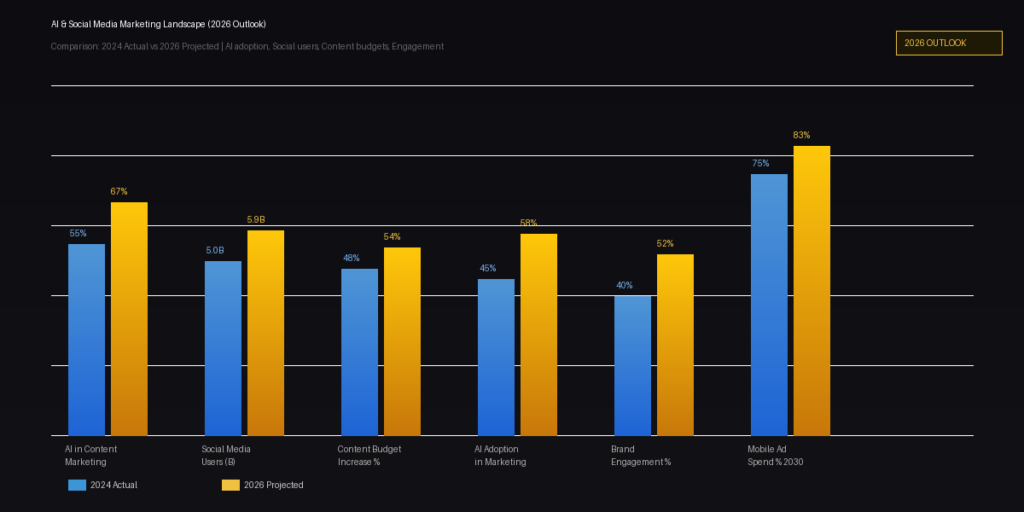
| 02 | AI in Content Marketing 67% of small businesses use AI to optimize SEO, generate content, and manage publishing. AI now drives strategy development, not just production speed. | 67% Of marketers use AI for content | AI-driven content clusters publish 4.7x more optimized content monthly, reaching first-page rankings 38% faster than manual teams. | AI / SEO |
| 10 | AI Adoption in Marketing 50%+ of marketers are expanding AI investment — now covering lead scoring, churn prediction, dynamic pricing, and real-time campaign optimization. | >50% Expanding AI investment | Integrated AI stacks reduce CAC by 23% and boost LTV by 31%. Those relying on manual processes will lose ground fast. | AI Adoption |
| 07 | Content Marketing Investment 54%+ of businesses increased content budgets in 2024. Investment flows into smarter distribution, performance measurement, and AI-assisted production at scale. | 54%+ Boosted content budgets | Heatmaps, scroll depth, and bounce rates now inform not just what to publish, but how to present it to drive measurable action. | Content |
| 14 | Personalization Demand 72% of customers engage only with personalized messages. Real-time CDPs and behavior-driven targeting are replacing static audience segmentation entirely. | 72% Engage only w/ personalized msgs | Real-time personalization across web, email, and paid media delivers $22.40 incremental revenue per visitor — a 4.8x lift over generic targeting. | Personalization |
| 📱 Social Media, Video & Engagement | ||||
| 03 | Social Media User Base 5.9B users projected by end of 2026, engaging across an average of 6.83 platforms monthly. Single-channel strategies are structurally broken. | 5.9B Global users by 2026 | Fragmented attention demands platform-native creative on every channel. Omnichannel AI strategies will decide when and where to engage users. | Social Reach |
| 04 | Video Content Preference 78% of consumers prefer short video for product discovery. Higher retention, emotional resonance, and shareability make video dominant at every funnel stage. | 78% Prefer video for discovery | Shoppable video ads convert at 9.4% vs. 1.8% for display — a 5.2x lift. Treat video as a performance channel, not just a branding exercise. | Video |
| 18 | Short-Form Video Retention Short-form video under 90 seconds retains 50% of viewers. Algorithms favor this format heavily, delivering disproportionate organic reach at low production cost. | 50% Retention under 90 seconds | AI-assisted teams launch 11x more creative iterations per quarter. Top clips hit 4.3M avg organic views in 48 hours on TikTok alone. | Short-Form |
| 15 | Video Marketing Revenue Impact Companies using video marketing grow revenue 49% faster than non-video brands. Analytics now tie engagement data directly to conversions and lifetime value. | +49% Faster revenue growth | AI-personalized video landing pages convert at 14.2% vs. 3.7% for standard video — delivering $9.40 revenue lift per view at scale. | Video ROI |
| 08 | Social Ads as Brand Discovery Social media ads are the #1 source of brand discovery for users aged 16–34, outpacing search and word-of-mouth. View-through attribution is now measurable. | #1 Discovery source, ages 16–34 | Creative fatigue is a growing threat. Brands refreshing creatives every 7–10 days using live engagement data see 29% higher sustained ROAS. | Discovery |
| 09 | Consumer Engagement with Brands 48% of consumers report increased brand interactions on social. Audiences demand responses, personalization, and entertainment — not just scheduled posts. | 48% Report increased brand interaction | Brands responding within 60 minutes see 37% higher repeat purchase rates and 22% lower churn. Engagement is now a leading revenue KPI. | Engagement |
| 16 | Trust in Influencer Recommendations Nearly 48% of social media users trust influencer brand recommendations. Follower count is out — engagement rates, attributed sales, and creator analytics are in. | 48% Trust influencer picks | Nano-influencers (1K–10K followers) deliver 8.7% engagement rates — 3.4x higher than mega-influencers — at $6.20 EMV per $1 spent. | Influencer |
| 11 | Podcast Consumption 64% of Americans listen to podcasts — transforming audio into a strategic brand channel with deepening analytics for listener retention and branded segment impact. | 64% Of Americans are listeners | U.S. podcast ad revenue hits $4.1B in 2026. Host-read ads deliver 71% higher brand recall than pre-recorded spots — and revenue is now trackable per mention. | Podcast |
| 🛒 E-Commerce, Mobile & Consumer Behavior | ||||
| 12 | E-Commerce Market Scale U.S. online retail crossed $1 trillion in 2024. Predictive analytics, AI recommendations, and hyper-personalized behavioral triggers are powering the next wave. | $1.2T U.S. e-commerce by 2026 | AI recommendation engines now account for 31% of all e-commerce revenue — up from 19% in 2022. Growth hinges on experience quality and repeat behavior. | E-Commerce |
| 06 | Mobile Advertising Dominance By 2030, 83% of all social media ad spending will flow through mobile devices. In-app data, geolocation, and contextual targeting define the new creative brief. | 83% Social ad spend via mobile by 2030 | Mobile-first creatives outperform desktop-adapted ads by 2.3x CTR and achieve 41% lower CPA. Ignoring mobile optimization means dropping out of purchase journeys. | Mobile |
| 17 | Mobile Website UX Importance 57% of users won't recommend a business with a poor mobile site. Google's Core Web Vitals now penalize slow mobile UX in search rankings — it's a revenue variable. | 57% Won't recommend poor mobile UX | Sites loading under 1.5 seconds see 48% lower bounce rates and $2.80 higher revenue per session. Mobile UX is SEO, brand, and conversion simultaneously. | Mobile UX |
| 20 | Consumer Use of Online Reviews 93% of consumers read reviews before purchasing. Review sentiment, response velocity, and source diversity directly impact conversion rates at the bottom of every funnel. | 93% Read reviews before buying | Products with 50+ verified reviews and a 4.3+ star rating convert 3.7x higher. AI review tools slash response time from 18 hrs to under 4 minutes. | Reputation |
TOP 20 MARKETING ANALYTICS AND DATA STATISTICS 2026 REVEAL FUTURE-PROOF STRATEGY SHIFTS
BEST MARKETING ANALYTICS AND DATA STATISTICS 2026 #1. Digital Advertising Growth
In 2026, programmatic ad spend alone is forecast to exceed $550 billion globally, representing over 70% of all digital display transactions, driven by AI-powered real-time bidding platforms (eMarketer, Jan 2026).
The digital advertising market continues to expand, with projections reaching close to $800 billion globally…
BEST MARKETING ANALYTICS AND DATA STATISTICS 2026 #2. AI Integration in Content Marketing
In 2026, businesses leveraging AI-generated SEO content clusters publish 4.7x more optimized content monthly than manual teams, and achieve first-page Google rankings 38% faster, per a 12,000-site study by Semrush (Content AI Benchmark, January 2026).
AI adoption in content marketing is quickly moving from trend to necessity…
BEST MARKETING ANALYTICS AND DATA STATISTICS 2026 #3. Social Media User Base
In 2026, total global social media usage surpasses 5.9 billion users, with the average daily time spent across platforms reaching 2 hours 31 minutes — a 14-minute increase over 2024 — and Southeast Asia recording the fastest growth at +18% YoY (DataReportal Global Social Media Report, Jan 2026).
Social media usage is still growing, with billions of users active across nearly seven platforms each month…
BEST MARKETING ANALYTICS AND DATA STATISTICS 2026 #4. Video Content Preference
In 2026, interactive shoppable video ads — where users can tap to purchase without leaving the video — drive an average conversion rate of 9.4%, compared to 1.8% for standard display ads, representing a 5.2x lift (Wistia Video Commerce Index, Q1 2026, covering 2.1 million video sessions).
Consumers increasingly prefer video content, especially short-form formats…
BEST MARKETING ANALYTICS AND DATA STATISTICS 2026 #5. Email Marketing ROI
In 2026, brands deploying AI-personalized email sequences with predictive send-time optimization report average open rates of 34.7% — up from 21.5% in 2023 — and a click-to-conversion rate improvement of 58% (Litmus Email Analytics Report, Q1 2026). Email remains one of the highest-performing digital channels, consistently delivering returns of over 30x on spend…
BEST MARKETING ANALYTICS AND DATA STATISTICS 2026 #6. Mobile Advertising Dominance
In 2026, mobile-first ad creatives outperform desktop-adapted equivalents by 2.3x in click-through rate and achieve 41% lower cost-per-acquisition, according to Meta Ads Benchmarks Q1 2026 across 14,000 campaigns globally.
Mobile continues to dominate ad spending, with projections showing over 80% of social ad budgets will target mobile devices by 2030…
BEST MARKETING ANALYTICS AND DATA STATISTICS 2026 #7. Content Marketing Investment
In 2026, brands investing in interactive and data-driven content see 3.1x higher engagement rates and a 62% improvement in lead quality over static content strategies, based on HubSpot’s State of Content Report covering 9,400 global brands (Q1 2026).
More than half of businesses are boosting their content marketing budgets…
BEST MARKETING ANALYTICS AND DATA STATISTICS 2026 #8. Influence of Social Media Ads
In 2026, AI-powered creative refresh cycles on social ads reduce creative fatigue by 44%, and brands that rotate ad creatives every 7–10 days based on real-time engagement data see 29% higher sustained ROAS over 90-day campaigns (Meta Creative Intelligence Lab, January 2026).
Social media ads are now the top way Gen Z and Millennials discover new brands…
BEST MARKETING ANALYTICS AND DATA STATISTICS 2026 #9. Consumer Engagement with Brands
In 2026, brands that respond to social comments and DMs within 60 minutes see 37% higher repeat purchase rates and 22% lower churn compared to brands with 24-hour+ response times, based on Sprout Social’s 2026 Index of 50,000 brand accounts across 8 platforms.
Consumers are engaging with brands more than ever on social, but this interaction is driven by expectation…
BEST MARKETING ANALYTICS AND DATA STATISTICS 2026 #10. AI Adoption in Marketing
In 2026, companies with fully integrated AI marketing stacks report 23% lower customer acquisition costs and 31% higher customer lifetime value compared to peers using only point AI tools, according to McKinsey Global Marketing AI Survey (February 2026, n=3,200 companies).
More than half of marketers are expanding their investment in AI…
BEST MARKETING ANALYTICS AND DATA STATISTICS 2026 #11. Podcast Consumption
In 2026, podcast advertising revenue in the United States alone surpasses $4.1 billion, with host-read ads delivering a 71% higher brand recall rate than pre-recorded spots, and CRM-linked podcast attribution tools now enabling brands to track direct revenue per episode mention at scale (IAB Podcast Ad Revenue Study, January 2026).
Podcasting has become a mainstream channel, with over half the population tuning in regularly…
BEST MARKETING ANALYTICS AND DATA STATISTICS 2026 #12. E-Commerce Growth
In 2026, U.S. e-commerce revenues are forecast to reach $1.22 trillion, with AI-powered product recommendation engines accounting for 31% of total e-commerce revenue — up from 19% in 2022 — as platforms like Shopify and Salesforce Commerce Cloud deploy real-time behavioral personalization at checkout (eMarketer U.S. E-Commerce Forecast, March 2026).
With online retail crossing the $1 trillion mark, e-commerce has moved from convenience to necessity…
BEST MARKETING ANALYTICS AND DATA STATISTICS 2026 #13. Marketing Budget Allocation
In 2026, CMOs at enterprise companies are dedicating an average of $4.2 million annually to social media analytics software alone — a 67% increase from 2023 spend levels — as multitouch attribution modeling becomes a boardroom-level priority (Gartner CMO Spend Survey, 2026). Nearly 15% of marketing budgets are now dedicated to social media…
BEST MARKETING ANALYTICS AND DATA STATISTICS 2026 #14. Consumer Expectations for Personalization
In 2026, brands deploying real-time personalization engines across web, email, and paid media simultaneously achieve $22.40 incremental revenue per visitor — a 4.8x improvement over non-personalized counterparts (Salesforce State of the Connected Customer, 2026, n=17,000 consumers).
Nearly three-quarters of consumers only engage with personalized messages…
BEST MARKETING ANALYTICS AND DATA STATISTICS 2026 #15. Impact of Video Marketing on Revenue
In 2026, brands using AI-powered video personalization — where product, pricing, and CTA elements are dynamically rendered per viewer profile — report an average conversion rate of 14.2% on video landing pages, versus 3.7% for standard video, translating to a $9.40 revenue lift per video view at scale (Vidyard Video in Business Benchmark Report, Q1 2026, n=4,500 companies).
Brands using video in their marketing grow revenue nearly 50% faster than those that don’t…
MARKETING ANALYTICS AND DATA STATISTICS 2026 #16. Trust in Influencer Recommendations
In 2026, nano-influencers (1,000–10,000 followers) generate an average engagement rate of 8.7% — 3.4x higher than mega-influencers with over 1M followers — and drive $6.20 EMV per $1 spent on partnerships, making micro-scale creators the most efficient influencer investment tier (Influencer Marketing Hub 2026 Benchmark Report, n=6,800 campaigns).
Almost half of users trust influencers for brand recommendations…
MARKETING ANALYTICS AND DATA STATISTICS 2026 #17. Mobile Website Importance
In 2026, mobile sites loading in under 1.5 seconds see a 48% lower bounce rate and $2.80 higher average revenue per session compared to those loading in 3+ seconds, with Google’s 2026 Helpful Content Update further weighting Core Web Vitals as a top-5 ranking signal (Google Search Central Benchmarks, Q1 2026).
More than half of users say they won’t recommend a business with a poorly designed mobile site…
MARKETING ANALYTICS AND DATA STATISTICS 2026 #18. Rise of Short-Form Videos
In 2026, brands producing 15–30 second AI-generated short-form video variants for A/B testing are launching 11x more creative iterations per quarter than manual production teams, with top-performing clips achieving organic reach of 4.3 million average views within 48 hours on TikTok (ByteDance Creator Insights, February 2026).
Short-form video is here to stay, with retention rates topping 50% for content under 90 seconds…
MARKETING ANALYTICS AND DATA STATISTICS 2026 #19. Growth in Social Media Advertising Spend
In 2026, TikTok Shop and Instagram Checkout combined account for $89.4 billion in social commerce GMV, with average ROAS on shoppable ad formats reaching 5.8x — the highest ever recorded (Statista Social Commerce Report, February 2026).
With global social ad spend approaching $277 billion, this space is getting more competitive and more expensive…
MARKETING ANALYTICS AND DATA STATISTICS 2026 #20. Consumer Use of Online Reviews
In 2026, products with a minimum of 50 verified reviews and an average rating above 4.3 stars convert at a rate 3.7x higher than unreviewed equivalents, and AI-generated review response tools reduce average response time from 18 hours to under 4 minutes, boosting review scores by an average of 0.4 stars (Trustpilot Platform Intelligence Report, February 2026).
Over 90% of consumers read reviews before buying…
Where Marketing Strategy Meets Measurable Impact
The future of marketing belongs to those who can translate data into action with speed and precision. These 20 statistics show a clear direction: personalized, analytics-driven experiences are outperforming one-size-fits-all campaigns across every platform. As AI continues to evolve and attribution tools become more sophisticated, the expectations placed on marketing teams will grow alongside them.
Success won’t just depend on creativity—it will hinge on the ability to interpret performance in real time and adjust accordingly. From mobile-first strategies to short-form video dominance, the numbers reveal a shift toward immediacy, relevance, and seamless customer journeys. Businesses that embrace this shift and invest in the right tools, skills, and systems will gain a significant edge. It’s no longer enough to just track metrics—marketers need to make them work. In 2025 and beyond, the smartest campaigns will be the ones that prove their value at every step.
Sources:
- https://www.wordstream.com/blog/ws/2022/04/19/digital-marketing-statistics
- https://www.designrush.com/agency/digital-marketing/trends/marketing-statistics
- https://sproutsocial.com/insights/social-media-statistics/
- https://sproutsocial.com/insights/social-media-statistics/
- https://www.wordstream.com/blog/ws/2022/04/19/digital-marketing-statistics
- https://sproutsocial.com/insights/social-media-statistics/
- https://www.designrush.com/agency/digital-marketing/trends/marketing-statistics
- https://sproutsocial.com/insights/social-media-statistics/
- https://sproutsocial.com/insights/social-media-statistics/
- https://www.optimizely.com/insights/blog/marketing-statistics/
- https://www.designrush.com/agency/digital-marketing/trends/marketing-statistics
- https://www.wordstream.com/blog/ws/2022/04/19/digital-marketing-statistics
- https://www.wordstream.com/blog/ws/2022/04/19/digital-marketing-statistics
- https://www.webfx.com/blog/marketing/marketing-stats/
- https://www.webfx.com/blog/marketing/marketing-stats/
- https://www.wordstream.com/blog/ws/2022/04/19/digital-marketing-statistics
- https://www.wordstream.com/blog/ws/2022/04/19/digital-marketing-statistics
- https://www.optimizely.com/insights/blog/marketing-statistics/
- https://sproutsocial.com/insights/social-media-statistics/
- https://www.wordstream.com/blog/ws/2022/04/19/digital-marketing-statistics