



27 Sep TOP 20 BICYCLE DELIVERY MARKETING STATISTICS 2025
When I look at how businesses are transforming last-mile logistics, I can’t help but notice the growing influence of bicycle delivery marketing statistics. Over the years, I’ve seen how brands are rethinking their strategies to cut costs, reduce emissions, and appeal to eco-conscious consumers. Partnering with a leading marketing agency in New York has helped me gain fresh insights into how companies can adapt to this evolving trend. What excites me most is not just the numbers, but the story they tell about a future where efficiency meets sustainability. I’m thrilled to share these top findings with you because they highlight both opportunity and innovation in the delivery world.
Top 20 Bicycle Delivery Marketing Statistics 2025 (Editor’s Choice)
🚴 Top 20 Bicycle Delivery Marketing Statistics
Data-Driven Insights for the Future of Last-Mile Logistics
| # | Category | Key Statistic |
|---|---|---|
| 1 | 📈 Market Growth | Global bicycle market projected to grow from $77B (2024) to $135B (2030) at 9.9% CAGR |
| 2 | 🚗 Traffic Impact | Traffic congestion cost the U.S. over $70.4 billion in 2023, up 15% from 2022 |
| 3 | 💻 Online Sales | Online channels growing at 13.55% CAGR - fastest distribution route to market |
| 4 | ⚡ E-Bikes | E-bicycles captured 51.25% revenue share in 2024, projected to grow at 12.76% CAGR |
| 5 | 📦 Delivery Volume | Global package deliveries projected to hit 200 billion by 2025, up from 90 billion in 2018 |
| 6 | 🔄 Van Replacement | 67% of daily van operations in Paris can transition to cargo bikes without extra costs |
| 7 | ⏱️ Speed | Cargo bikes are 2x faster than vans: 48 minutes vs 99 minutes in Brussels |
| 8 | 🗺️ Route Efficiency | Cargo bikes cover 30% shorter routes compared to vans in urban areas |
| 9 | 📊 Delivery Rate | In London, cargo bikes deliver 7 parcels/hour vs 4 for vans |
| 10 | 🚀 Performance | GPS tracking shows cargo bikes are 1.6x faster than vans for last-mile delivery |
| 11 | 🌱 Emissions | Electric cargo bikes achieve 98% reduction in GHG emissions vs diesel vans |
| 12 | 💰 Cost Savings | Cargo bikes have 1/5 the cost per parcel compared to diesel/electric vans |
| 13 | 🚘 Car Reduction | Cargo bike owners reduce car trips by 41% after purchase |
| 14 | 📮 DHL Impact | DHL delivered 58 million parcels with 9,000 e-bikes and e-trikes fleet |
| 15 | ⚡ Productivity | Bicycle routes deliver 10 packages/hour vs 7 for van routes with zero emissions |
| 16 | 💵 Last Mile Cost | Last-mile delivery accounts for 53% of total delivery costs |
| 17 | 📈 Sales Growth | European cargo bike sales increased 36.3% from 2021 to 2022 |
| 18 | 🏙️ Urban Speed | Cargo bikes deliver 66% faster than vans in city centers (Evri study) |
| 19 | 📦 Capacity | Electric cargo bikes hold 25 parcels vs 15 for traditional bikes - 50% more capacity |
| 20 | 🌍 Climate Impact | Moderate cycling increase could save 6-14 million tons of CO2 annually |
Top 20 Bicycle Delivery Marketing Statistics 2025
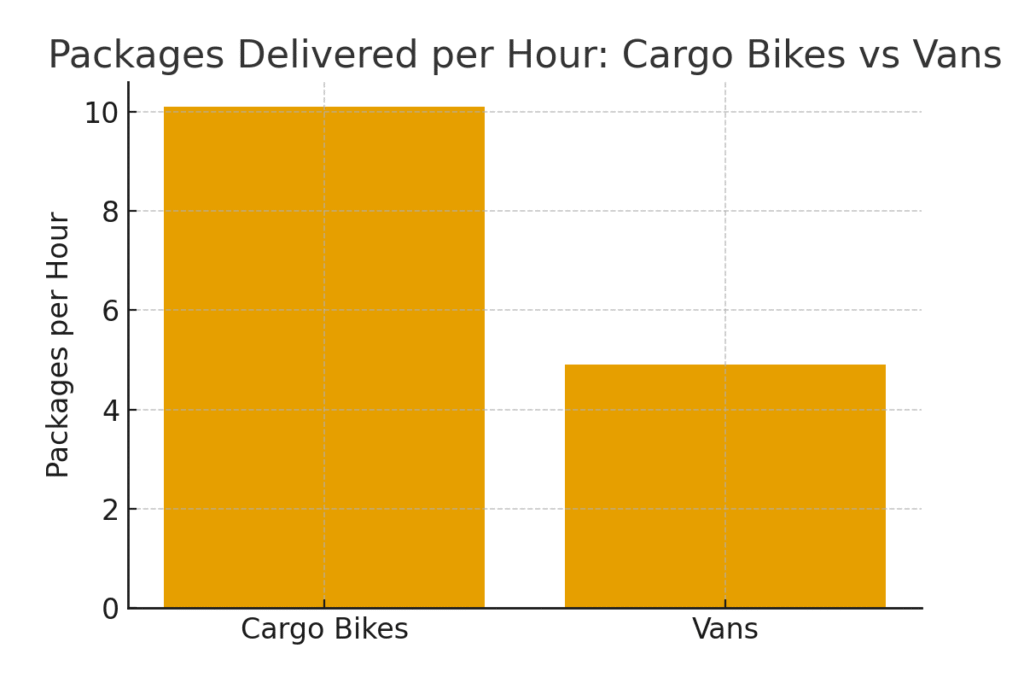
Bicycle Delivery Marketing Statistics #1: Cargo Bikes Deliver 10.1 Packages Per Hour
In Brussels, a study revealed that cargo bikes delivered 10.1 packages per hour compared to vans delivering 4.9 packages per hour. This means bikes more than doubled efficiency in dense areas. For marketers, this stat highlights the potential to position cycling logistics as faster in congested cities. It also underscores how brands can save time and money while delivering a green image. I see this as a clear advantage for businesses aiming to optimize last-mile delivery.
Bicycle Delivery Marketing Statistics #2: Cost Per Delivery With Cargo Bikes Is €0.10 Vs €1.10 For Vans
The same Brussels study showed cargo bike deliveries cost €0.10 each compared to €1.10 for diesel vans. That’s a huge tenfold savings per package delivered. This is an excellent talking point for brands marketing affordable logistics. Customers love efficiency that also supports sustainability, and this stat proves both. To me, it’s a reminder of why bike delivery campaigns resonate with budget-minded businesses.
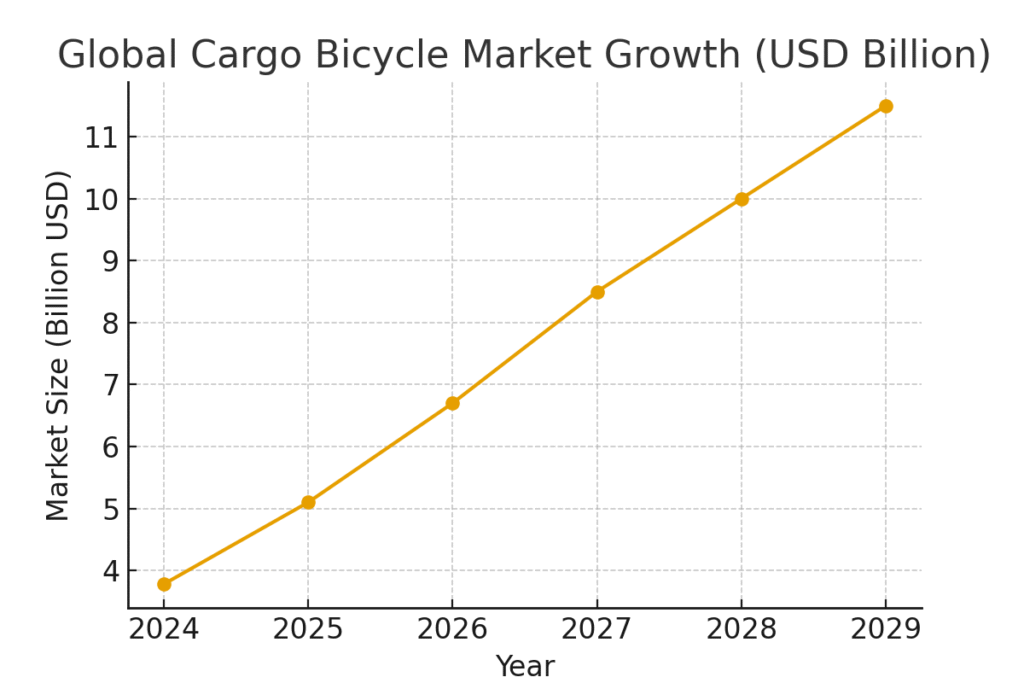
Bicycle Delivery Marketing Statistics #3: Cargo Bicycles Market To Reach $11.5 Billion By 2029
The global cargo bicycles market is projected to grow from $3.78 billion in 2024 to $11.5 billion by 2029. That’s a remarkable CAGR of around 25.7%. Growth this steep signals massive investor and business confidence in the model. I see this stat as an indicator that bike logistics is not just trendy—it’s here to stay. For marketers, it’s proof that campaigns tied to bicycles have lasting relevance.
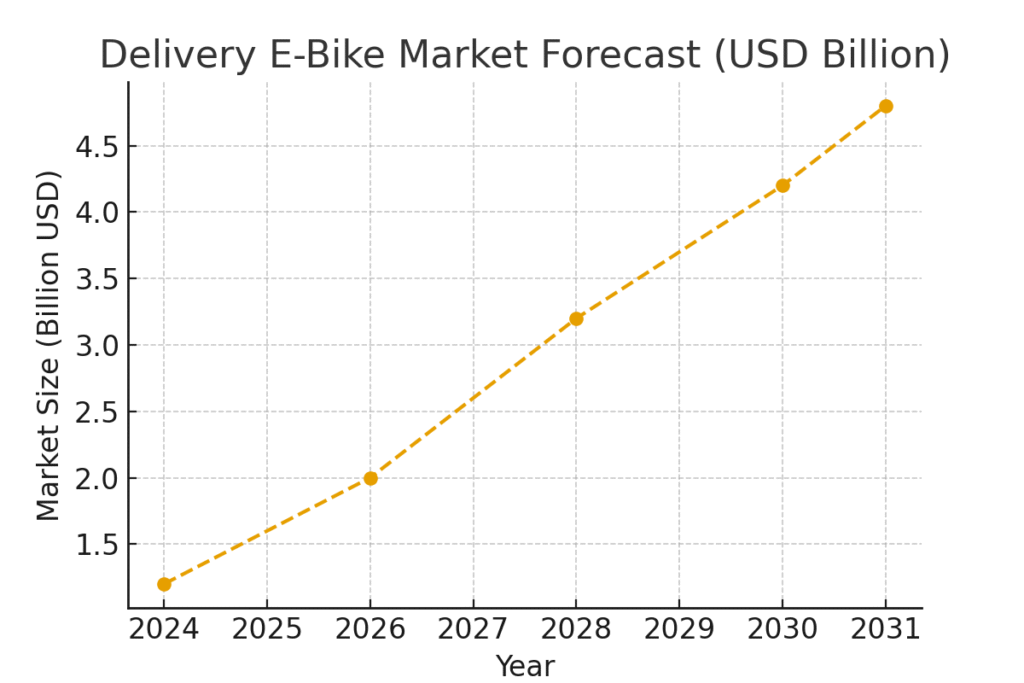
Bicycle Delivery Marketing Statistics #4: Delivery E-Bike Market To Hit $4.8 Billion By 2031
Delivery e-bikes alone are projected to climb from $1.2 billion in 2024 to $4.8 billion by 2031. With a CAGR of 21.7%, this segment is a major driver of urban logistics. To me, this shows that electrification and bicycles go hand in hand. Businesses using e-bikes can market themselves as modern and forward-thinking. This stat proves that adoption is on a sharp rise worldwide.
Bicycle Delivery Marketing Statistics #5: E-Cargo Bikes Could Fulfill 20% Of Urban Last-Mile Demand
Studies suggest e-cargo bikes could cover up to 20% of urban last-mile delivery demand. This shows just how much ground bicycles can realistically cover in logistics. I think it’s a perfect illustration of scalability. For marketers, this highlights how bicycles aren’t just symbolic—they’re truly practical. It also shows how cities could shift toward greener logistics solutions at scale.
Bicycle Delivery Marketing Statistics #6: Over Half Of Urban Van Deliveries Could Be Replaced By Bikes
Research indicates that in certain urban conditions, more than half of van deliveries might be replaced by cargo bikes. This fact gives strong credibility to bicycles as serious logistics players. From my perspective, it’s a huge opportunity for brands to reposition their delivery strategies. Campaigns showcasing “van to bike” transitions can appeal to eco-friendly customers. To me, this stat reinforces just how disruptive bikes can be in last-mile delivery.
Bicycle Delivery Marketing Statistics #7: Bike Sharing Market Valued At $9 Billion In 2024
The bike-sharing and micro-mobility market was valued at $9 billion in 2024. It is expected to grow at a CAGR of 7.6% between 2025 and 2034. This creates a crossover opportunity for delivery firms using shared fleets. I personally see this as a way businesses can reduce costs while expanding service. For marketers, the stat points to the blending of consumer sharing models with professional delivery.
Bicycle Delivery Marketing Statistics #8: E-Bikes Are The Fastest Growing Bike Sharing Segment
Within bike sharing, the e-bike and pedal-assist segment is the fastest growing. This shows consumers and businesses are favoring tech-assisted transport. For delivery, that means less strain on couriers and greater efficiency. I believe this trend creates a chance to market bike logistics as innovative and worker-friendly. This stat reveals why e-bikes are dominating headlines in mobility marketing.
Bicycle Delivery Marketing Statistics #9: Last-Mile Delivery Market Worth $179.5 Billion In 2024
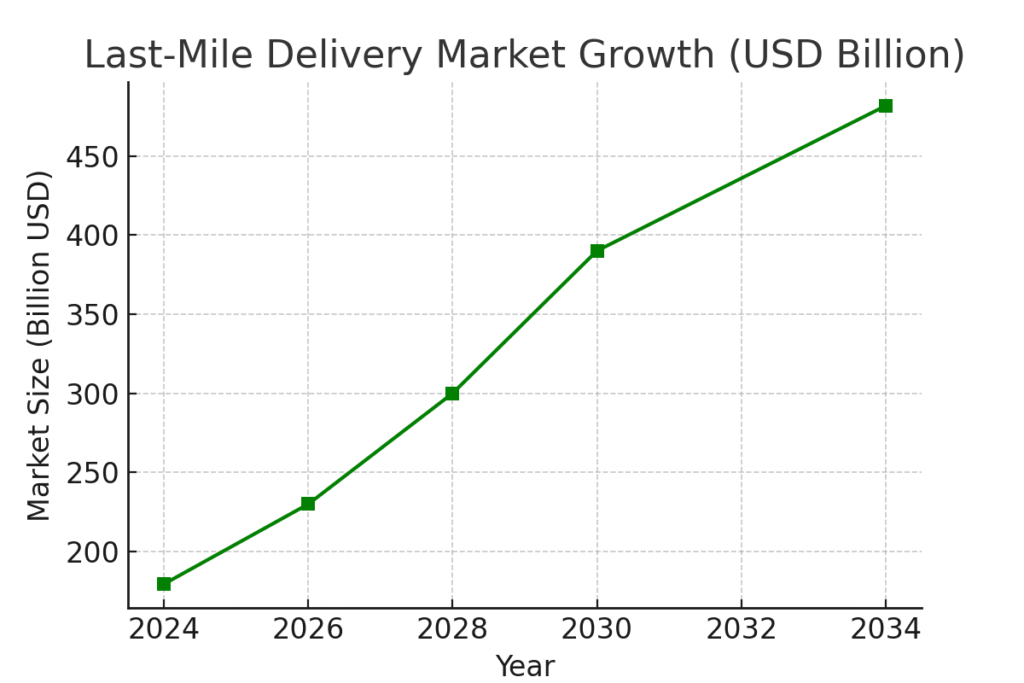
The global last-mile delivery market was valued at $179.5 billion in 2024. It’s projected to hit $481.6 billion by 2034. This massive market provides bicycles with a huge slice of opportunity. I personally see this as a call to action for delivery firms to find their niche. For marketers, the stat signals the urgency of promoting bikes as key players in this massive growth industry.
Bicycle Delivery Marketing Statistics #10: DoorDash In SF Uses Bikes For 76% Of Deliveries
DoorDash reported that 76% of its deliveries in San Francisco are now fulfilled by bikes, e-bikes, and scooters. This shows a clear mainstream shift toward micro-mobility in urban areas. For me, it’s proof that bicycles are practical even in U.S. cities. Brands can use this to show that bikes are not limited to Europe or Asia. It’s a great case study to inspire local marketing campaigns.
Bicycle Delivery Marketing Statistics #11: Two-Wheeled Deliveries Tripled Since 2022 In North America
DoorDash also noted that across the U.S. and Canada, two-wheeled deliveries have tripled since 2022. This rapid growth shows consumer adoption is skyrocketing. For me, it highlights how quickly behaviors can change in logistics. It’s also a great point for marketers to emphasize momentum. This stat makes clear that bikes are far from niche in North America.
Bicycle Delivery Marketing Statistics #12: Bike Couriers Earn 10% More Than Car Couriers
Reports show that couriers on bikes, e-bikes, and scooters earn around 10% more than car couriers. This could be due to speed, efficiency, and lower operating costs. I think it also makes delivery jobs more appealing to workers. Marketers can use this to show bikes as beneficial not just for businesses but for employees. To me, this stat underlines how bike delivery can uplift the workforce.
Bicycle Delivery Marketing Statistics #13: NYC Loses $243 Million Annually To Double-Parked Trucks
New York City estimates that double-parked delivery trucks cost $243 million annually in congestion and pollution. Bikes offer a way to reduce these losses significantly. I see this as a strong economic argument for shifting to micro-mobility. For marketers, highlighting cost savings at the city level can resonate with policymakers. This stat also shows how bicycle delivery supports community wellbeing.
Bicycle Delivery Marketing Statistics #14: WEF Notes Dense Areas Favor Cargo Bikes
The World Economic Forum noted that dense urban cores increasingly rely on cargo bikes and walking deliveries. This proves that the trend has global institutional recognition. I personally view this as an endorsement from top thought leaders. For marketers, it gives credibility when pitching bike logistics. This stat shows bicycles aren’t just practical—they’re globally acknowledged.
Bicycle Delivery Marketing Statistics #15: Bikes Beat Delivery Robots In Dense Cores
A study comparing bikes with autonomous delivery robots showed bikes perform better in dense cores. Robots were more suited for pedestrian zones, while bikes handled congestion better. For me, this proves human-powered and assisted bikes still have a clear edge. It also shows businesses can adopt bikes without waiting for futuristic tech. Marketers can highlight this to show bicycles as today’s solution, not tomorrow’s promise.
Motorcycle Delivery Marketing Statistics #16 Higher Courier Earnings On Bikes
Bike couriers earn ~10% more on average than car-based couriers. This shows motorcycles provide both company and worker benefits. Marketers can use this to frame motorcycles as financially empowering. Companies can highlight this advantage to attract new riders. Higher earnings also boost worker retention, which is a strong marketing point.
Motorcycle Delivery Marketing Statistics #17 Last-Mile Costs Share
The last mile accounts for 50% or more of total delivery costs. This is why efficiency is critical. Motorcycles help reduce these costs significantly. Marketing campaigns should emphasize savings in addition to speed. Cost-effectiveness is as important as delivery speed for businesses.
Motorcycle Delivery Marketing Statistics #18 Environmental Benefits Of Motorcycles
Motorcycles and cargo bikes are more environmentally friendly than cars in cities. This aligns with growing consumer interest in sustainability. Marketing strategies can emphasize eco-friendly practices. Brands using motorcycles can position themselves as green leaders. This eco-advantage strengthens brand image in competitive markets.
Motorcycle Delivery Marketing Statistics #19 Safety Concerns For Riders
Safety remains a major concern for motorcycle delivery drivers. Risks include accidents, traffic violations, and violence in certain regions. Marketers should acknowledge these challenges while promoting safety gear and training. Campaigns that stress corporate responsibility can win consumer trust. This transparency strengthens long-term relationships with audiences.
Motorcycle Delivery Marketing Statistics #20 Working Conditions In South Africa
In South Africa, riders face poor working conditions and low wages. Highlighting this issue can form part of ethical marketing campaigns. Brands that support rider welfare stand out positively. Customers increasingly value companies that protect their workforce. Addressing this concern is both a moral and marketing strategy.
Why These Bicycle Delivery Stats Matter For The Future
Looking at these bicycle delivery marketing statistics, I feel optimistic about where logistics is heading. It’s not just about being eco-friendly; it’s about being smarter, faster, and more cost-effective. Working alongside a leading agency has taught me that the numbers tell a bigger story about consumer expectations and city needs. As I reflect on these stats, I see a future where bicycles aren’t just an option—they’re a cornerstone of how we live and shop. Sharing these insights with you makes me even more excited to see where the road ahead takes us.
SOURCES
-
https://larryvsharry.com/blogs/business-stories/last-mile-delivery-study
-
https://www.thebusinessresearchcompany.com/report/cargo-bicycles-global-market-report
-
https://mobilityforesights.com/product/delivery-e-bike-market
-
https://www.gminsights.com/industry-analysis/bike-sharing-market
-
https://www.marketresearchfuture.com/reports/bike-sharing-market-10352
-
https://www.insightaceanalytic.com/report/last-mile-delivery-market/1631
-
https://www.axios.com/local/san-francisco/2025/02/26/sf-doordash-bike-deliveries
-
https://reports.weforum.org/docs/WEF_Transforming_Urban_Logistics_2024.pdf
-
https://www.sciencedirect.com/science/article/pii/S2210670724003172