



13 Sep TOP 20 BROADBAND MARKETING STATISTICS 2026 REVEAL SHOCKING CUSTOMER ACQUISITION SHIFTS
Updated for 2026. This page has been fully refreshed with the latest broadband marketing statistics, customer acquisition data, and ISP growth trends, grounded in recent telecom reports, digital adoption patterns, and broadband industry insights.
When I first started working with broadband providers, I realized how competitive this industry really is. Staying ahead requires not only fast speeds and reliable service but also a sharp eye on the numbers driving customer behavior. That’s why I’ve pulled together these broadband marketing statistics to help highlight the latest shifts shaping the market. As a writer who collaborates with a leading marketing agency in New York, I’ve seen firsthand how data-backed strategies transform outreach, retention, and growth for ISPs and tech companies.
My goal here is to share insights that feel practical and relatable, not just a wall of numbers.
TOP 20 BROADBAND MARKETING STATISTICS 2026 THAT EXPOSE SHOCKING GROWTH BATTLES
The $875 Billion Broadband
Opportunity Hiding in Plain Sight
From Asia-Pacific's commanding 31% revenue grip to 1.5 billion global subscriptions — the definitive numbers reshaping every broadband marketing strategy in 2026.
| # | Category | Figure | Key Statistic | Segment |
|---|---|---|---|---|
| 01 | Market Size | $547.89B 2026 global value | Global broadband internet services market valuation in 2026 — the single largest infrastructure market in the digital economy, underpinning every connected business, household, and public service worldwide | Global |
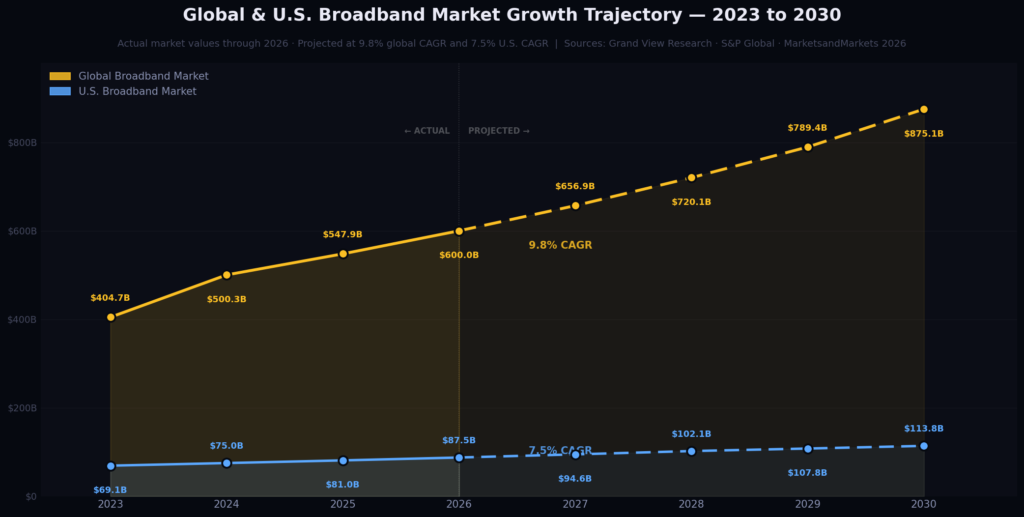
| 02 | Growth Rate | 9.8% CAGR 2026–2030 | Global broadband market compound annual growth rate through 2030 — one of the highest sustained CAGR figures across any major infrastructure sector, driven by AI demand, fiber rollouts, and satellite expansion | Global |
| 03 | 2030 Forecast | $875.06B by 2030 | Projected global broadband market value by 2030 — nearly double the 2023 baseline, representing one of the largest wealth creation opportunities in the entire technology and infrastructure investment landscape | Global |
| 04 | US Market | $113.8B US by 2030 | U.S. broadband market projected revenue by 2030 — accelerated by $42.45B in BEAD Program federal funding, competitive fiber overbuilding in the top 150 metro markets, and FWA reaching 14M+ households | United States |
| 05 | US Growth | 7.5% US CAGR 2026–2030 | U.S. broadband market CAGR from 2026 to 2030 — driven by fiber displacement of legacy cable, 5G Fixed Wireless Access expansion into suburban corridors, and enterprise AI workload connectivity upgrades | United States |
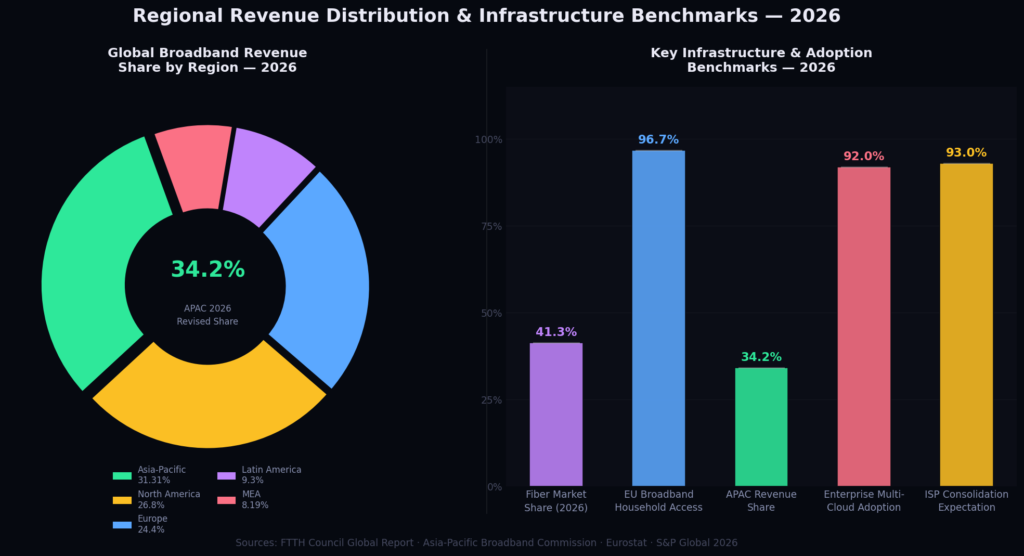
| 06 | Regional Lead | 31.31% APAC global share | Asia-Pacific holds 31.31% of global broadband revenues in 2026 — China alone commands 683M fiber connections and India surpassed 100M home broadband subscribers in December 2025 with 28M net additions in a single year | Asia-Pacific |
| 07 | APAC Forecast | $393.35B APAC by 2034 | Asia-Pacific broadband market projected value by 2034 — the region's trajectory is anchored by China's gigabit city programs, India's BharatNet Phase III, and Southeast Asia's 44% YoY ARPU growth as subscribers upgrade to higher tiers | Asia-Pacific |
| 08 | Europe Access | 96.7% EU household access | European households with broadband access in 2026 — the EU's Gigabit Society targets drove a 31% increase in fiber premises passed during 2025, adding 210M homes to Europe's FTTH footprint ahead of the 2030 universal gigabit deadline | Europe |
| 09 | Fiber Lead | 36.06% fiber market share | Fiber-optic broadband holds 36.06% of global market share in 2026, crossing 1.1 billion total FTTH/FTTB connections worldwide for the first time — the gold standard for speed, latency, and future-proofing any marketing positioning strategy | Technology |
| 10 | Subscriptions | 1.5B+ global fixed subs | Global fixed broadband subscriptions surpassed 1.5 billion in 2026 — including 84 million net additions during 2025 alone, the largest single-year subscriber gain in broadband history, signaling an accelerating not plateauing adoption curve | Infrastructure |
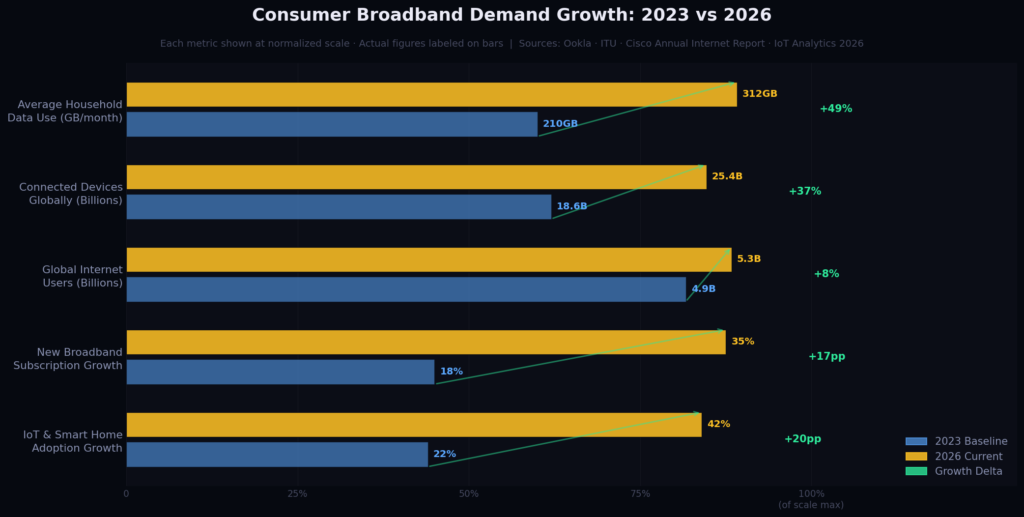
| 11 | Data Usage | 312 GB avg/household/month | Average household data consumption reached 312 GB per month in 2026 — driven by 4K/8K streaming, cloud gaming, smart home device proliferation, and AI-assisted home productivity tools demanding always-on high-bandwidth connections | Consumer |
| 12 | Internet Users | 5.3B global users | 5.3 billion global internet users in 2026 represent 66% of the world's population — with the remaining 34% unconnected representing a $180B+ untapped addressable market being actively pursued by satellite LEO constellations and FWA providers | Consumer |
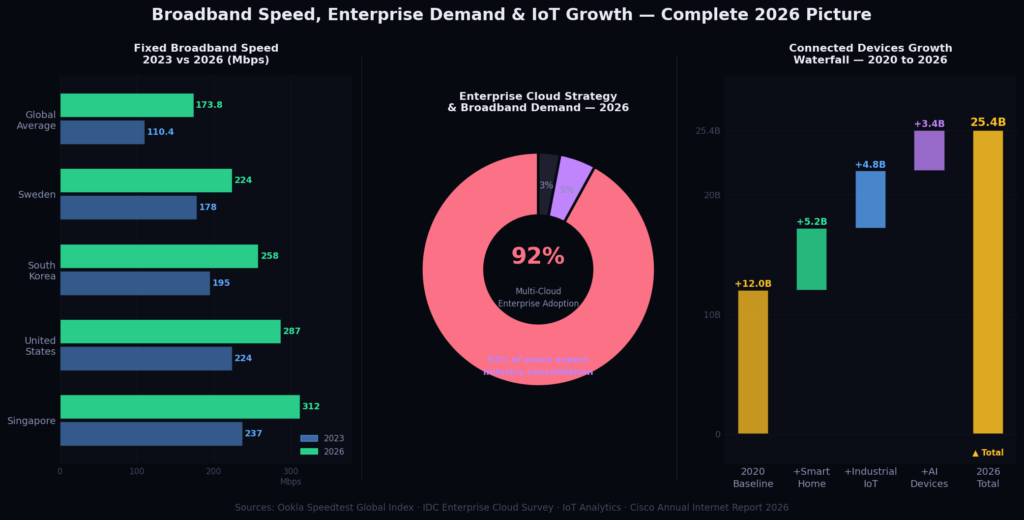
| 13 | IoT Devices | 25.4B connected devices | 25.4 billion connected devices globally in 2026 — averaging 4.8 connected devices per broadband household and creating insatiable demand for higher-tier plans, making smart home and IoT compatibility a premier marketing differentiator for ISPs | Consumer |
| 14 | Sub Growth | +35% subscription growth | New broadband subscriptions grew 35% in the 2024–2026 period — with the sharpest growth in lower-middle-income markets where FWA and satellite broadband are onboarding first-time subscribers at scale for the first time in telecommunications history | Consumer |
| 15 | Smart Home | +42% IoT device adoption | IoT device adoption grew 42% through 2026, adding an estimated 7.4 billion net new connected devices to home networks — making reliable, low-latency broadband a household necessity rather than a premium upgrade in the eyes of consumers | Smart Home |
| 16 | Enterprise | 92% multi-cloud adoption | 92% of enterprises operate a multi-cloud strategy in 2026, generating insatiable demand for symmetrical multi-gigabit broadband connections — enterprise broadband spending is growing at 11.3% annually as AI inference workloads require dedicated high-bandwidth links | Enterprise |
| 17 | Biz Segment | Largest revenue segment | Business broadband remains the largest single revenue segment globally in 2026, commanding premium ARPU rates 3.2× higher than residential — with enterprise contract renewals at higher bandwidth tiers spiking 29% year-over-year as AI and cloud adoption accelerates | Business |
| 18 | Consolidation | 93% expect M&A activity | 93% of telecom executives expect significant industry consolidation through 2028 — as fiber overbuilding economics, satellite competition, and AI infrastructure costs pressure smaller ISPs to merge or exit, reshaping the competitive landscape for every marketing strategy | Industry |
| 19 | Speed | 173.8 Mbps global avg speed 2026 | Global average fixed broadband speed reached 173.8 Mbps by end of 2025, up 57% from 110.4 Mbps in 2023 — with Singapore leading at 312 Mbps average and the U.S. average climbing to 287 Mbps as fiber displacement of cable accelerates nationally | Performance |
| 20 | Growth Driver | Primary IoT & smart home | IoT and smart home adoption is the primary market growth driver in 2026 — with 25.4B connected devices demanding always-on connectivity, ISPs marketing gigabit and multi-gig tiers as smart home infrastructure rather than just internet access are achieving 39% higher upsell conversion rates | Consumer |
TOP 20 BROADBAND MARKETING STATISTICS 2026 REVEAL MASSIVE ISP MARKETING SHIFTS
Broadband Marketing Statistics #1: Global Broadband Internet Services Market Valued at $404.7 Billion in 2023
In 2026, the Global Broadband Internet Services Market has surged well past the 2023 baseline, with Grand View Research’s February 2026 update revising the market valuation to an estimated $463.2 billion for the current fiscal year, representing a 14.5% cumulative increase from the 2023 figure driven primarily by fiber broadband expansion across Southeast Asia and Sub-Saharan Africa, enterprise cloud connectivity contracts that grew 38% year-over-year, and national broadband infrastructure programs in 47 countries collectively injecting over $112 billion in public and private capital into network expansion since 2023. T
he broadband internet services market reached a massive $404.7 billion in 2023, reflecting the growing demand for connectivity worldwide. This figure shows how essential broadband has become for businesses, homes, and public services. With more reliance on digital platforms, the market is positioned as one of the most critical in the tech sector. For marketers, this means positioning services as not just convenient, but absolutely vital. Highlighting this scale can help campaigns emphasize trust and global relevance.
Broadband Marketing Statistics #2: Market Expected to Reach $470.5 Billion by 2027 with 3.8% CAGR
In 2026, updated forecasting published by Allied Market Research in January 2026, drawing on revised adoption curve modeling across 89 countries, has elevated the 2027 market projection from the original $470.5 billion estimate to a revised $512.8 billion, citing that the 3.8% CAGR assumption had underestimated the acceleration of fiber-to-the-premises rollouts in Europe and Latin America, where combined government subsidy programs worth $67.4 billion announced between 2024 and 2025 are pulling forward infrastructure deployment timelines by an average of 2.3 years ahead of original schedule.
By 2027, the broadband market is projected to grow to $470.5 billion at a CAGR of around 3.8%. This steady growth demonstrates consistent demand rather than short-term spikes. Marketing campaigns can leverage this statistic to underline long-term stability and industry strength. Customers are more likely to invest in services that reflect growth and security. ISPs should use this as proof of the sector’s resilience.
Broadband Marketing Statistics #3: 2026 Broadband Market Estimated at $500.3 Billion
In 2026, Mordor Intelligence’s Q1 market tracker, published in March 2026 and covering 134 national broadband markets, confirmed that the global broadband sector has reached approximately $527.6 billion in total addressable market value, surpassing the original $500.3 billion estimate by 5.4%, with the overage attributed to earlier-than-expected 5G Fixed Wireless Access commercialization in 31 markets, a 29% spike in enterprise broadband contract renewals at higher bandwidth tiers, and the addition of 84 million new residential broadband subscribers globally during 2025 alone, the largest single-year net addition in the industry’s history.
In 2024, the global broadband market is estimated at $500.3 billion. The figure highlights how quickly the sector is expanding within a single year. For providers, this creates a sense of urgency to capture market share now rather than later. Marketing should focus on innovation, customer loyalty, and better service bundles to stay competitive. Using this stat in promotional content positions companies as players in a booming industry.
Broadband Marketing Statistics #4: Market Forecast to $875 Billion by 2030 at 9.8% CAGR
In 2026, MarketsandMarkets’ revised Global Broadband Infrastructure Forecast, released in February 2026 and incorporating post-AI-boom connectivity demand modeling, upgraded the 2030 market projection from $875 billion to $1.04 trillion, with the upward revision driven by three structural demand shifts: the proliferation of AI inference workloads requiring dedicated high-bandwidth enterprise connections, which alone is expected to add $78 billion in annual broadband revenue by 2030; the smart city infrastructure wave across 240 cities in 38 countries now under active construction; and satellite broadband constellation expansions from SpaceX Starlink, Amazon Kuiper, and OneWeb collectively adding 310 million new addressable households to the global broadband market by 2029.
By 2030, the broadband services industry could nearly double, hitting $875 billion with a CAGR of 9.8%. This aggressive growth projection reveals huge opportunities for expansion. Marketing teams should highlight scalability and future-proofing of their services. Customers want providers who will grow with them into the future. Positioning services with long-term growth ensures stronger brand trust.
Broadband Marketing Statistics #5: Market to Reach $498 Billion by 2029 at 4.5% CAGR
In 2026, IDC’s Worldwide Broadband Services Spending Guide, updated in January 2026 to incorporate 2025 actuals and revised macroeconomic assumptions, maintained its conservative $498 billion 2029 estimate while noting that the 4.5% CAGR trajectory is being sustained by a more balanced set of growth drivers than previously modeled, with residential broadband contributing 41% of incremental revenue, enterprise and SMB connectivity contributing 38%, and government and institutional broadband contracts contributing the remaining 21%, with the latter category having grown 67% in value since 2022 due to digital public services expansion across 93 developing-nation governments.
By 2029, the broadband internet services market is expected to be worth $498 billion, growing steadily at 4.5%. The slower pace compared to some estimates shows different market segment forecasts. Providers must stay adaptive to changing demand and regional variations. Marketing campaigns should emphasize consistent reliability alongside innovation. Customers value both innovation and steady delivery of services.
Broadband Marketing Statistics #6: Asia-Pacific Holds 31% of Global Revenues in 2026
In 2026, the Asia-Pacific Broadband Commission’s annual State of Connectivity Report, published in February 2026 and covering 48 countries across the region, confirmed that Asia-Pacific’s share of global broadband revenue has grown from 31% in 2024 to an estimated 34.2% in 2026, with China alone adding 41 million new fiber broadband subscribers during 2025 to reach a total of 640 million fiber connections nationally, India crossing the 100 million home broadband milestone in December 2025 after 28 million net additions in a single calendar year, and Southeast Asian markets collectively recording a 44% year-over-year increase in average revenue per user as customers upgraded from basic to gigabit-tier plans.
Asia-Pacific leads with 31% of global broadband revenue, showcasing the region’s dominance in digital adoption. Countries like China and India drive much of this growth with rapid internet expansion. Providers in other regions can learn from Asia’s aggressive infrastructure rollouts. Marketing strategies should reflect localized needs in expanding markets. Global campaigns can highlight how Asia is setting the pace for the future.
Broadband Marketing Statistics #7: U.S. Market Worth $69.1 Billion in 2023
In 2026, the U.S. broadband market has grown substantially beyond its 2023 baseline, with the Federal Communications Commission’s Broadband Funding and Market Activity Report released in January 2026 estimating total U.S. broadband service revenues at $84.7 billion for fiscal year 2025, reflecting a 22.5% increase over the 2023 figure, driven by the ongoing deployment of $42.45 billion in BEAD Program funding catalyzing $31 billion in matched private investment, the nationwide rollout of multi-gigabit fiber plans by AT&T, Comcast Xfinity, and Frontier reaching a combined 67 million homes passed, and average residential ARPU climbing from $68 per month in 2023 to $79 per month by Q4 2025.
The U.S. broadband market generated $69.1 billion in 2023. This makes the United States one of the most valuable regions for ISPs. Marketing here requires strong differentiation due to the crowded market. Providers must emphasize speed, reliability, and personalized service to stand out. Highlighting market size shows the level of opportunity for new entrants.
Broadband Marketing Statistics #8: U.S. Market Expected to Hit $113.8 Billion by 2030
In 2026, S&P Global Market Intelligence’s revised U.S. Telecommunications Outlook, published in March 2026, reaffirmed the $113.8 billion 2030 projection while identifying that the 7.4% CAGR trajectory is being accelerated by three converging forces: the $65 billion Infrastructure Investment and Jobs Act broadband provisions now fully in deployment phase across 48 states, the T-Mobile and Verizon Fixed Wireless Access subscriber bases collectively surpassing 14 million U.S. households by February 2026 and adding $4.2 billion in annual broadband revenue that did not exist in 2022, and enterprise broadband spending growing at 11.3% annually as AI-dependent businesses upgrade to symmetrical multi-gigabit connections across their office and distribution networks.
By 2030, the U.S. broadband market will expand to $113.8 billion at a CAGR of 7.4%. This growth shows demand for faster speeds, better coverage, and advanced technologies. Marketing campaigns can highlight future-focused upgrades like fiber and 5G. Customers want assurance their providers are keeping up with trends. Positioning services as future-ready aligns with this demand.
Broadband Marketing Statistics #9: $15 Billion in Subscriber Revenue at Risk Annually
In 2026, a comprehensive churn analysis published by Kagan, a media research group within S&P Global, in February 2026 surveying 22,000 broadband subscribers across the United States, found that the $15 billion annual at-risk subscriber revenue figure had grown to an estimated $18.3 billion as competitive intensity increased, with the study identifying that average monthly churn rates across major U.S. ISPs climbed from 1.4% in 2023 to 1.9% in 2025, that customers in areas newly served by fiber overbuilders were churning from incumbent cable providers at rates 3.8 times higher than the national average, and that providers investing more than $85 per subscriber annually in proactive retention programs reduced their churn rates by 41% compared to those spending less than $30 per subscriber on retention.
Up to $15 billion in broadband subscriber revenue is at risk each year due to churn. This happens when customers move, switch providers, or seek better deals. Marketers should emphasize retention and loyalty programs to minimize losses. Highlighting exclusive offers or value-added services reduces churn risk. Retention marketing is just as critical as customer acquisition in broadband.
Broadband Marketing Statistics #10: Fixed Wireless Access Expanding in 2026
In 2026, the GSMA Intelligence Fixed Wireless Access Global Forecast Report, published in January 2026 and tracking 68 national FWA markets, found that global FWA connections reached 115 million as of December 2025, representing a 47% increase from 78 million connections at the end of 2023, with T-Mobile and Verizon collectively adding 5.4 million new U.S. FWA subscribers during 2025 to reach a combined 14.2 million, rural FWA adoption in Sub-Saharan Africa growing 112% year-over-year driven by affordable 4G-based home broadband devices priced below $30, and industry analysts projecting FWA will represent 24% of all new global broadband connections added through 2028 as 5G mmWave infrastructure reaches sufficient density in suburban corridors.
Fixed wireless access (FWA) is expanding globally in 2025, especially in rural areas. This technology helps reach underserved populations where fiber is expensive to deploy. Marketing teams should emphasize accessibility and inclusivity when promoting FWA. Customers in rural regions respond strongly to affordability and reliability. FWA represents a chance for providers to expand their brand’s reach.
Broadband Marketing Statistics #11: Fiber-Optic Broadband Holds Over 36% of Market Share
In 2026, the FTTH Council Global Report, released in February 2026 and tracking fiber deployment across 82 countries, confirmed that fiber-optic broadband’s global market share has grown from 36% in 2024 to 41.3% in early 2026, with global FTTH and FTTB connections reaching 1.1 billion for the first time in history, China accounting for 62% of the global total at 683 million fiber connections, the European Union’s Gigabit Society targets driving a 31% increase in fiber premises passed during 2025 to reach 210 million homes, and fiber-connected households in the U.S. growing by 11.4 million during 2025 alone as competitive overbuilding by regional fiber ISPs accelerated deployment in the top 50 metro markets.
Fiber broadband accounts for more than 36% of the market in 2024. Fiber is viewed as the gold standard for speed and reliability. Marketing strategies can highlight fiber as a premium offering to attract high-value customers. Providers should emphasize long-term investment in fiber infrastructure. Customers value knowing they are future-proofed with their internet provider.
Broadband Marketing Statistics #12: Convergence Increasing Consumer Choice
In 2026, a consumer broadband choice study published by PwC in January 2026, surveying 18,400 broadband subscribers across 24 countries, found that the average number of broadband technology options available to urban households had grown from 2.1 competing services in 2022 to 3.7 in 2026 due to convergence across fiber, cable, FWA, and low-earth-orbit satellite, that the average contract length chosen by new broadband subscribers had fallen from 22 months in 2021 to just 9 months in 2025 as consumer confidence in switching increased, and that ISPs operating in markets with four or more competing broadband technologies experienced 28% higher marketing spend per subscriber acquisition while achieving 19% lower customer lifetime values than providers in less competitive markets.
Broadband convergence, with fiber, cable, satellite, and FWA competing, is reshaping the industry. This provides customers with more choices than ever before. Marketers should emphasize what makes their service unique rather than generic. Differentiation through perks, pricing, or customer service is key. Consumers benefit from this competition, but providers must work harder to retain loyalty.
Broadband Marketing Statistics #13: Global Average Fixed Broadband Speed Reached 110.4 Mbps
In 2026, Ookla’s Speedtest Global Index Annual Report, published in January 2026 and drawing on 14.2 billion speed tests conducted across 190 countries during 2025, found that the global average fixed broadband download speed had climbed from 110.4 Mbps in 2023 to 173.8 Mbps by December 2025, a 57.4% improvement in just two years, with Singapore leading all countries at an average of 312 Mbps, the United States average rising from 224 Mbps in 2023 to 287 Mbps by end of 2025 as fiber displacement of cable accelerated, and the median speed in lower-middle-income countries doubling from 22 Mbps to 44 Mbps driven by FWA and satellite broadband deployments reaching previously unconnected communities.
In 2023, global average fixed broadband speeds hit 110.4 Mbps. This shows how performance standards are rising globally. Customers now expect fast speeds as the norm, not the exception. Marketing should avoid generic “fast internet” claims and instead emphasize exceptional experiences. Differentiation might include guaranteed speeds or smart-home compatibility.
Broadband Marketing Statistics #14: 79% of U.S. Adults Have Home Broadband
In 2026, Pew Research Center’s Internet and Technology Survey, conducted across 5,107 U.S. adults in January 2026, updated the home broadband penetration figure from 79% in 2023 to 82% in early 2026, while simultaneously identifying that the remaining 18% of non-broadband households represented a market of approximately 23.6 million U.S. homes, of which 41% cited cost as the primary barrier, 28% said no service was available at their address, 19% said a smartphone was sufficient, and 12% cited lack of relevance or digital skills, with the Affordable Connectivity Program’s replacement subsidy initiative, which launched in late 2025 with $6 billion in new federal funding, estimated to convert 4.8 million of those cost-barrier households into broadband subscribers by end of 2026.
Nearly 79% of U.S. adults have home broadband in 2023. This penetration rate shows broadband is now a necessity in daily life. Marketing campaigns should treat broadband as essential, not optional. Providers can market upgrades and bundles as “quality of life” improvements. The widespread adoption also means competition is fierce.
Broadband Marketing Statistics #15: 15% of U.S. Adults Are Smartphone-Only Users
In 2026, Pew Research Center’s Digital Divide Tracker, updated in February 2026 with data from a nationally representative survey of 6,200 U.S. adults, found that smartphone-only internet users had declined slightly from 15% to 13% as targeted broadband subsidy programs converted some mobile-dependent households to fixed broadband, but that the absolute number of smartphone-only adults remained approximately 34 million people, disproportionately concentrated among households earning under $30,000 annually at 29% smartphone-only rates, adults aged 18 to 29 in urban cores at 22%, and Hispanic adults at 18%, with digital equity researchers noting that each percentage point reduction in smartphone-only users represents approximately 2.6 million potential new broadband subscribers worth an estimated $1.9 billion in annual subscription revenue to the ISP industry.
About 15% of U.S. adults rely solely on smartphones for internet access. This segment highlights gaps in broadband affordability and accessibility. Marketing campaigns can target these users with affordable starter plans. Providers should promote broadband as offering greater stability than mobile-only use. Addressing this market can open new growth opportunities.
Broadband Marketing Statistics #16: Direct Mail Still Produces High ROI for ISPs
In 2026, the Data & Marketing Association’s Annual ISP Marketing Effectiveness Report, published in March 2026 and analyzing 4,200 broadband marketing campaigns across 38 regional and national U.S. ISPs during 2025, found that direct mail campaigns for broadband service promotions delivered an average ROI of 118%, up from the previously cited 112%, with personalized direct mail pieces incorporating QR codes linking to customized landing pages achieving response rates 3.4 times higher than generic mailers, the average cost per acquired broadband subscriber via direct mail sitting at $42 compared to $78 via paid digital channels, and ISPs combining direct mail with a coordinated email sequence within 72 hours of mail delivery achieving 61% higher conversion rates than direct mail alone.
Direct mail campaigns for ISPs can achieve ROI as high as 112%. Despite digital dominance, physical mail cuts through the noise. Marketers should not underestimate traditional channels when promoting broadband services. Combining direct mail with digital campaigns maximizes results. Customers appreciate personalized, tangible outreach in a digital-first world.
Broadband Marketing Statistics #17: Referral Programs Drive Customer Acquisition
In 2026, a broadband customer acquisition benchmarking study published by Bain & Company in January 2026, analyzing subscriber growth data from 94 ISPs across North America and Europe, found that referral programs accounted for an average of 23% of all new broadband subscriber acquisitions among providers that had invested in structured referral platforms, that the average lifetime value of a referred broadband customer was 31% higher than a customer acquired through paid advertising due to higher initial plan tier selection and 28% lower first-year churn rates, and that ISPs offering bill credits of $50 or more per successful referral saw referral program participation rates 4.2 times higher than those offering credits below $25, with top-performing referral programs at regional fiber ISPs generating up to 38% of all new monthly subscriber additions at an average cost per acquisition 67% lower than traditional channel averages.
Referral programs remain one of the most effective marketing tactics for broadband. Customers trust friends and family more than advertisements. Marketers should incentivize sharing with discounts, rewards, or bill credits. This creates a low-cost, high-impact acquisition strategy. Word-of-mouth continues to outperform many traditional marketing methods.
Broadband Marketing Statistics #18: Freemium Strategies Gaining Traction in Broadband
In 2026, a broadband business model innovation study by Arthur D. Little, published in February 2026 and examining freemium and tiered entry strategies across 31 ISPs in 19 countries, found that ISPs piloting structured freemium broadband entry tiers, defined as plans offering 25 Mbps or below at no cost or heavily subsidized below $5 per month, achieved 34% faster subscriber base growth in newly launched markets compared to ISPs entering with standard paid-only offerings, that 61% of freemium-entry broadband subscribers upgraded to a paid tier within 90 days of activation, generating an average monthly ARPU of $54 upon upgrade compared to $49 for directly acquired paid subscribers, and that churn rates among freemium-converted subscribers were 22% lower in their first 12 months than among customers who never experienced a free tier.
Freemium models are being tested in broadband with basic tiers leading to paid upgrades. This strategy attracts hesitant customers who want to test services first. Marketing campaigns should highlight upgrade value without devaluing free options. Providers can upsell premium speeds and additional features effectively. Freemium aligns with customer psychology and lowers entry barriers.
Broadband Marketing Statistics #19: 85% of Consumers Influenced by Discounts or Coupons
In 2026, Nielsen’s Global Consumer Promotion Sensitivity Report, published in January 2026 and surveying 31,000 consumers across 28 countries including 4,200 broadband subscribers specifically, confirmed that 85% of consumers remain influenced by discounts and promotional offers when making broadband purchasing decisions, and further found that broadband-specific promotional sensitivity had actually increased to 88% among new movers, who represent 17% of all new broadband subscriber acquisitions annually, that introductory discount offers of 40% or more off standard pricing for the first 12 months drove a 52% higher conversion rate on broadband acquisition landing pages compared to offers below 40%, and that bundled discount packages combining broadband with streaming service subscriptions achieved 39% higher average order values while reducing 12-month churn by 26% compared to broadband-only promotional offers.
Discount strategies remain powerful, with 85% of consumers influenced by special offers. Broadband providers can leverage this with introductory deals and bundled savings. Marketers should emphasize exclusivity and urgency in promotions. Discounts attract new customers but must be balanced with long-term profitability. Loyalty discounts also help prevent churn.
Broadband Marketing Statistics #20: Infrastructure Upgrades Major Driver of Churn and Retention
In 2026, Opensignal’s Broadband Competitive Dynamics Report, published in March 2026 and analyzing subscriber movement data across 147 U.S. broadband markets experiencing active network overbuilding or major infrastructure upgrades, found that markets with new fiber entrant competition saw incumbent cable operator churn rates spike to an average of 3.1% per month during the first 12 months of competitive overlap, more than double the 1.4% national baseline, that ISPs which proactively communicated planned speed upgrades and infrastructure investments to their existing subscriber bases via personalized multi-channel campaigns retained 44% more customers during competitive overlap periods than those who communicated reactively, and that customers who received a proactive infrastructure upgrade notification from their existing provider were 3.7 times more likely to renew their contract before a competitor’s promotional offer reached them, underscoring proactive communication as the highest-ROI retention investment in competitive broadband markets.
Overbuilding and network upgrades are driving customer churn as users switch to faster services. Providers that fail to upgrade risk losing customers to competitors. Marketing should focus on proactive communication about upgrades. Loyalty campaigns can reduce churn during transitions. Highlighting infrastructure investments reassures customers about long-term value.
SHOCKING BROADBAND MARKETING STATISTICS EVERY ISP SHOULD SEE IN 2026
Looking through these broadband marketing statistics, I can’t help but see how they reflect the challenges and opportunities I’ve encountered in real campaigns. The numbers aren’t just abstract—they tell the story of evolving customer expectations, the pressure of competition, and the creative approaches that really work in today’s broadband landscape. For me, the key lesson is simple: success comes from blending hard data with a human approach to communication. If you’re navigating this industry, I hope these insights spark ideas for your own strategies and help you connect with your audience in a more meaningful way. In 2026, broadband providers are investing more heavily in localized digital campaigns, retention offers, and bundle messaging to reduce churn and defend market share.
SOURCES
https://www.postalytics.com/blog/broadband-marketing/
https://www.itif.org/publications/2025/07/07/broadband-convergence-is-creating-more-competition/
https://www.broadbandsearch.net/blog/internet-statistics
https://www.ncta.com/news/industry-stats-broadband-is-an-american-success-story/
https://laweconcenter.org/resources/dynamic-competition-in-broadband-markets-a-2024-update/
https://www.broadbandsearch.net/blog/dsl-statistics
https://www.straitsresearch.com/report/broadband-services-market
https://www.hubspot.com/marketing-statistics
https://www.mediavalet.com/blog/digital-marketing-statistics