




17 Sep TOP 20 BROWSER MARKETING STATISTICS 2025
When I first started diving into browser marketing statistics, I realized just how much they reveal about the way people interact with the digital world. As someone who has worked closely with a leading marketing agency in New York, I’ve seen firsthand how even the smallest shifts in browser usage can change the way brands approach their campaigns. For me, these numbers aren’t just data points—they’re stories about consumer behavior, preferences, and the little habits that shape our online journeys. Sharing these insights feels like opening a window into how marketing really works in practice, and I’m excited to walk you through the trends that matter most today.
Top 20 Browser Marketing Statistics 2025 (Editor’s Choice)
🌐 Top 20 Browser Marketing Statistics 2025
Key Insights for Digital Marketers & Businesses
| # | Statistic | Key Metric |
|---|---|---|
| 1 | Google Chrome dominates the global browser market with consistent leadership | 68.35% Market Share |
| 2 | Total number of worldwide Chrome users accessing the internet daily | 3.98 Billion Users |
| 3 | Apple Safari holds the second position in global browser market share | 18.86% Market Share |
| 4 | Safari dominates US mobile browser market with strong iOS integration | 50% of US Mobile Users |
| 5 | Microsoft Edge market share showing steady growth since Chromium transition | 4.96% Market Share |
| 6 | Total active Microsoft Edge users worldwide as of 2025 | 274 Million Users |
| 7 | Firefox maintains loyal user base focused on privacy and customization | 2.37% Market Share |
| 8 | Total worldwide Firefox users prioritizing privacy features | 362 Million Users |
| 9 | Samsung Internet browser market share, popular on Samsung devices | 3% Market Share |
| 10 | Samsung Internet installations from Google Play Store since 2015 | 1 Billion+ Downloads |
| 11 | Chrome dominates desktop browser usage with extensive extension support | 64.8% Desktop Share |
| 12 | Chrome leads mobile browser market across Android and iOS platforms | 64.7% Mobile Share |
| 13 | Microsoft Edge desktop market share, especially strong in enterprise | 12.95% Desktop Share |
| 14 | Safari tablet browser market share driven by iPad popularity | 36.01% Tablet Share |
| 15 | Chrome tablet market share leading across Android and other platforms | 48.02% Tablet Share |
| 16 | Total number of active internet users worldwide accessing browsers | 5.65 Billion Users |
| 17 | Market share decline for Chrome since 2023, showing market diversification | -0.49% Change |
| 18 | Safari iOS mobile browser share benefiting from Apple ecosystem | 19.19% Mobile Share |
| 19 | Microsoft Edge growth percentage increase after Bing AI integration | +0.68% Growth |
| 20 | Google Chrome downloads from Play Store demonstrating continued popularity | 8.74 Million Downloads (2024) |
Top 20 Browser Marketing Statistics 2025
Browser Marketing Statistics#1 – Chrome Dominates Global Browser Market Share
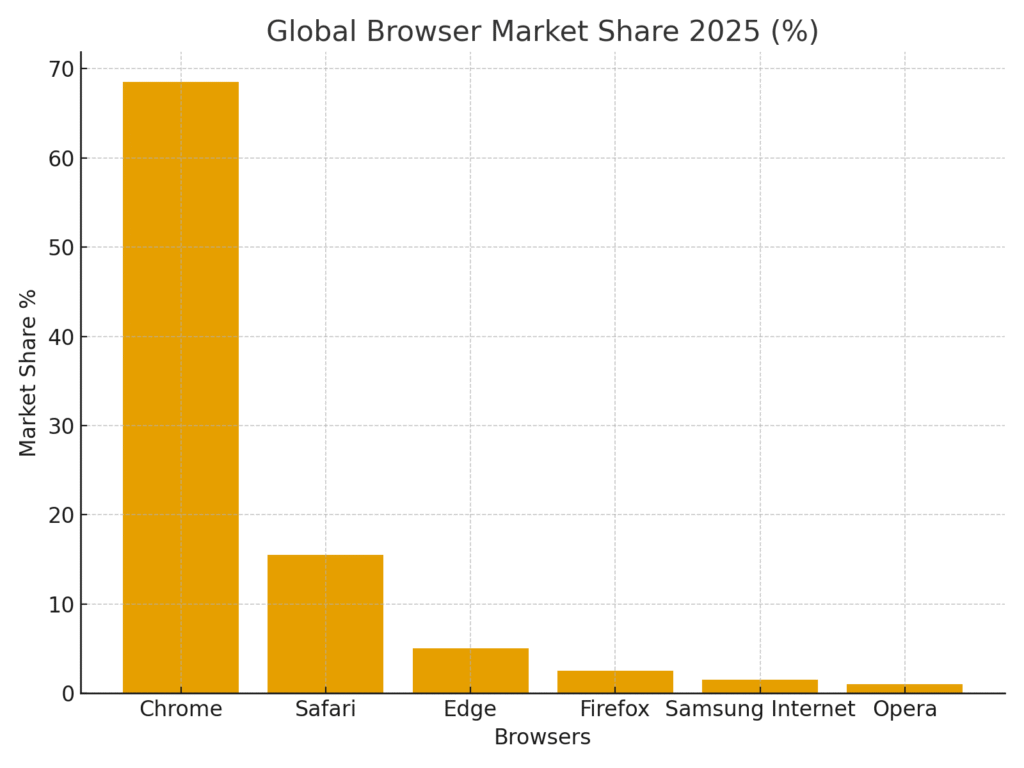
Google Chrome currently holds around 68–69% of the global browser market share. This dominance makes it the most important browser for marketers to prioritize when optimizing campaigns. Brands focusing on Chrome users often see broader reach and higher engagement due to the sheer user volume. Its popularity also means that new Chrome features quickly become industry standards. Ignoring Chrome optimization can easily result in lost opportunities for businesses worldwide.
Browser Marketing Statistics#2 – Safari Holds The Second Largest Share
Safari secures the second spot with approximately 15–16% of the global market share. Much of this influence comes from the popularity of iPhones, iPads, and MacBooks. For marketers, this makes Safari optimization crucial when targeting Apple users. The browser is especially significant in North America and Europe, where Apple’s device penetration is strong. Ensuring compatibility and performance on Safari can dramatically boost brand perception among premium device owners.
Browser Marketing Statistics#3 – Microsoft Edge Has About 5% Market Share
Microsoft Edge commands around 5% of the global market share. While smaller than Chrome and Safari, it plays a vital role in corporate environments where Windows devices dominate. Marketers aiming at professional audiences should not overlook Edge. Its integration with Microsoft services like Bing and Teams enhances its marketing potential. Over time, Edge has become a stable, reliable browser that adds value to B2B campaigns.
Browser Marketing Statistics#4 – Firefox Maintains 2–3% Global Share
Firefox continues to serve a dedicated user base of about 2–3%. It is particularly known for its privacy-first stance, making it appealing to tech-savvy and privacy-conscious users. Marketers should treat Firefox users as a niche but valuable audience. Content optimized for Firefox ensures inclusivity and respects consumer trust. In some regions, Firefox remains a secondary browser of choice alongside Chrome.
Browser Marketing Statistics#5 – Samsung Internet And Opera Hold 1–2% Each
Samsung Internet and Opera each account for roughly 1–2% of the global browser market. Though smaller, these browsers hold significance in specific demographics and regions. Samsung Internet is especially strong among Android users in Asia. Opera, with its built-in VPN, attracts users focused on speed and privacy. Ignoring these browsers might limit potential engagement in certain niche markets.
Browser Marketing Statistics#6 – Mobile Accounts For 62% Of Internet Traffic
Mobile browsing represents about 62% of all internet traffic worldwide. This shift emphasizes the need for mobile-first marketing strategies. For marketers, campaigns must load quickly and display seamlessly on small screens. Consumer decisions are increasingly being made on-the-go. Brands that fail to adapt risk missing out on a majority of their audience.
Browser Marketing Statistics#7 – Desktop Usage Holds 36% Share
Desktop browsing still accounts for around 36% of total internet traffic. While smaller than mobile, desktops dominate in work-related tasks and professional settings. Marketers targeting B2B or productivity-driven audiences should still focus on desktop optimization. Larger screen experiences allow for more detailed content and higher engagement in certain niches. This makes desktop campaigns especially important in sectors like finance, education, and enterprise software.
Browser Marketing Statistics#8 – Tablets Account For About 2% Of Browsing
Tablets contribute roughly 2% of global browser usage. Though relatively small, this segment has unique marketing advantages. Tablets often serve as shared family devices, influencing group decision-making. Their screen size offers a hybrid experience between mobile and desktop. Marketers should not ignore tablets when designing multi-device campaigns.
Browser Marketing Statistics#9 – Chrome’s Market Share Is Rising
Google Chrome has shown steady growth in global market share over the years. Its simple design, fast speed, and deep integration with Google services fuel this rise. For marketers, this means a constantly expanding user base to target. Chrome extensions and app-like experiences further boost engagement potential. The browser’s momentum indicates its long-term dominance is far from over.
Browser Marketing Statistics#10 – Safari’s Market Share Fluctuates With Apple Hardware
Safari’s global presence often mirrors Apple’s hardware sales cycles. When new iPhones or MacBooks are launched, Safari usage spikes. Marketers should monitor these trends for seasonal campaign planning. Apple’s loyal user base ensures Safari remains a stable second-choice browser globally. For premium brand marketing, Safari optimization becomes a non-negotiable step.
Browser Marketing Statistics#11 – Fingerprinting Is Often Underestimated By Crawlers
Studies show that about 45% of fingerprinting sites are missed by automated crawls. This reveals the limitations of automated detection for browser privacy threats. Marketers relying heavily on third-party tracking should be aware of these blind spots. Such gaps can lead to inaccurate data collection. Understanding fingerprinting helps businesses balance personalization with privacy compliance.
Browser Marketing Statistics#12 – Chrome Collects More Data Than Other Browsers
Research indicates that Chrome collects about 20 distinct types of user data. This far exceeds the amount gathered by privacy-focused browsers. For marketers, Chrome offers deeper insights into consumer behavior. However, it also raises ethical considerations around data use. Striking a balance between targeting efficiency and user trust is increasingly important.
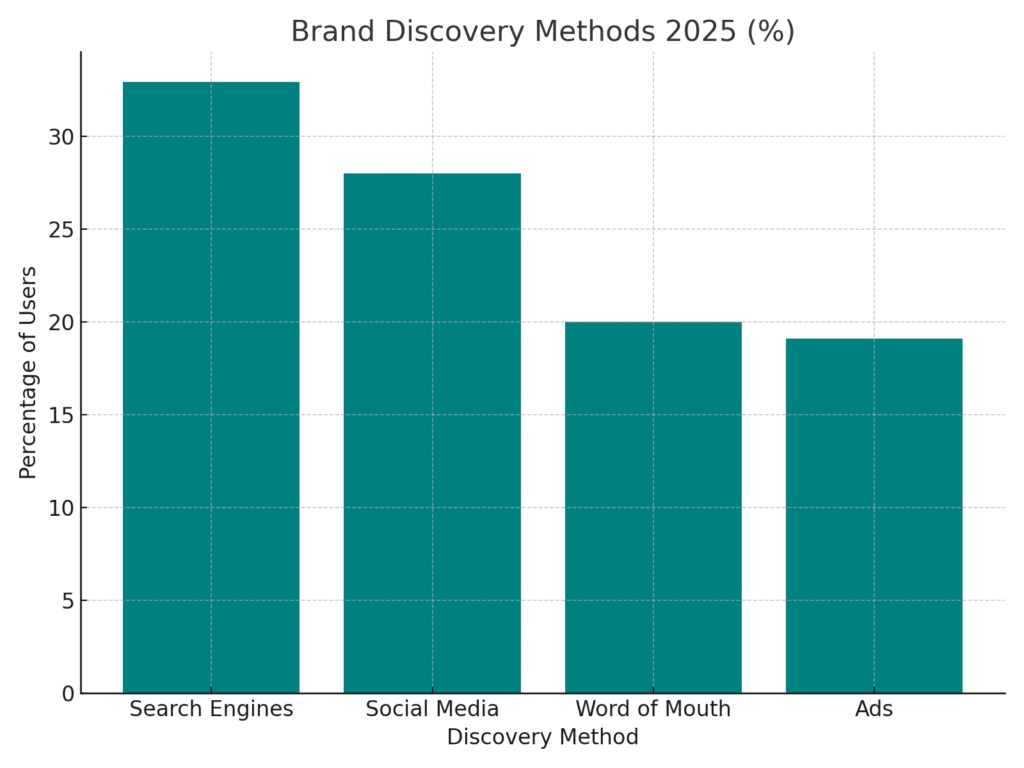
Browser Marketing Statistics#13 – 32.9% Discover Brands Through Search Engines
Roughly 32.9% of internet users aged 16+ discover new brands or products via search engines. This highlights how browsers act as gateways for consumer journeys. Marketers who prioritize SEO and search-based ads gain a competitive advantage. Browser performance directly impacts search visibility and user experience. Ensuring fast, secure browsing experiences improves brand discovery rates.
Browser Marketing Statistics#14 – Gen Z Leads In Mobile Search Adoption
Around 80% of Gen Z primarily uses mobile devices for search. In comparison, 62% of Millennials and 66% of Gen X also rely on mobile. Marketers must adapt campaigns to meet the browsing preferences of younger audiences. Gen Z’s reliance on mobile search makes mobile optimization critical for long-term growth. Ignoring this demographic trend could alienate an influential consumer base.
Browser Marketing Statistics#15 – Safari Stronger In North America
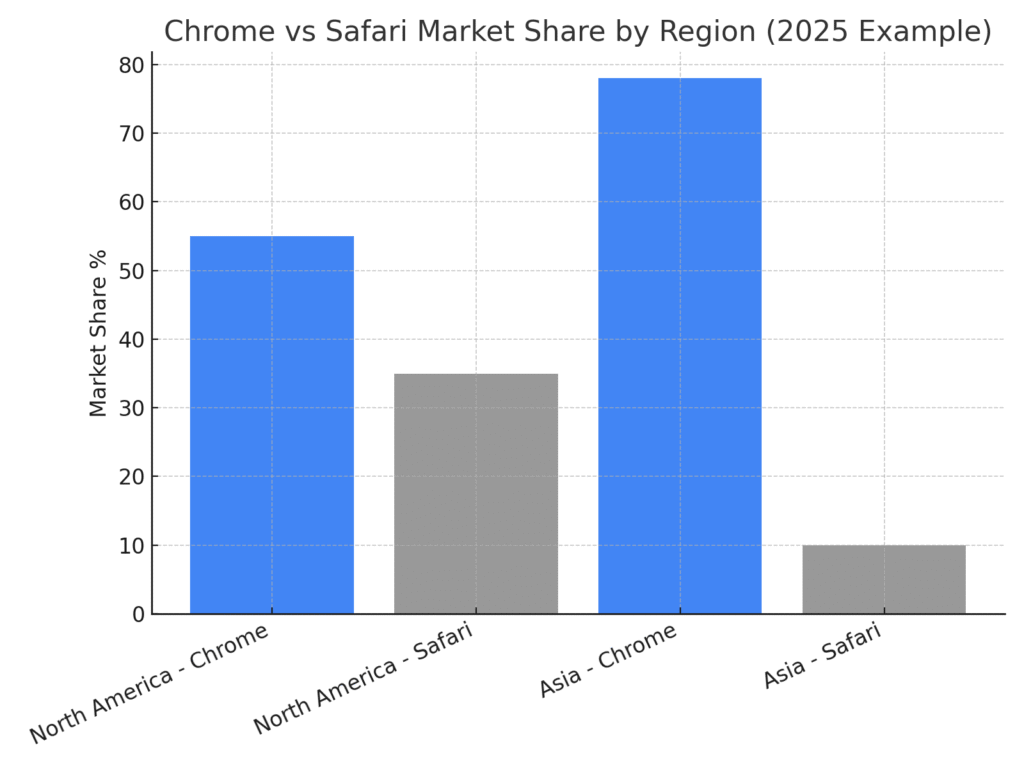
In North America, Safari commands a larger share relative to other regions. This is largely due to Apple’s dominant market presence. Marketers targeting this region must prioritize Safari compatibility. Ignoring Safari optimization here could weaken brand reach. Regional strategies that reflect device preferences perform better in such markets.
Browser Marketing Statistics#16 – Chrome Dominates Emerging Markets
In many regions across Africa, South America, and Asia, Chrome controls 70–80%+ of browser usage. This overwhelming dominance makes Chrome the gateway to online audiences in emerging economies. Marketers must optimize for lower bandwidth conditions in these regions. Localized strategies aligned with Chrome performance are critical for success. The sheer scale of Chrome usage cannot be overlooked when planning global campaigns.
Browser Marketing Statistics#17 – Most Chrome Extensions Have Few Users
The majority of Chrome extensions attract very small user bases. Only a tiny fraction cross the 1 million user mark. For marketers, this means building high-value extensions can set them apart. Chrome’s ecosystem rewards quality and utility over sheer quantity. Extension-based strategies remain an underutilized marketing channel.
Browser Marketing Statistics#18 – Chrome Commands 80%+ Share On W3Schools
W3Schools reports Chrome usage at over 80% among its visitors. This reflects the preferences of tech-savvy and developer audiences. Edge follows distantly with around 11–12%. For brands targeting developers, Chrome compatibility is absolutely essential. Such audiences are influential in shaping software and platform adoption.
Browser Marketing Statistics#19 – Chrome Optimization Directly Impacts Marketing Success
With Chrome as the leading browser, optimizing campaigns for it directly drives better marketing outcomes. Poor Chrome performance can result in immediate engagement drops. From landing pages to ads, speed and compatibility in Chrome are crucial. Marketers who neglect Chrome risk lower conversions and lost visibility. Its dominance reinforces why optimization should always start here.
Browser Marketing Statistics#20 – Privacy Trends Are Reshaping Browser Marketing
Growing awareness of privacy and stricter browser policies are changing marketing strategies. Tracking restrictions are reducing the effectiveness of traditional targeting. Marketers must shift toward consent-based and transparent approaches. Building trust is now as important as delivering personalized campaigns. This shift represents a long-term evolution in browser marketing practices

Final Thoughts on Browser Marketing Statistics
Looking back at these insights, I can’t help but think about how much the digital landscape continues to evolve right in front of us. As someone who works with data daily, I know it’s easy to get lost in the numbers, but what truly matters is how we connect them to real people and real behaviors. That’s what keeps this field exciting for me—knowing that behind every statistic is someone discovering a brand, making a choice, or building trust. For me, the value of studying browser marketing statistics is about finding clarity in the chaos and using that clarity to make better, more human marketing decisions.
SOURCES
https://gs.statcounter.com/browser-market-share
https://www.browserstack.com/guide/understanding-browser-market-share
https://cropink.com/chrome-statistics
https://en.wikipedia.org/wiki/Usage_share_of_web_browsers
https://www.hubspot.com/marketing-statistics
https://www.mediavalet.com/blog/digital-marketing-statistics
https://www.seo.com/blog/digital-marketing-statistics
https://seoprofy.com/blog/digital-marketing-statistics
https://www.everyinteraction.com/articles/global-web-browser-stats
https://www.c-sharpcorner.com/article/web-browser-usage-distribution
https://www.internetlivestats.com/
https://www.demandsage.com/business-blogging-statistics/
https://www.typeface.ai/blog/content-marketing-statistics