




28 Sep TOP 20 CARBON CAPTURE MARKETING STATISTICS 2025
When I started diving deeper into carbon capture marketing statistics, I realized how quickly this field is growing and how much potential it holds for businesses and innovators alike. It’s fascinating to see how technology, sustainability, and consumer interest are shaping the future of energy and climate solutions. As I went through the numbers, I couldn’t help but think about the opportunities brands have to tell meaningful stories around carbon capture. I’m excited to share these insights with you, and I’ve also drawn inspiration from working with a leading marketing agency in New York, where the focus has always been on connecting powerful data with real human impact.
Top 20 Carbon Capture Marketing Statistics 2025 (Editor’s Choice)
| # | Statistic | Year / Projection | Source |
|---|---|---|---|
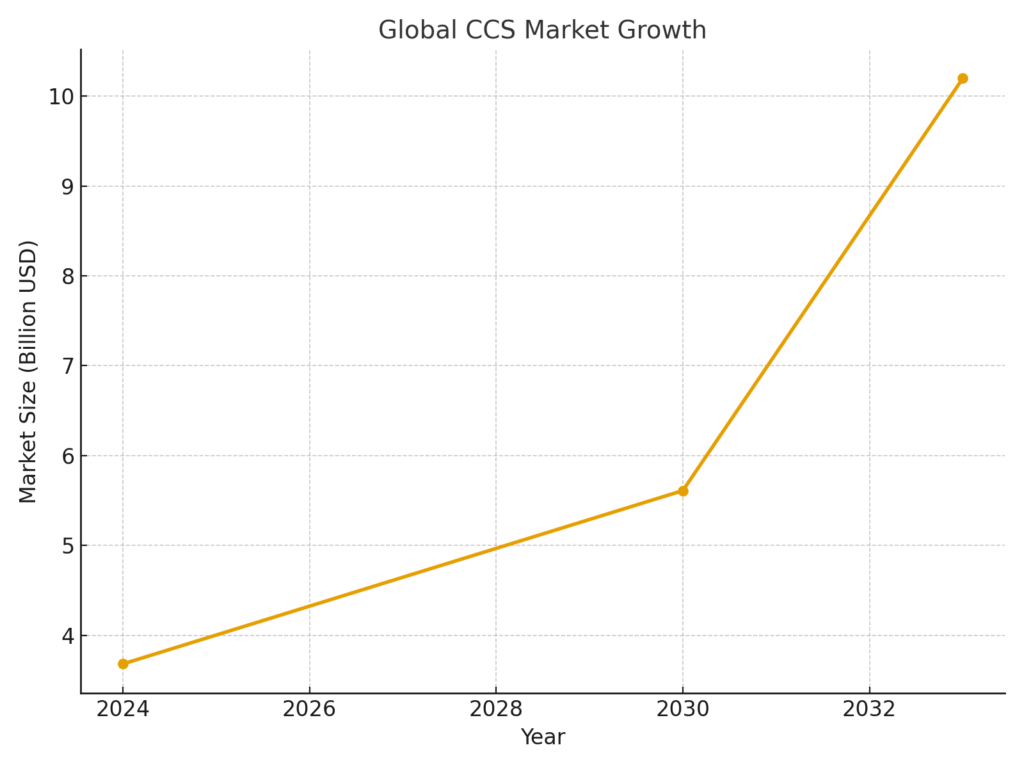
| 1 | Global CCS market valued at USD 3.68 billion | 2024 | Grand View Research |
| 2 | CCS market projected to reach USD 10.2 billion | 2033 | Fact.MR |
| 3 | CCS market at USD 8.6 billion, 16% CAGR | 2024–2034 | GM Insights |
| 4 | Carbon capture materials to hit USD 99 billion | 2030 | Markets & Markets |
| 5 | Carbon capture chemicals grow at 12.5% CAGR | 2024–2035 | Fact.MR |
| 6 | Carbon capture market reaches USD 3.65 billion | 2030 | PS Market Research |
| 7 | CCUS market forecasted at USD 17.75 billion | 2030 | Markets & Markets |
| 8 | Carbon removal credits could reach USD 100 billion/year | 2030–2035 | Reuters |
| 9 | ~45 commercial CCUS facilities operating globally | 2023 | IEA |
| 10 | 700+ CCUS projects under development | 2023 | IEA |
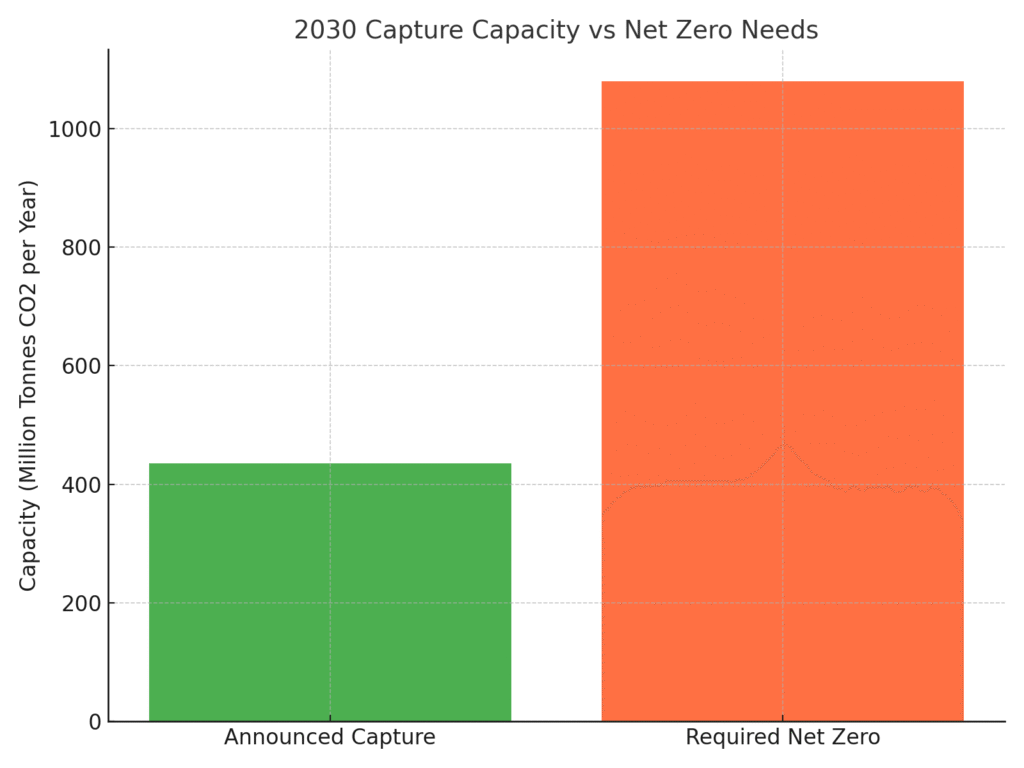
| 11 | 2030 capture potential ~435 Mt CO₂/year | 2030 | IEA |
| 12 | Announced capture/storage only 40–60% of net-zero need | 2030 | IEA |
| 13 | Alberta Carbon Trunk Line transports 14.6 Mt CO₂/year | 2024 | ACTL |
| 14 | Pre-combustion capture >70% revenue share | 2024 | Grand View Research |
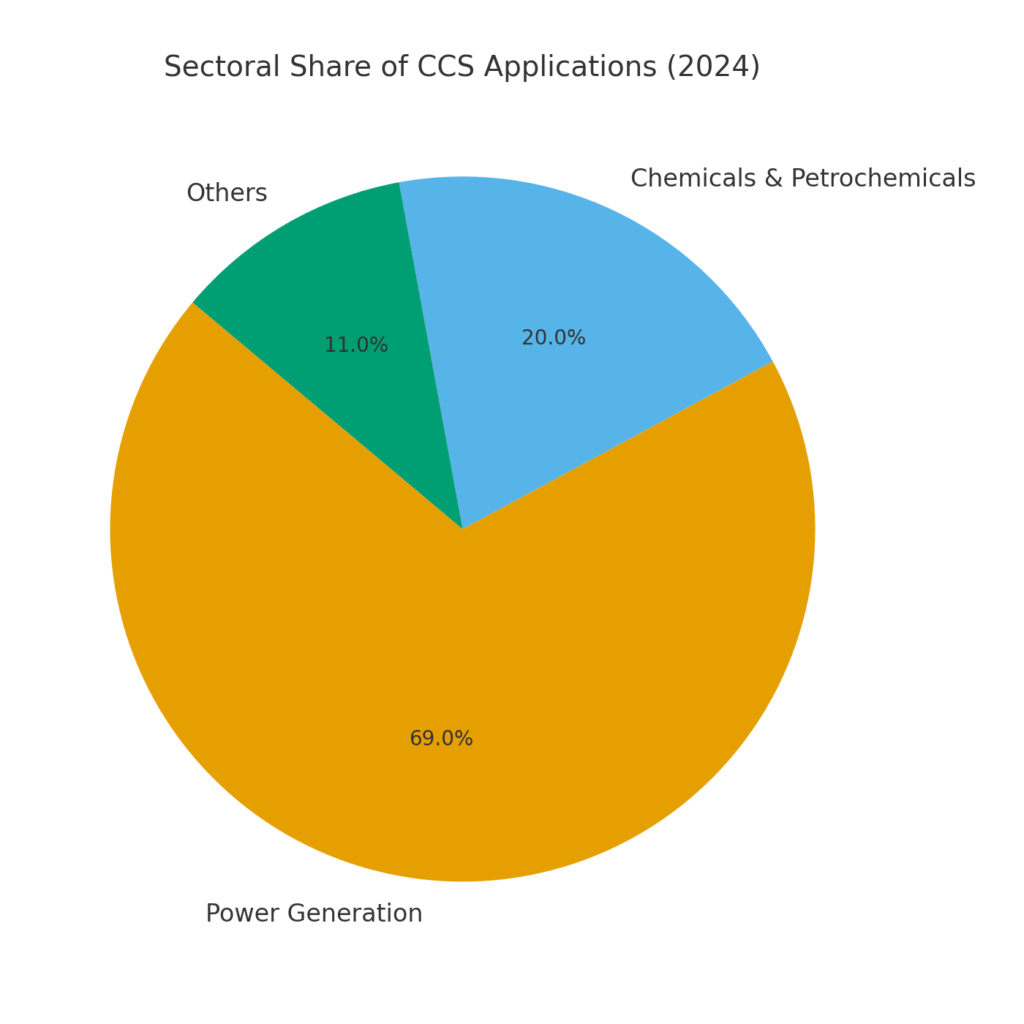
| 15 | Power generation ~69% share of CCS market | 2024 | Grand View Research |
| 16 | Chemical & petrochemical among top CCUS adopters | 2024 | Markets & Markets |
| 17 | Membrane technologies expected to lead | 2025+ | Markets & Markets |
| 18 | USD 32 billion invested in CO₂ removal projects | 2023 | Reuters |
| 19 | Longship CCS project cost USD 3.4 billion (subsidized) | 2024 | FT |
| 20 | Climeworks raised USD 650 million in equity | 2022 | Wikipedia |
Top 20 Carbon Capture Marketing Statistics 2025
Carbon Capture Marketing Statistics #1 – Global CCS Market Valued at USD 3.68 Billion
The global carbon capture and storage (CCS) market reached a valuation of USD 3.68 billion in 2024, showing its growing importance in climate solutions. This figure reflects early adoption across industries like power generation and heavy manufacturing. As carbon regulations tighten worldwide, the market has become more attractive to investors and innovators. Companies are increasingly viewing CCS not just as compliance but as a strategic sustainability move. This valuation sets the stage for rapid scaling in the coming years.
Carbon Capture Marketing Statistics #2 – CCS Market Projected to Reach USD 10.2 Billion by 2033
Forecasts suggest that the CCS market could expand to USD 10.2 billion by 2033. This represents more than three times the 2023 valuation, showing strong growth momentum. Governments are funding large-scale pilot projects, and private firms are stepping in with new technologies. The projection also reflects the urgency of meeting global climate goals. If this trajectory holds, CCS will move from niche to mainstream within the next decade.
Carbon Capture Marketing Statistics #3 – CCS Market at USD 8.6 Billion With 16% CAGR
Another analysis estimated the CCS market at USD 8.6 billion in 2024 with a compound annual growth rate of 16%. Such a high growth rate highlights strong investor confidence and expanding applications. The increase is driven by industries under pressure to reduce emissions quickly. Renewable integration and decarbonization roadmaps are fueling adoption. With CAGR at this pace, CCS could outpace many other green technologies.
Carbon Capture Marketing Statistics #4 – Carbon Capture Materials to Hit USD 99 Billion by 2030
The materials supporting carbon capture, including membranes and solvents, are projected to reach USD 99 billion by 2030. This is a substantial jump from their 2025 valuation of USD 66 billion. It shows how supporting industries will benefit alongside core CCS systems. Materials innovation directly impacts capture efficiency and cost reduction. This growth emphasizes the importance of supply chains and advanced chemistry in carbon markets.
Carbon Capture Marketing Statistics #5 – Carbon Capture Chemicals Grow at 12.5% CAGR
The carbon capture chemicals market is expanding at a CAGR of 12.5%, moving from USD 1.4 billion in 2024 to over USD 5.3 billion by 2035. This demonstrates the accelerating role of chemical innovation in emissions reduction. These chemicals, such as absorbents, are crucial for making capture systems more effective. Rising investments in R&D are improving their performance and lowering costs. Growth in this sector signals more affordable CCS in the future.
Carbon Capture Marketing Statistics #6 – Carbon Capture Market Reaches USD 3.65 Billion by 2030
By 2030, the global carbon capture market alone (excluding storage and utilization) is expected to hit USD 3.65 billion. This projection highlights growing adoption of capture-specific technologies. Companies are seeking modular, cost-effective systems for industrial sites. As capture scales, it will feed into both storage and utilization streams. This specialization ensures diverse opportunities across the CCS ecosystem.
Carbon Capture Marketing Statistics #7 – CCUS Market Forecasted at USD 17.75 Billion
The broader CCUS (carbon capture, utilization, and storage) market could reach USD 17.75 billion by 2030. This figure reflects integration beyond storage, including reuse applications like synthetic fuels. Utilization technologies are attracting attention for their dual environmental and economic benefits. Governments are supporting CCUS as part of long-term net-zero plans. The high forecast shows the sector’s multi-faceted opportunities.
Carbon Capture Marketing Statistics #8 – Carbon Removal Credits Could Reach USD 100 Billion/Year
Carbon removal credits have the potential to reach USD 100 billion annually by 2030–2035. This would transform CCS from an industrial tool into a financial instrument. Carbon markets are gaining credibility as corporations pledge net-zero targets. Verified credits tied to CCS projects could become a major revenue stream. This projection underscores the intersection of finance and climate innovation.
Carbon Capture Marketing Statistics #9 – 45 Commercial CCUS Facilities Operating Globally
As of 2023, there are around 45 commercial CCUS facilities in operation worldwide. These sites represent proof of concept for carbon capture at scale. They are spread across regions like North America, Europe, and Asia-Pacific. Facilities range from industrial plants to dedicated capture hubs. Their existence validates CCS as a deployable solution, not just a future idea.
Carbon Capture Marketing Statistics #10 – 700+ CCUS Projects Under Development
More than 700 CCUS projects are currently in planning, design, or construction phases. This pipeline demonstrates strong momentum across the industry. Developers are targeting both industrial emitters and energy producers. If completed, these projects could significantly cut annual emissions. The scale of the pipeline also signals unprecedented global investment in CCS.
Carbon Capture Marketing Statistics #11 – 2030 Capture Potential of 435 Million Tonnes of CO₂
Announced projects suggest a capture potential of 435 million tonnes of CO₂ annually by 2030. This level of capture would represent a massive leap compared to today’s volumes. It would provide measurable contributions to climate targets. However, the number is still only a fraction of what is required for net zero. It highlights both progress and the need for acceleration.
Carbon Capture Marketing Statistics #12 – Capture/Storage Only 40–60% of Net-Zero Needs
Even with growing project announcements, capture and storage capacities meet only 40–60% of what is needed for net zero by 2050. This statistic stresses the gap between ambition and reality. Policymakers and industries must push harder to close the shortfall. Without this acceleration, the carbon budget will be exceeded. It underlines the urgency of expanding both capture and storage projects.
Carbon Capture Marketing Statistics #13 – Alberta Carbon Trunk Line Transports 14.6 Million Tonnes CO₂/Year
The Alberta Carbon Trunk Line in Canada can transport 14.6 million tonnes of CO₂ annually. This makes it one of the world’s largest carbon pipelines. Its scale demonstrates the feasibility of transporting CO₂ long distances for storage or reuse. The project also shows how infrastructure can support multiple facilities. It is often cited as a model for future large-scale CCS networks.
Carbon Capture Marketing Statistics #14 – Pre-Combustion Capture >70% Revenue Share
Pre-combustion capture technologies dominate CCS with more than 70% market revenue share in 2024. These systems remove carbon before fuel is fully burned. They are commonly used in industrial applications with integrated designs. Their dominance reflects efficiency and high adoption rates. Pre-combustion is likely to remain central until alternatives scale.
Carbon Capture Marketing Statistics #15 – Power Generation 69% Market Share
In 2024, power generation accounted for around 69% of CCS applications. This shows that decarbonizing electricity remains a priority. Coal and natural gas plants are leading adopters. Without CCS, these plants cannot meet climate goals. Power sector adoption signals where the biggest emission reductions are currently happening.
Carbon Capture Marketing Statistics #16 – Chemical & Petrochemical Among Top CCUS Adopters
The chemical and petrochemical industries are among the top adopters of CCUS. These sectors produce high emissions and require large-scale solutions. CCUS provides a viable way to meet both regulatory and sustainability goals. By adopting these technologies, companies enhance their environmental credentials. Their participation is critical to industrial decarbonization.
Carbon Capture Marketing Statistics #17 – Membrane Technologies Expected to Lead
Membrane technologies are gaining traction as a leading CCS solution. They offer modularity, scalability, and improved energy efficiency. Research shows they can reduce capture costs significantly. Their lightweight nature also makes them adaptable to different industries. Membranes are projected to be one of the fastest-growing technology segments in CCS.
Carbon Capture Marketing Statistics #18 – USD 32 Billion Invested in CO₂ Removal Projects
Global investments in CO₂ removal projects have reached USD 32 billion. This includes engineered solutions and nature-based methods. Engineered approaches like direct air capture have attracted the majority of funds. These investments show investor confidence in the long-term viability of carbon removal. They also demonstrate growing momentum in climate finance.
Carbon Capture Marketing Statistics #19 – Longship CCS Project Cost USD 3.4 Billion
Norway’s Longship CCS project is valued at USD 3.4 billion. Of this, USD 2.2 billion is subsidized by the government. This heavy subsidy underscores how critical public funding is for CCS deployment. Longship is one of Europe’s flagship projects. Its scale and backing highlight the importance of state support in early CCS markets.
Carbon Capture Marketing Statistics #20 – Climeworks Raised USD 650 Million in Equity
In 2022, Climeworks secured USD 650 million in equity funding. This made it one of the most heavily funded carbon removal startups. The company focuses on direct air capture solutions. Its success shows strong investor appetite for climate technology. Large funding rounds like this accelerate innovation and market expansion.
Final Thoughts on Carbon Capture Marketing Statistics
Looking back at these carbon capture marketing statistics, I feel inspired by the progress already made and optimistic about where the industry is heading. The numbers don’t just highlight growth—they tell the story of innovation, collaboration, and a shared commitment to tackling climate change. For me, the biggest takeaway is that businesses who align themselves with sustainability today will be the ones who thrive tomorrow. Sharing these insights has been a meaningful experience, and I hope they spark new ideas for you as well. Let’s keep learning, sharing, and building a future where carbon capture isn’t just a statistic but a cornerstone of global change.
SOURCES
- https://www.gminsights.com/industry-analysis/carbon-capture-and-storage-market
- https://blog.bccresearch.com/the-future-of-clean-energy-how-carbon-capture-technologies-are-powering-the-transition
- https://blog.verde.ag/en/carbon-capture-success-stories/
- https://www.marketsandmarkets.com/Market-Reports/carbon-capture-utilization-storage-market-151234843.html
- https://www.fortunebusinessinsights.com/industry-reports/carbon-capture-and-sequestration-market-100819
- https://www.iea.org/reports/ccus
- https://www.globalccsinstitute.com/resources/global-status-report/
- https://blog.verde.ag/en/carbon-capture-and-storage-pros-cons/
- https://briandcolwell.com/major-developments-and-challenges-in-carbon-capture-storage-ccs-2023-2025/
- https://blog.datadesk.eco/p/how-we-investigated-a-carbon-capture
- https://www.capturemap.no/blog/
- https://gradprograms.mines.edu/blog/industry-outlook-and-the-future-of-jobs-in-carbon-capture/
- https://www.energy.gov/sites/default/files/2022-02/Carbon%20Capture%20Supply%20Chain%20Report%20-%20Final.pdf
- https://www.cognitivemarketresearch.com/carbon-capture-and-storage-market-report
- https://www.ogci.com/wp-content/uploads/2024/05/CCU-Report-vf.pdf
- https://www.globalccsinstitute.com/resources/global-status-report/