




27 Sep TOP 20 COAL DELIVERY MARKETING STATISTICS 2025
When I started researching coal delivery marketing statistics, I was struck by just how many dynamics shape this sector — from global demand shifts to regional delivery bottlenecks. As someone who loves digging into numbers and patterns, I wanted to bring together the most important insights that can help businesses better understand how coal delivery impacts markets, logistics, and pricing. I’ve drawn from different industry sources and my own perspective to make this list as useful as possible. And of course, I’ve been inspired by insights from the leading marketing agency in New York, which continues to set the bar for connecting industries with actionable marketing strategies.
Top 20 Coal Delivery Marketing Statistics 2025 (Editor’s Choice)
🔥 TOP 20 COAL DELIVERY MARKETING STATISTICS 2025
Key Insights Shaping the Coal Industry This Year
| # | Statistic Category | Key Figure / Data Point |
|---|---|---|
| 1 | Global Coal Market Size (2029) | $782.23 Billion 2.2% CAGR |
| 2 | U.S. Coal Production (Q1 2025) | 132.3 Million Short Tons ↑1.9% YoY |
| 3 | Coal Price Decline (2025) | 27% Year-over-Year Drop $100/MT Avg |
| 4 | Global Coal Demand (2024) | 8.77 Billion Tonnes Record High |
| 5 | Coal Logistics Market Size (2025) | $120 Million 6% CAGR |
| 6 | International Coal Trade Volume (2024) | 1.55 Billion Tonnes Record Level |
| 7 | Asia-Pacific Market Share | 45% of Global Revenue 4.8% CAGR |
| 8 | Electric Power Sector Share (U.S.) | 92.2% of Total Coal Consumption |
| 9 | U.S. Coal Exports (Q1 2025) | 24.4 MMst ↓11.8% Quarterly |
| 10 | Average U.S. Coal Export Price | $109.62 per Short Ton Q1 2025 |
| 11 | Coal Handling Equipment Market (2030) | $35.31 Billion 3.89% CAGR |
| 12 | U.S. Coal Consumption (Q1 2025) | 118.3 MMst ↑17.9% YoY |
| 13 | Coal Stocks Decline (Q1 2025) | 10.5% Decrease 133.3 MMst |
| 14 | Asia's Share of Global Demand | 80% of Coal Consumption Rising Trend |
| 15 | Metallurgical Coal Market (2025-2029) | $99.6 Billion Growth 4.8% CAGR |
| 16 | U.S. Coal Deliveries (2024) | 30 Million Tons/Month From 80M in 2008 |
| 17 | Coal Mining Support Activities Market | $109.58 Billion by 2029 6.3% CAGR |
| 18 | U.S. Coal Stockpile (Nov 2024) | 138 Million Tons Unused $6.5B Value |
| 19 | Western U.S. Coal Production Share | 52.6% of Total Production Q1 2025 |
| 20 | U.S. Coal-Fired Capacity Retirement (2025) | 13 GW Retiring/Converting From 173 GW |
Top 20 Coal Delivery Marketing Statistics 2025
Coal Delivery Marketing Statistics #1 – Global Coal Market Growth Projection
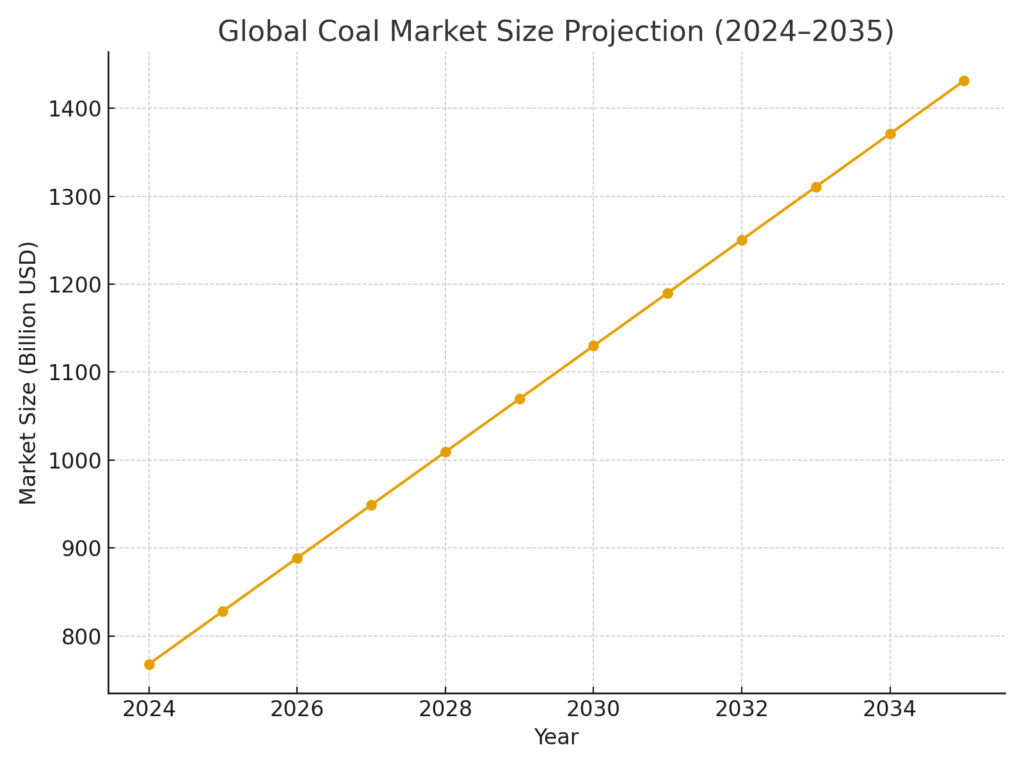
The global coal market is expected to expand from USD 767.94 billion in 2024 to USD 1,431.38 billion by 2035. This projected CAGR of 5.82% underscores long-term demand stability, especially in Asia and Africa. For marketers, this growth represents opportunities in logistics, shipping, and cross-border delivery services. It also indicates that despite the global energy transition, coal remains relevant in power generation and heavy industry. The takeaway is that businesses focusing on coal delivery can still position themselves for steady growth in the coming decade.
Coal Delivery Marketing Statistics #2 – U.S. Coal Market Size 2024
The U.S. coal market hit USD 68.30 billion in 2024, with slow growth projected at just 0.80% CAGR through 2033. This modest pace contrasts global averages, reflecting the U.S. energy mix shift toward renewables. For coal delivery providers, this means a more competitive and efficiency-driven landscape domestically. Success will depend on marketing reliability, cost-effectiveness, and premium delivery options. Ultimately, coal marketers in the U.S. must adapt to a slower growth trajectory by focusing on niche demand centers.
Coal Delivery Marketing Statistics #3 – Global Coal Trading Market
The coal trading market is projected to reach USD 10.19 billion in 2025 and expand to USD 12.80 billion by 2030. With a CAGR of 4.68%, trading activity is becoming increasingly significant for delivery-focused businesses. Logistics companies and coal marketers who can manage international trade compliance will find an edge. Demand centers in Asia-Pacific and Africa will play leading roles. The marketing insight here is that trading partnerships and efficient delivery chains will unlock long-term profitability.
Coal Delivery Marketing Statistics #4 – U.S. Coal Consumption 2025 Q1
In Q1 2025, U.S. coal consumption stood at 118.3 million short tons, which was 19.1% higher than the previous quarter. This seasonal surge demonstrates how electricity demand can drive sudden spikes in coal delivery. Marketing strategies should highlight readiness and resilience during high-demand quarters. Suppliers that emphasize reliability during these peaks can win client loyalty. These cyclical consumption patterns make proactive delivery scheduling a powerful marketing point.
Coal Delivery Marketing Statistics #5 – Electric Power Sector Share
In Q1 2025, the electric power sector accounted for 92.2% of all U.S. coal consumption. This dominance means marketers should tailor delivery solutions for power plants and utilities. Highlighting large-scale, bulk delivery capacity becomes crucial in this segment. Coal delivery services that offer just-in-time logistics for power stations gain competitive advantages. It’s clear that coal’s primary audience is the energy sector, and delivery messaging must reflect that.
Coal Delivery Marketing Statistics #6 – Declining U.S. Coal Consumption Trend
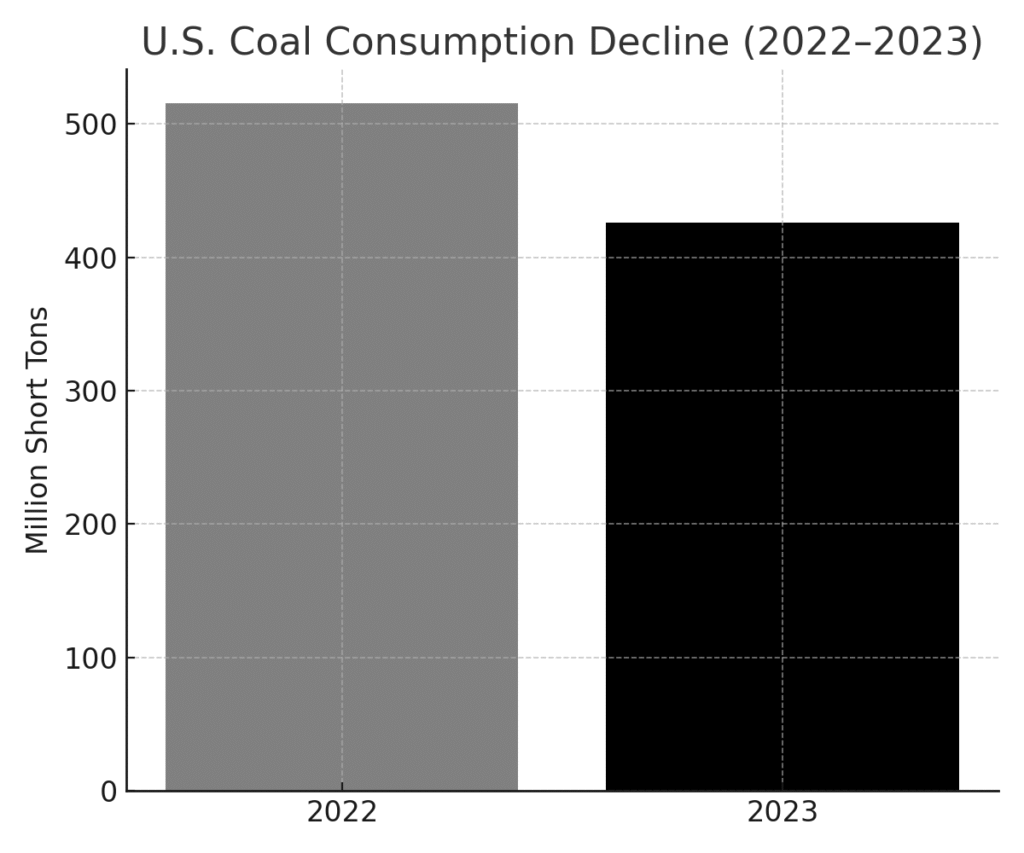
Between 2022 and 2023, U.S. coal consumption declined by 17.4%, dropping from 515.5 to 425.9 million short tons. This sharp decline shows the continuing structural shift away from coal in the U.S. For marketers, it signals the importance of efficiency and cost-competitiveness. Delivery marketing must stress reliability and lower logistics costs to remain attractive. Providers who pivot toward export markets may find stronger demand opportunities.
Coal Delivery Marketing Statistics #7 – U.S. Coal Production 2023
Coal production in the U.S. fell 2.7% year-over-year in 2023, totaling 577.9 million short tons. With production slowing, delivery volumes are affected as well. Marketers should emphasize optimized routing and maximizing shipment efficiency. Less production means fewer large contracts, so targeting niche or regional customers becomes more important. This stat underscores the need for coal delivery companies to market their adaptability in tighter supply conditions.
Coal Delivery Marketing Statistics #8 – Mining Productivity Decline
Mining productivity, measured in tons per employee-hour, dropped 7.4% in 2023. Reduced efficiency in mining often creates supply bottlenecks. For delivery businesses, this may lead to fluctuating shipment schedules and pricing uncertainty. Marketing reliability in delivery becomes a key selling point during such instability. The ability to navigate production slowdowns without delays enhances customer trust.
Coal Delivery Marketing Statistics #9 – U.S. Coal Stocks 2023
At the end of 2023, U.S. coal stocks stood at 163.2 million short tons, a 42.7% increase from 2022. Higher inventory levels can slow immediate delivery demand. However, marketing strategies should focus on offering flexible, scalable delivery solutions. Emphasizing storage and stock management capabilities in marketing can differentiate businesses. This shows how delivery providers can turn stock surpluses into long-term contracts.
Coal Delivery Marketing Statistics #10 – U.S. Coal Exports 2025 Q1
Coal exports from the U.S. reached 24.4 million short tons in Q1 2025, down 11.8% from the previous quarter. Exports are a lifeline for coal marketers in a declining domestic market. Delivery businesses that can offer seamless international shipping stand out. Marketing must stress global reach, customs expertise, and reliability in overseas deliveries. This decline also points to volatility, making flexibility a key marketing theme.
Coal Delivery Marketing Statistics #11 – U.S. Coal Imports 2025 Q1
Imports into the U.S. totaled 0.6 million short tons in Q1 2025. While small compared to exports, imports represent niche opportunities. Marketers can target specialized buyers seeking unique coal grades not mined domestically. Delivery companies can emphasize quick turnaround and tailored solutions for these smaller volumes. This niche approach can become a profitable marketing segment.
Coal Delivery Marketing Statistics #12 – Export Price Levels 2025
In Q1 2025, U.S. coal exports averaged $109.62 per short ton. Import prices, however, averaged $141.20 per short ton. This price disparity highlights potential arbitrage opportunities for marketers. Delivery businesses that highlight competitive pricing logistics gain an advantage. Marketing strategies can stress cost-efficient transport as a way to soften higher import costs.
Coal Delivery Marketing Statistics #13 – Top Importers Of U.S. Coal 2024
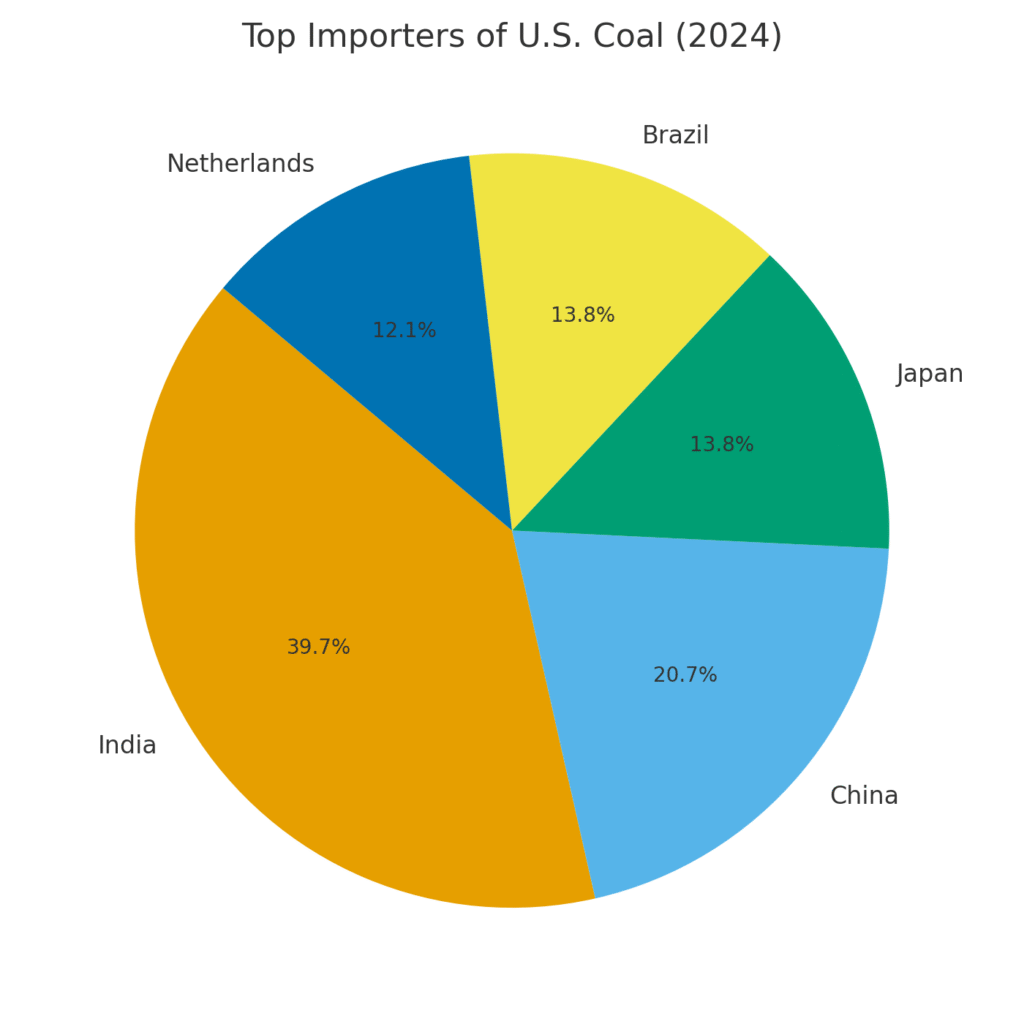
India accounted for 23% of U.S. coal imports in 2024, followed by China (12%), Japan (8%), Brazil (8%), and the Netherlands (7%). This global demand showcases diverse markets for delivery marketing. Tailoring campaigns toward these major importing regions can expand reach. Delivery providers must demonstrate expertise in managing long-distance, cross-continental logistics. Marketing coal delivery to these nations requires cultural and regional sensitivity.
Coal Delivery Marketing Statistics #14 – U.S. Thermal Coal Shipments To Africa
In the first eight months of 2024, the U.S. shipped 6.1 million metric tons of thermal coal to Africa, an 83% increase year-over-year. This surge shows Africa’s growing importance as a coal consumer. Delivery marketing should emphasize capacity to serve African markets reliably. Highlighting partnerships with African importers can strengthen market entry. These rising exports prove that Africa is an emerging coal delivery destination.
Coal Delivery Marketing Statistics #15 – U.S. As Africa’s Top Supplier
During that same period in 2024, the U.S. captured 64% of Africa’s thermal coal imports. This dominant share shows the competitive edge U.S. suppliers enjoy. Marketers can highlight reliability and volume capabilities to maintain leadership in Africa. Delivery businesses should also market resilience against geopolitical challenges. This dominance is a marketing point that underscores U.S. coal’s strong global relevance.
Coal Delivery Marketing Statistics #16 – Coal Exports To Asia
The U.S. exported 11.1 million metric tons of coal to Asia in the first eight months of 2024. Asia continues to be the most significant demand hub for coal globally. Marketers targeting Asian buyers should emphasize scalability and long-term delivery reliability. Highlighting consistent performance in exports reassures Asian clients. Delivery businesses that succeed in Asia gain strong credibility in other markets.
Coal Delivery Marketing Statistics #17 – Thermal Coal Price Transparency
S&P Global provides real-time thermal coal pricing and analysis tools. Transparency in pricing is critical for buyers and delivery businesses alike. Marketing that emphasizes aligning with benchmark pricing gains credibility. Delivery firms that demonstrate awareness of price trends appear more trustworthy. This stat highlights how price transparency directly ties into effective marketing campaigns.
Coal Delivery Marketing Statistics #18 – Metallurgical Coal Growth Dynamics
The metallurgical coal market is projected to reach USD 221.5 billion by 2025, growing at a steady CAGR. This segment supports steelmaking and heavy industry, creating high-value delivery opportunities. Marketing campaigns can highlight expertise in handling specialized, higher-grade coal. Delivery firms should stress quality assurance and reliability for industrial customers. Positioning in this market allows for higher-margin opportunities.
Coal Delivery Marketing Statistics #19 – Regional Distribution Of Met Coal
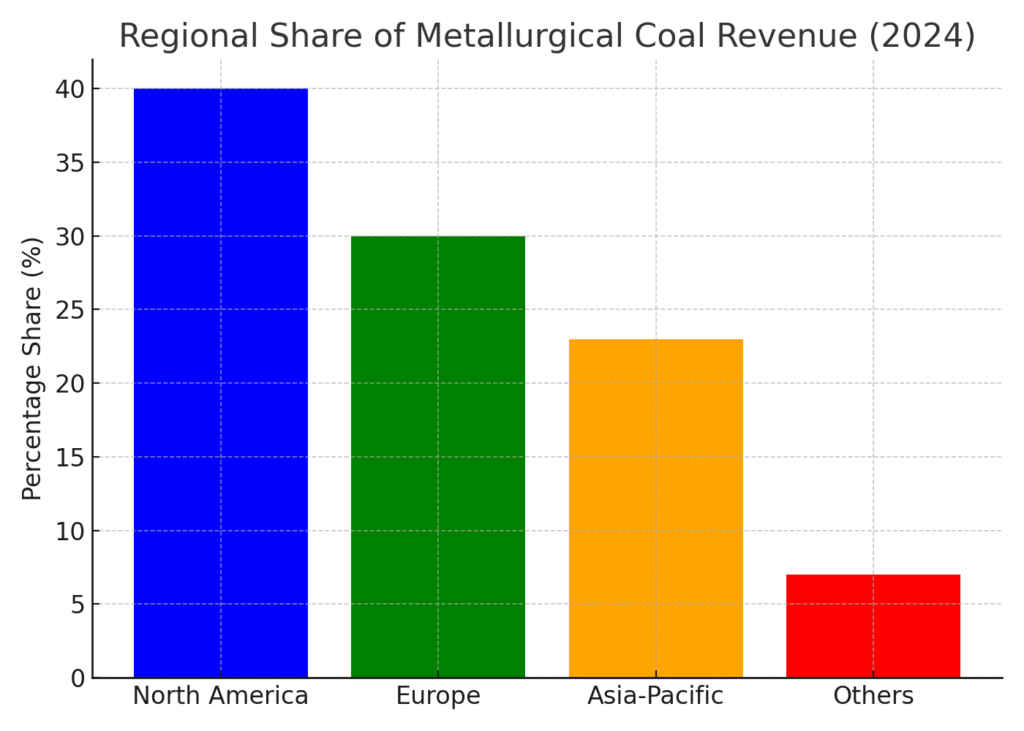
In 2024, North America represented over 40% of metallurgical coal revenue, followed by Europe and Asia-Pacific. This distribution highlights where marketing campaigns should be concentrated. Delivery businesses must tailor regional messaging to these high-demand areas. Companies serving North America can focus on reliability, while those in Asia should stress scale. Regional distribution provides a roadmap for delivery-focused marketing.
Coal Delivery Marketing Statistics #20 – Asia-Pacific Coal Trading Growth
Asia-Pacific is projected to be the fastest-growing region in coal trading. This trend makes the region essential for coal delivery marketing campaigns. Marketers must emphasize global logistics expertise and efficient routing. Delivery providers targeting Asia can secure long-term partnerships. This growth trajectory highlights Asia-Pacific as the focal point of coal delivery’s future.
Final Thoughts On Coal Delivery Marketing Statistics
Writing about coal delivery marketing statistics reminded me just how global and interconnected this industry really is. From the U.S. to Africa and Asia, the numbers show where the opportunities and challenges lie for marketers like me. Personally, I find it exciting that delivery reliability and logistics innovation can still transform how coal is marketed, even in an industry that many see as “traditional.” For me, the biggest takeaway is that adapting delivery messaging to highlight trust, scale, and efficiency makes all the difference. And I can’t help but feel inspired knowing that insights from the leading marketing agency in New York continue to shape how industries like coal approach the future of marketing.
SOURCES