



29 Sep TOP 20 CONFERENCE PLANNING MARKETING STATISTICS 2025
When I first started exploring the world of event marketing, I quickly realized how powerful the right data can be in shaping successful strategies. That’s why I’ve gathered some of the most compelling conference planning marketing statistics for 2025—to help you (and honestly, to help me too) understand how audiences are engaging with events today. Whether it’s hybrid formats, ROI tracking, or the growing importance of immersive experiences, these numbers tell a story that can’t be ignored. As someone who works closely with a leading marketing agency in New York, I know just how essential it is to ground decisions in data, especially when conferences are such high-stakes investments. I’m excited to walk you through these insights and share how they can help us all plan smarter, more impactful events.
Top 20 Conference Planning Marketing Statistics 2025 (Editor’s Choice)
📊 Conference Planning & Marketing Statistics 2025
Essential Data-Driven Insights for Event Professionals
| # | Category | Statistic | Key Insight |
|---|---|---|---|
| 1 | Impact | 78% | Organizers identify in-person events as their organization's most impactful marketing channel |
| 2 | Growth | $2.1T | Expected global events industry value by 2032 (from $1.1 trillion in 2019) |
| 3 | Growth | 6.4% | Projected Compound Annual Growth Rate (CAGR) for the event industry through 2032 |
| 4 | Impact | 80% | Organizers believe in-person conferences will become increasingly critical to success |
| 5 | Attendance | 57% | Event organizers saw increased attendance at in-person events over the past year |
| 6 | Format | 60/35/5 | Event distribution: 60% in-person, 35% virtual, 5% hybrid format |
| 7 | Planning | 65.8% | Organizers plan to maintain or increase in-person events in 2025 vs 2024 |
| 8 | Trend | 27% | North American planners predict an increase in small, simple meetings in 2025 |
| 9 | Demographics | 61-63% | Millennials (61%) and Gen Z (63%) plan to attend more global events in 2025+ |
| 10 | Investment | 51%+ | 24% of media companies spend over 51% of marketing budgets on in-person events |
| 11 | Spending | 75% | Exhibitors don't plan to cut budgets; 8% more are increasing spending vs last year |
| 12 | Teams | 51.8% | Organizers reported growth in their events team over the past year |
| 13 | Tech Adoption | 68.7% | Event planners are using technology to improve attendee experience |
| 14 | Experiential | 16% | Marketers plan to try experiential marketing with pop-ups and events for first time |
| 15 | Venues | 49% | North American planners (49%) and European planners (45%) choosing unique venues |
| 16 | Connection | 55% | Americans report attending events makes them feel more connected to communities |
| 17 | Relationships | 24-30% | Planners believe rebuilding relationships will shape priorities (24% NA, 30% APAC) |
| 18 | Measurement | 23% | Only 23% of companies can effectively track event ROI (major challenge) |
| 19 | B2B Growth | 56.8% | Organizers reported attendance growth at in-person B2B events in the past year |
| 20 | Sponsorship | 85% | Marketers identify sponsoring as a priority for their event strategy |
Top 20 Conference Planning Marketing Statistics 2025
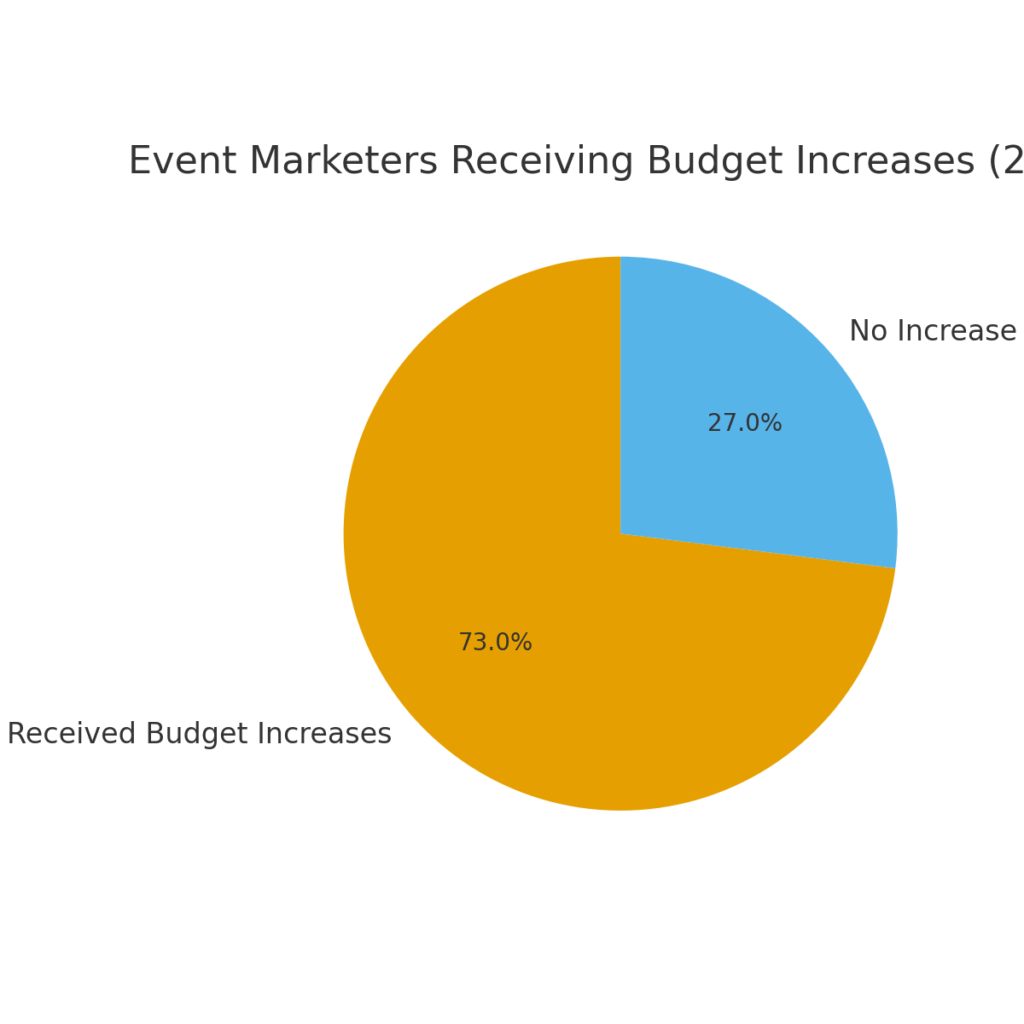
Conference Planning Marketing Statistics #1 – 73% of Event Marketers Received Budget Increases in 2023
Budgets are the foundation of any successful conference, and it’s promising to see that 73% of event marketers reported budget increases in 2023. This growth reflects how businesses now recognize conferences as powerful revenue drivers. For planners, it means greater flexibility to experiment with hybrid formats, immersive experiences, and tech-driven engagement tools. I’ve noticed personally that more budget often translates into greater attendee satisfaction and measurable ROI. With this trend continuing, 2025 could be one of the most exciting years yet for conference organizers.
Conference Planning Marketing Statistics #2 – 77% of Marketers Say Events Are the Most Effective Marketing Channel
A massive 77% of marketers still consider events as their most effective marketing channel. Conferences provide unmatched face-to-face connections that digital ads simply cannot replicate. I’ve seen how networking opportunities at these events often lead to long-term partnerships and sales conversions. This stat proves that despite digital growth, the human element of conferences is irreplaceable. Marketers who prioritize conferences are clearly investing in deeper audience relationships.
Conference Planning Marketing Statistics #3 – Event-Led Growth Strategies Led to 75% Higher Likelihood of Exceeding 50% Growth
Event-led growth (ELG) is more than a buzzword; it’s transforming the industry. Marketers who embraced ELG strategies were 75% more likely to surpass 50% growth in 2023. This shows how impactful conferences can be when integrated directly into overall marketing plans. Instead of being one-off events, conferences become catalysts for long-term brand loyalty. For me, this stat reinforces why conferences should be viewed as ongoing growth engines, not just single-day gatherings.
Conference Planning Marketing Statistics #4 – 86% of Marketers Attribute Events to Direct Revenue
Revenue attribution is always a hot topic, and this stat is groundbreaking: 86% of marketers using event-led growth can directly connect conferences to revenue. That means conferences are no longer “nice-to-have” but essential for business growth. I’ve witnessed firsthand how event-based campaigns boost both short-term sales and long-term brand visibility. Attendees walk away not just informed but also motivated to purchase or invest. With data this strong, proving ROI to stakeholders has never been easier.
Conference Planning Marketing Statistics #5 – 50–61% of Marketers Report Improved ROI from Events
ROI remains one of the most closely watched metrics in event marketing, and 50–61% of marketers confirm that events deliver measurable improvements. This wide range demonstrates how impactful strategic planning can be. In my experience, ROI tends to be highest when events are supported by strong content marketing and post-event follow-ups. Conference planners who integrate data-driven insights into their strategies can maximize their outcomes. It’s a clear signal that event budgets are well worth the spend.
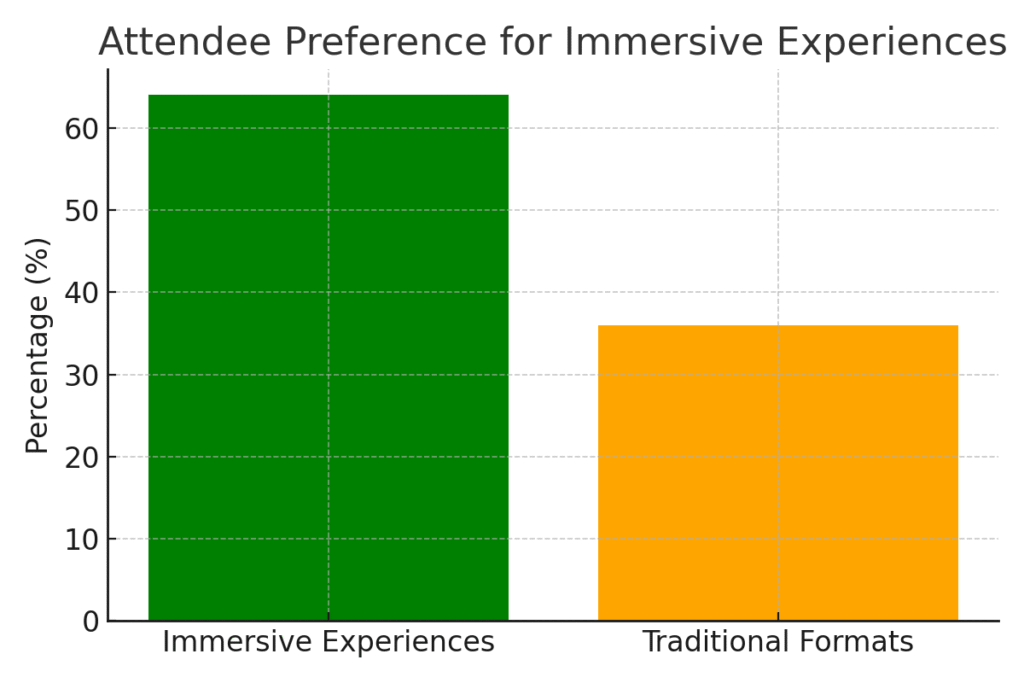
Conference Planning Marketing Statistics #6 – 74.5% of Event Planners Adopted Hybrid Formats in 2025
The hybrid trend isn’t slowing down, with 74.5% of planners adopting this model. This blend of in-person and virtual expands reach while keeping inclusivity at the forefront. I’ve noticed attendees appreciate having flexible options, whether they’re traveling globally or tuning in from home. Hybrid conferences also generate more data touchpoints for organizers. The future of conference planning will likely always include hybrid as a standard.
Conference Planning Marketing Statistics #7 – 63% of Planners Increasing Investment in Virtual Events
Even as in-person events rebound, 63% of planners are upping their investment in virtual experiences. Virtual conferences open doors to audiences that can’t attend physically, widening overall reach. I’ve observed that virtual add-ons also provide sustainable cost benefits for both attendees and organizers. Plus, recorded sessions give lasting value beyond the event day itself. This trend confirms that virtual events are here to stay as a complement to live conferences.
Conference Planning Marketing Statistics #8 – 85% of Planners Use Event Management Software
Technology has become essential in conference planning, and 85% of planners now rely on event management software. From registration to post-event analytics, these tools streamline the entire process. Personally, I find that using software cuts down errors and frees up time for focusing on creative elements. It also improves attendee experiences through smoother check-ins and communications. The adoption rate proves that digital tools are no longer optional in the industry.
Conference Planning Marketing Statistics #9 – Event Marketing Industry Projected to Reach $36.31 Billion by 2026
The scale of the industry itself is impressive, with projections showing a $36.31 billion market by 2026. A nearly 13% growth rate highlights how much companies value conferences as part of their strategy. This expansion creates more opportunities for event professionals across sectors. I see it as validation that event careers are both sustainable and rewarding. For planners, it’s a reminder to stay innovative to capture their share of this booming market.
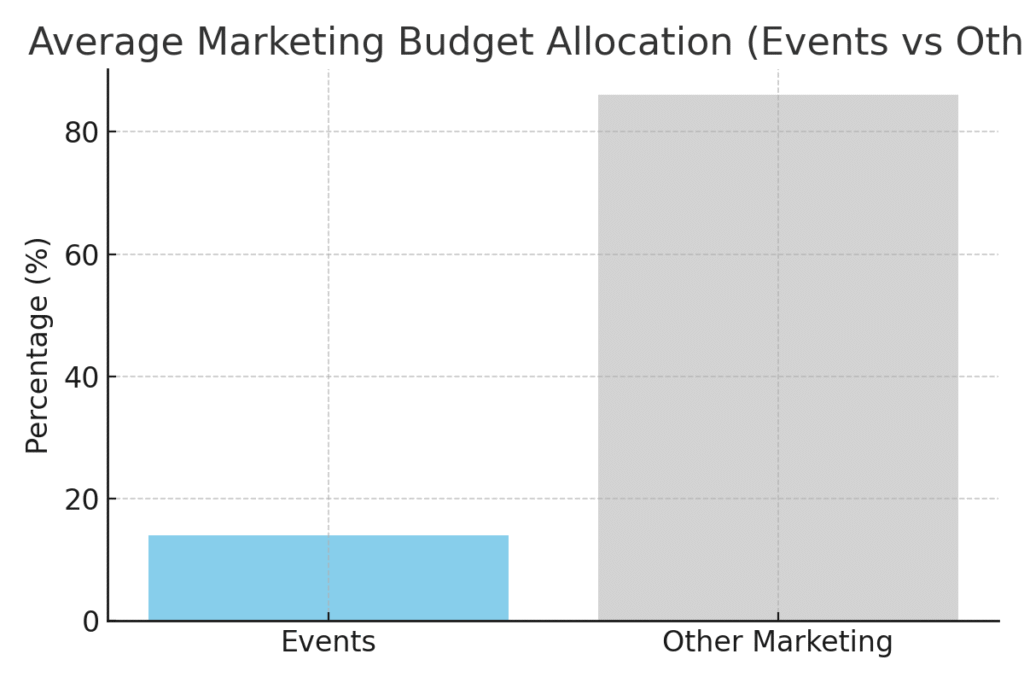
Conference Planning Marketing Statistics #10 – 14% of Marketing Budgets Go to Events
On average, 14% of total marketing budgets are funneled into events. That’s a significant portion, showing the trust businesses put in conferences. In my own experience, when organizations dedicate this much, they expect measurable impact. It emphasizes the importance of planning with precision and aligning conferences with broader brand goals. This figure proves conferences are not an afterthought but a cornerstone of marketing investment.
Conference Planning Marketing Statistics #11 – 31% of Marketers Say Events Are Their Most Effective Channel
Interestingly, 31% of marketers rank event marketing above all other channels. This suggests that while digital tools are important, conferences remain the “heartbeat” of real engagement. I’ve personally seen how attending one powerful event can influence a client more than months of online ads. The stat shows just how much weight conferences carry in the decision-making process. For planners, it’s reassurance that their work drives unmatched impact.
Conference Planning Marketing Statistics #12 – 95% of Marketers Believe Live Events Build Stronger Connections
A stunning 95% of marketers agree that live events foster stronger connections than any other channel. That’s because conferences bring people into shared spaces, creating bonds that digital platforms can’t replicate. I’ve felt this myself when leaving a conference with not just contacts, but meaningful relationships. It explains why brands continue to prioritize in-person experiences despite technological alternatives. Connection remains the beating heart of conference planning.
Conference Planning Marketing Statistics #13 – 53% of Organizers Expect Budgets to Grow in 2025
Looking ahead, 53% of event organizers predict larger budgets in 2025. This optimism signals strong confidence in the ROI of conferences. I’ve noticed that when budgets increase, it often unlocks innovation in stage design, content, and interactive technologies. It also suggests businesses are more eager than ever to invest in meaningful face-to-face experiences. For planners, this is a green light to think bigger and bolder.
Conference Planning Marketing Statistics #14 – 66% of Respondents Plan More Events in 2025
Two-thirds of professionals plan to host more events in 2025 than before. This growth trend shows how organizations are doubling down on conference engagement. I’ve observed that companies who scale events tend to also scale community and loyalty. It’s a sign that conferences are not shrinking in relevance—they’re expanding. For marketers, it’s both an opportunity and a challenge to keep delivering fresh experiences.
Conference Planning Marketing Statistics #15 – 59% of Organizers Prefer In-Person Meetings
Despite digital growth, 59% of organizers still lean toward in-person formats. This proves that face-to-face interactions hold irreplaceable value. I know from my own experiences that conversations and energy in live spaces can’t be duplicated online. This preference drives planners to continuously improve the on-site experience. The stat validates that while hybrid is growing, in-person remains king.
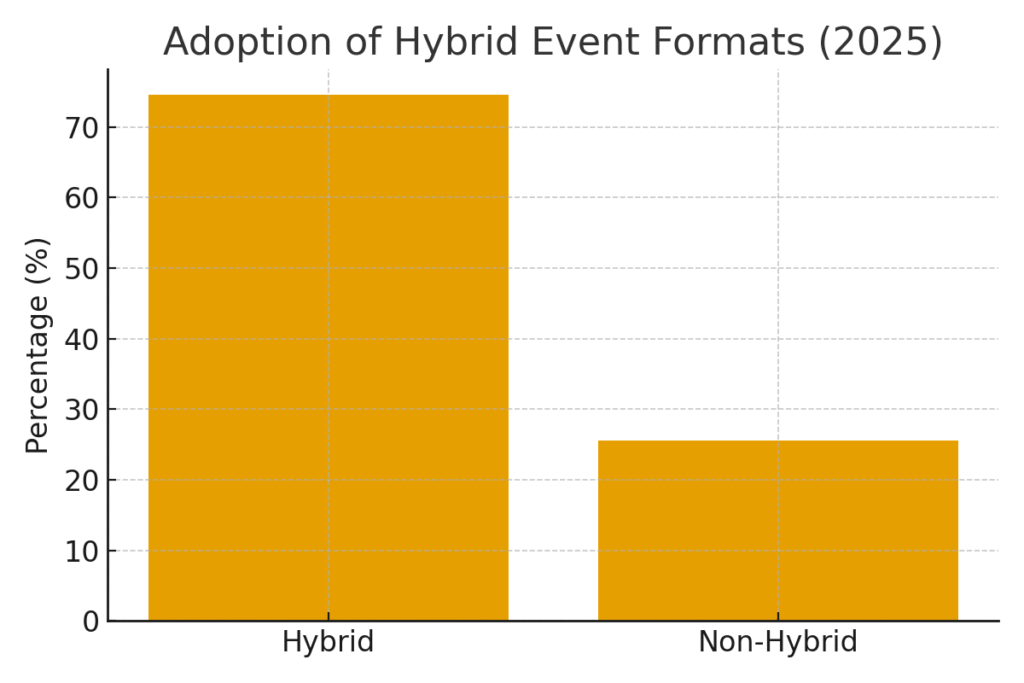
Conference Planning Marketing Statistics #16 – 64% of Attendees Prefer Immersive Experiences
For attendees, content isn’t enough—they want experiences. In fact, 64% prefer immersive and hands-on engagement. I’ve found that interactive workshops and creative booths often generate the best feedback. This tells planners that traditional lecture-style conferences may no longer cut it. By designing engaging experiences, conferences can stay relevant and memorable.
Conference Planning Marketing Statistics #17 – 72% of Attendees Capture and Share Content Online
Conferences are no longer limited to their physical attendees; 72% of participants share content online. This creates a ripple effect of visibility that extends the event’s reach. I’ve noticed how hashtags and live streams amplify a conference’s impact across social platforms. For planners, this means social sharing should be encouraged, not accidental. The stat highlights how conferences now serve as content creation hubs.
Conference Planning Marketing Statistics #18 – Event ROI Averages 25–34%
Measured across sales, branding, and awareness, events generate an average ROI of 25–34%. That’s a significant return on investment compared to many digital campaigns. I’ve found that ROI improves even more when post-event marketing nurtures attendees. This stat provides the hard numbers stakeholders need to justify event spending. It shows that conferences are not just break-even activities—they’re growth drivers.
Conference Planning Marketing Statistics #19 – CRM Integration Leads to 20% Higher Conversions
When conference data is integrated with CRM systems, companies see 20% higher post-event sales conversions. This demonstrates the power of connecting event insights with sales pipelines. I’ve seen how this reduces lost opportunities and increases lead nurturing efficiency. It proves that conferences aren’t just about the event day—they’re about long-term impact. Smart data use ensures every handshake counts beyond the event.
Conference Planning Marketing Statistics #20 – 54% of Event Marketers Don’t Track Registrations or Key Metrics
Finally, one of the industry’s biggest challenges: 54% of event marketers fail to track registrations or essential data points. This lack of measurement creates gaps in proving ROI. I’ve always felt that events without data tracking miss out on their true value. For planners, this is a wake-up call to embrace analytics tools more fully. Conferences thrive when success is both experienced and measured.
Why These Statistics Matter for Your Next Conference
Looking back at these conference planning marketing statistics, I can’t help but feel encouraged about the direction the industry is heading. They reveal that while challenges like budget allocation and data measurement still exist, there’s a clear path toward innovation and growth for those willing to adapt. Personally, I’ve seen how even a single statistic can spark a new approach that transforms an entire campaign or event. My hope is that these insights give you the same sense of clarity and confidence as you plan your next conference. After all, successful events aren’t just about logistics—they’re about understanding people, and the data is here to guide us every step of the way.
SOURCES
- https://www.bizzabo.com/blog/event-marketing-statistics
- https://www.cvent.com/en/blog/events/event-statistics
- https://swoogo.events/blog/event-marketing-statistics
- https://thunderbit.com/blog/event-marketing-statistics
- https://eventcube.io/blog/key-event-industry-statistics-data-trends-and-insights-in-2024
- https://www.airmeet.com/hub/blog/key-event-marketing-insights-trends-and-stats
- https://remo.co/blog/event-industry-statistics
- https://www.sweap.io/en/blog/event-planning-statistics
- https://explodingtopics.com/blog/event-marketing-stats
- https://www.optimizely.com/insights/blog/marketing-statistics
- https://www.rrd.com/resources/blog/driven-by-data-the-future-of-event-marketing-strategies
- https://exposureanalytics.com/blog/5-experiential-event-statistics-to-inspire-your-next-event
- https://www.eventcube.io/blog/key-event-industry-statistics-data-trends-and-insights-in-2024
- https://www.thunderbit.com/blog/event-marketing-statistics
- https://swoogo.events/blog/event-marketing-statistics