



22 Sep TOP 20 CYBER MONDAY MARKETING STATISTICS 2025
When I look at the surge of online shopping every holiday season, one event always stands out to me: Cyber Monday. The way shoppers flock to deals and retailers adjust their strategies has always fascinated me, which is why I put together these Cyber Monday Marketing Statistics. As someone who closely follows trends in digital retail, I wanted to gather the most important data points that truly highlight what’s happening in this space. I also drew inspiration from insights shared by a leading marketing agency in New York, which has helped me see how brands position themselves during such a competitive season. I think you’ll find these stats both eye-opening and practical if you’re planning campaigns, or even just curious about how people shop during one of the busiest online events of the year.
Top 20 Cyber Monday Marketing Statistics 2025 (Editor’s Choice)
🛍️ Top 20 Cyber Monday Statistics 2024
Record-Breaking Insights from the Biggest Online Shopping Day Ever
| Rank | Category | Key Statistic |
|---|---|---|
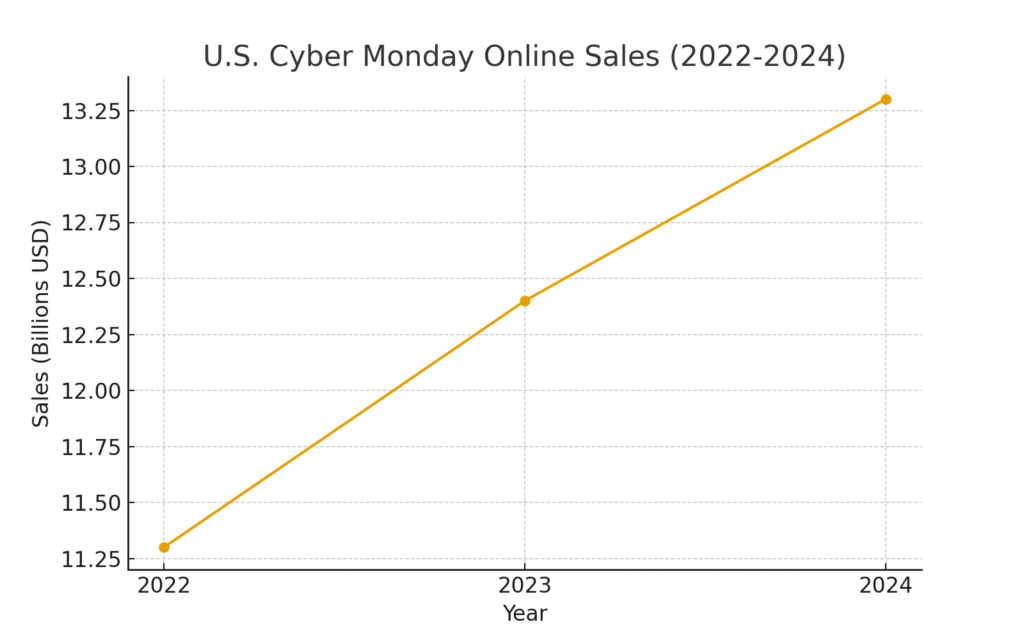
| #1 | SalesRecord Revenue | Cyber Monday 2024 hit $13.3 billion in U.S. online sales, surpassing projections with a 7.3% YoY increase |
| #2 | SalesHistoric Milestone | Became the biggest online shopping day ever, beating 2023's record by 7.3% |
| #3 | SalesPeak Spending | Consumers spent $15.8 million every minute during peak hours (8-10 PM ET) |
| #4 | SalesCyber Week Total | Cyber Week generated $41.1 billion in online sales, up 8.2% year-over-year |
| #5 | SalesGlobal Impact | Worldwide Cyber Monday sales reached approximately $41 billion across all categories |
| #6 | MobileTraffic Dominance | Mobile drove 74% of traffic to retail sites and 57% of total sales ($7.6B) |
| #7 | MobileE-commerce Share | 79% of Cyber Week traffic came from mobile phones, up from 76% in 2022 |
| #8 | ConsumerShopping Intent | 68% of consumers planned to shop on Cyber Monday in 2024 |
| #9 | ConsumerShopper Volume | 197 million U.S. customers shopped during Cyber Monday week |
| #10 | ConsumerAverage Spending | Americans spent an average of $650 on Cyber Monday deals |
| #11 | ConsumerActivity Surge | U.S. consumer activity increased by 512% vs. an average day |
| #12 | PaymentBNPL Growth | Buy Now, Pay Later hit $991.2 million in sales, up 5.5% YoY |
| #13 | ProductsTop Category | Toy sales grew 680% vs. average October day, followed by personal care (530%) and jewelry (478%) |
| #14 | ProductsDiscount Rates | Average Cyber Week discount was 28% for U.S. retailers, down 1% YoY |
| #15 | ProductsPeak Savings | Discounts ranged from 21% to 31% depending on product type |
| #16 | TechnologyAI Impact | AI chatbot-generated traffic surged 1,950% compared to 2023 |
| #17 | TechnologyInfluencer Power | Social influencers drove 20.3% of revenue, converting 6x more than social media overall |
| #18 | MarketingEmail Strategy | Email broadcasts increased 14% YoY with AOV rising 15% |
| #19 | MarketingSMS Growth | SMS broadcasts surged 62%, driving 28% revenue lift YoY |
| #20 | MarketingSMS Value | SMS average order value rose 5% on Cyber Monday 2024 |
Top 20 Cyber Monday Marketing Statistics 2025
Cyber Monday Marketing Statistics #1 – U.S. Cyber Monday 2024 Online Sales Hit $13.3 Billion
In 2024, Cyber Monday online sales in the U.S. surged to $13.3 billion. This represented a 7.3% year-over-year increase, showing that consumer confidence and spending power remained strong. Many brands attributed this growth to deeper discounts and better marketing strategies. Despite inflationary pressures, shoppers still prioritized deals during this digital shopping holiday. This makes Cyber Monday the largest single-day online shopping event in U.S. history.
Cyber Monday Marketing Statistics #2 – Cyber Week Global Sales Reached $298 Billion In 2023
During Cyber Week 2023, global sales topped an impressive $298 billion. This figure highlights how Cyber Monday is no longer just a U.S.-centric event. Retailers worldwide tapped into digital-first campaigns to attract buyers across borders. The globalization of sales events demonstrates how digital marketing connects consumers beyond traditional boundaries. For businesses, this shift emphasizes the importance of scaling campaigns with international reach.
Cyber Monday Marketing Statistics #3 – U.S. Cyber Week Sales Grew 5% YoY In 2023
In 2023, U.S. Cyber Week online sales saw a 5% increase year-over-year. This steady growth showed resilience in consumer spending despite economic uncertainty. Many retailers leaned on targeted promotions and early discounts to drive consistent traffic. The growth suggests that Cyber Monday is becoming more about sustained engagement rather than one-day spikes. Brands that spread promotions across multiple days reaped the biggest rewards.
Cyber Monday Marketing Statistics #4 – Europe’s Cyber Monday Sales Grew 10% In 2023
Europe experienced a 10% year-over-year growth in Cyber Monday sales in 2023. This demonstrates how the event has firmly embedded itself into the European shopping calendar. Countries like the UK, Germany, and France saw significant spikes in e-commerce activity. Localized campaigns and region-specific offers helped retailers gain momentum. The statistic underscores the need for tailored strategies across international markets.
Cyber Monday Marketing Statistics #5 – Buyers Spent $15.8 Million Per Minute On Cyber Monday 2024
At its peak, Cyber Monday 2024 shoppers in the U.S. spent about $15.8 million per minute. This incredible figure highlights the urgency and speed of online purchasing behavior. Limited-time offers and flash sales were major contributors to this rapid spending. Retailers capitalized on urgency marketing, creating a “buy now or miss out” atmosphere. This shows how scarcity-driven tactics amplify Cyber Monday results.
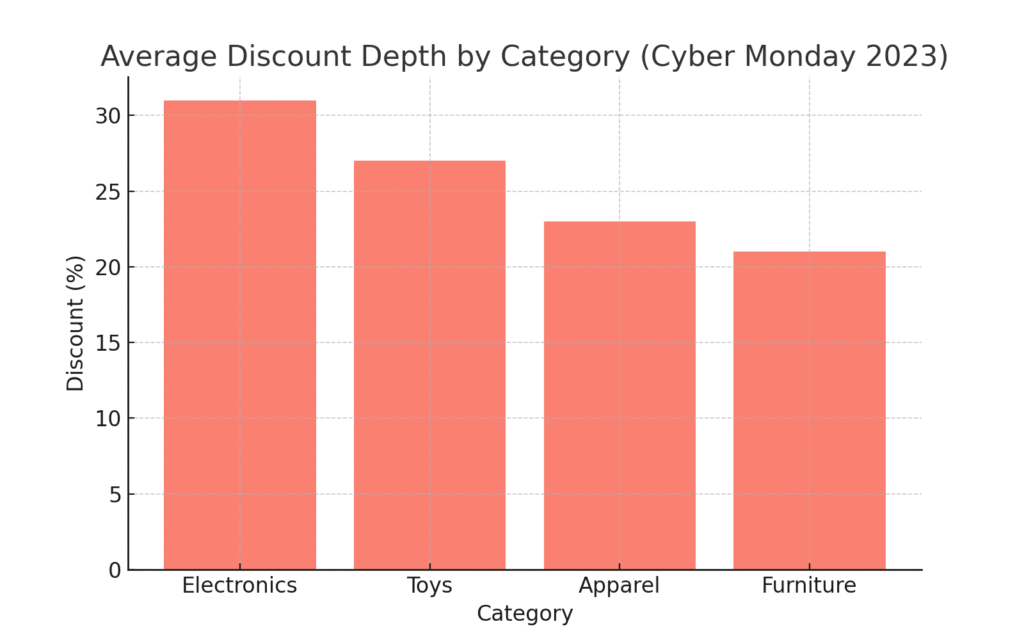
Cyber Monday Marketing Statistics #6 – 57% Of Sales Came From Mobile Devices In 2024
In 2024, 57% of Cyber Monday sales in the U.S. were made through mobile devices. This marks a shift in consumer preference for on-the-go shopping. Retailers with mobile-optimized websites and apps benefited most from this trend. Mobile-first strategies are no longer optional—they are essential. The data confirms that convenience drives conversions during peak shopping events.
Cyber Monday Marketing Statistics #7 – Mobile Traffic Is Rising Across Cyber Week
Cyber Week continues to see a steady rise in mobile traffic. Shoppers increasingly prefer browsing and completing purchases on smartphones and tablets. This shift forces brands to prioritize responsive design and faster mobile checkout options. Poor mobile performance often leads to abandoned carts during these crucial hours. A smooth mobile experience has become a competitive advantage.
Cyber Monday Marketing Statistics #8 – Average Order Value Fell 4% In 2024
The average order value in the U.S. dropped by 4% during Cyber Monday 2024 compared to the previous year. While shoppers purchased more frequently, they spent less per order. This reflects cautious spending behavior in the face of economic pressures. Retailers had to adjust by offering bundles and upsells to maintain margins. The trend reveals a more price-sensitive consumer mindset.
Cyber Monday Marketing Statistics #9 – Number Of Shoppers Dropped To 64.4 Million In 2024
In 2024, the number of Cyber Monday shoppers in the U.S. dropped to 64.4 million, down from 73.1 million in 2023. This decline may indicate increased competition from Black Friday and early holiday promotions. Shoppers are spreading out their purchases rather than concentrating them on one day. However, overall spending still grew, meaning fewer shoppers were spending more efficiently. This reinforces the importance of personalization and targeted offers.
Cyber Monday Marketing Statistics #10 – Apparel Sales Rose 189% Over Average Days
Apparel experienced a 189% surge in Cyber Monday 2023 compared to typical October days. This category saw some of the deepest discounts, attracting fashion-conscious buyers. Retailers leveraged influencer collaborations to amplify their reach. Social media campaigns played a key role in promoting limited-time deals. Apparel remains a cornerstone category for Cyber Monday growth.
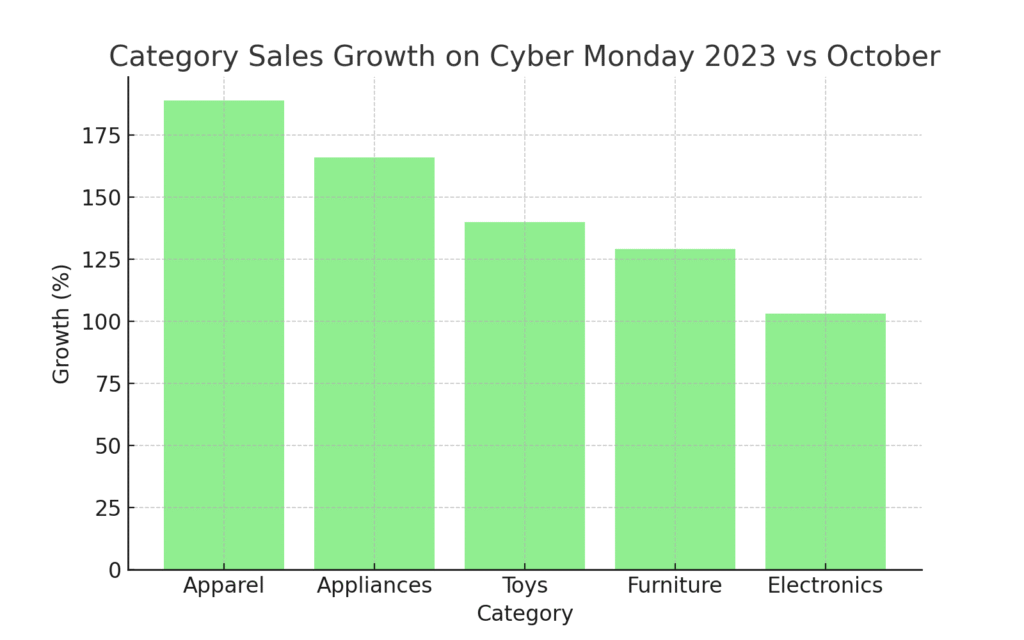
Cyber Monday Marketing Statistics #11 – Appliances Grew 166% On Cyber Monday 2023
Appliances experienced a 166% growth in sales compared to average days in October 2023. Discounts on major brands made big-ticket items more appealing. Many shoppers delayed purchases until Cyber Monday to maximize savings. Home-focused spending trends during and after the pandemic continued to drive this category. This surge reinforces how high-value items thrive during major deal events.
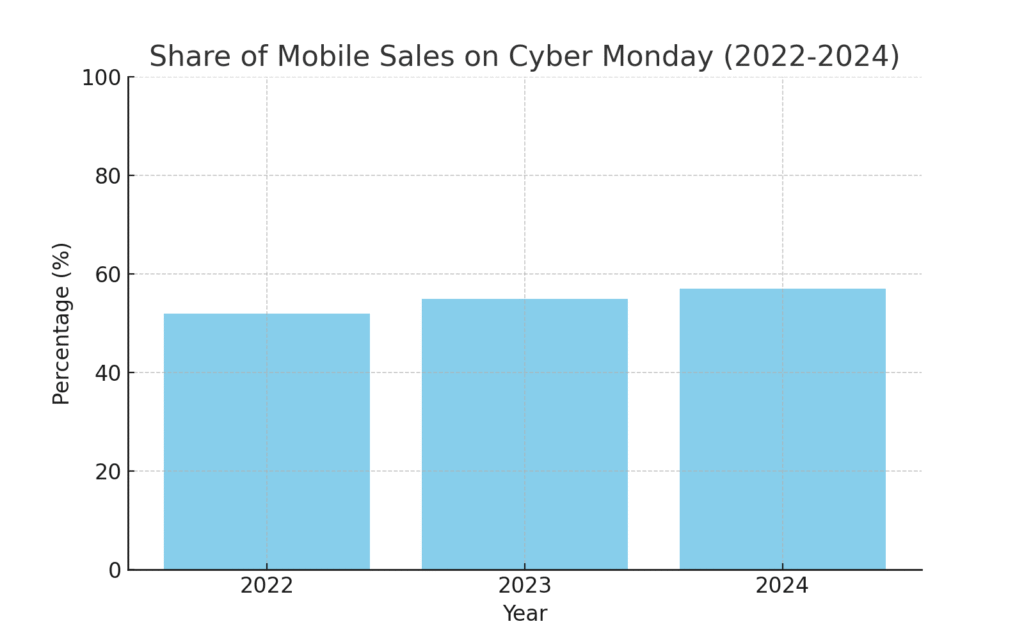
Cyber Monday Marketing Statistics #12 – Electronics Discounts Averaged 30% In 2023
In 2023, electronics discounts averaged around 30–31% during Cyber Monday. Tech products like laptops, TVs, and gaming consoles topped wish lists. The category’s aggressive markdowns helped attract younger and tech-savvy buyers. Retailers leaned heavily on email marketing to highlight deals on trending gadgets. Electronics continue to serve as anchor products that drive large-scale traffic.
Cyber Monday Marketing Statistics #13 – 90% Of Top Retailers Offered Cyber Monday Promotions In 2024
By 2024, 90% of the top 100 online retailers offered Cyber Monday promotions. This shows how widespread and standardized the event has become. Few major players can afford to ignore Cyber Monday’s consumer pull. Competition forces brands to differentiate through unique offers or experiences. For shoppers, this guarantees plenty of options and deeper deals.
Cyber Monday Marketing Statistics #14 – 67,000 Shopify Merchants Set Records In 2024
In 2024, over 67,000 Shopify merchants hit record-breaking sales during the Black Friday–Cyber Monday weekend. This milestone reflects the democratization of e-commerce success. Small and mid-sized businesses leveraged Shopify’s tools to compete with larger retailers. Independent merchants thrived through niche marketing and personalized engagement. Cyber Monday’s opportunities extend far beyond big-box retailers.
Cyber Monday Marketing Statistics #15 – Percentage-Off Discounts Remained Most Popular
Percentage-off discounts remained the most popular deal type on Cyber Monday 2024. Shoppers still respond strongly to clear, straightforward savings. Many retailers combined this with free shipping or bundled deals. Transparency in pricing helped build consumer trust. The trend highlights that simplicity still wins in holiday promotions.
Cyber Monday Marketing Statistics #16 – Influencers Drove 20% Of U.S. Cyber Monday Revenue In 2024
Influencers and affiliate marketers drove 20% of e-commerce revenue during Cyber Monday 2024 in the U.S. This shows how powerful social selling has become. Short-form video platforms like TikTok and Instagram reels were major channels. Consumers increasingly rely on authentic product recommendations from creators. Collaborating with influencers is now a critical Cyber Monday strategy.
Cyber Monday Marketing Statistics #17 – Email And Social Media Remain Top Marketing Channels
Email marketing and organic social media remain highly effective for Cyber Monday campaigns. Emails with exclusive codes saw higher open and conversion rates. Social platforms fueled discovery and impulse purchases. Combining both channels provided strong reinforcement of brand messaging. Cyber Monday success often comes from multi-channel engagement.
Cyber Monday Marketing Statistics #18 – Retailer Competition Intensified In 2024
Competition among retailers during Cyber Monday 2024 intensified. Brands raced to launch deals earlier and extend promotions longer. This “holiday creep” blurred the lines between Black Friday and Cyber Monday. Shoppers benefitted from extended deal windows but became harder to capture. Standing out required personalized offers and stronger loyalty programs.
Cyber Monday Marketing Statistics #19 – Cyber Monday Remains Largest Online Shopping Day In U.S.
Cyber Monday consistently holds its title as the largest single online shopping day in the U.S. The event outpaces Black Friday in terms of digital-only revenue. This reinforces the importance of online-first strategies for retailers. Consumer behavior now prioritizes digital deals over in-store visits. Brands ignoring this shift risk missing out on the biggest e-commerce day of the year.
Cyber Monday Marketing Statistics #20 – Global Shopping Habits Continue To Evolve
Cyber Monday highlights how global shopping habits are evolving. Consumers worldwide now expect deals regardless of borders. Mobile usage, deeper discounts, and social media influence dominate this shift. Retailers must adapt to fast-changing consumer expectations. The holiday reflects a new era of borderless, digital-first commerce.
Final Thoughts on Cyber Monday Marketing
Looking back at these Cyber Monday Marketing Statistics, I can’t help but feel both excited and challenged as a marketer. On one hand, the growth and energy behind this shopping holiday show us just how powerful digital sales have become. On the other hand, the competition is fierce, and success really comes down to preparation and smart strategy. My hope is that sharing these insights gives you the same clarity it gave me when I first gathered them. After all, Cyber Monday isn’t just about sales—it’s about understanding consumer behavior, adapting to it, and building campaigns that genuinely connect with people.
SOURCES
https://cropink.com/cyber-monday-statistics
https://dotdigital.com/blog/black-friday-cyber-monday-stats/
https://www.loopreturns.com/blog/black-friday-cyber-monday-numbers-exclusive-data-insights-loop/
https://www.driveresearch.com/market-research-company-blog/cyber-monday-statistics/
https://wisernotify.com/blog/cyber-monday-stats/
https://queue-it.com/blog/cyber-monday-statistics/
https://news.adobe.com/news/2024/12/120324-adi-cyber-monday-recap
https://www.lotame.com/resources/black-friday-marketing-strategies-data-driven-insights/
https://katanamrp.com/blog/black-friday-trends/
https://www.storyly.io/post/black-friday-statistics-you-should-know
https://elpais.com/economia/2024-12-16/el-black-friday-que-cambio-la-forma-de-comprar.html