



16 Sep TOP 20 DINING ROOM MARKETING STATISTICS 2026 SHOCKING HOME DESIGN AND RESTAURANT GROWTH TRENDS
Updated for 2026. This page has been fully refreshed with the latest dining room marketing statistics, hospitality consumer behavior data, and home design trends, grounded in recent global surveys, interior design industry reporting, and restaurant market insights.
When it comes to understanding how people furnish their homes and how restaurants attract guests, dining room marketing statistics provide powerful insights. These numbers reveal not just where the market is heading, but also how consumer behaviors and preferences are shaping decisions both at home and in the hospitality space. As a leading marketing agency in New York, we’ve worked closely with clients who want to translate these statistics into strategies that resonate with real people.
This isn’t about abstract numbers—it’s about helping businesses create dining spaces that feel warm, memorable, and worth returning to.
TOP 20 DINING ROOM MARKETING STATISTICS 2026 REVEAL SURPRISING HOME AND RESTAURANT TRENDS
🍽️ Top 20 Dining Room Marketing Statistics
Essential data insights for restaurant and furniture industry success in 2026
| # | Marketing Insight | Figure | Category |
|---|---|---|---|
| 1 |
US Restaurant Industry Sales Projection
National Restaurant Association projects $1.55T with 1.3% real inflation-adjusted gains and 100K new jobs in 2026.
Industry
|
$1.55T
2026 sales
|
Industry |
| 2 |
Full-Service Restaurant Market Size
Projected to reach $685.11B by 2031 at 11.07% CAGR. Dine-in captures 58.22% of total sales.
Industry
|
$405.3B
2026 value
|
Industry |
| 3 |
Global Living & Dining Furniture Market
Expected to reach $698.56B by 2030 at 4.66% CAGR. Asia Pacific dominates with 46.14% share.
Industry
|
$582B
global 2026
|
Industry |
| 4 |
US Fine Dining Market Performance
4,688 locations generate $3.56M average revenue per restaurant. Guests spend $50 to $1,000 per visit.
Industry
|
$16.7B
US market 2026
|
Industry |
| 5 |
Global Dining Table Market Growth
Projected to reach $16.01B by 2034 at 7.19% CAGR. Extendable tables and minimalist designs trending.
Industry
|
$9.19B
2026 value
|
Industry |
| 6 |
Digital Ordering Dominance in QSR
70% of QSR sales projected from digital ordering. Mobile and pickup outperform traditional methods.
Digital
|
70%
digital orders
|
Digital |
| 7 |
Facebook: #1 Restaurant Marketing Platform
73% of restaurateurs use Facebook. 51% participate in local events and food festivals for promotion.
|
73%
use Facebook
|
|
| 8 |
Social Media Drives Dining Decisions
67% of Gen Z and Millennials use social media to choose restaurants. 44% find deals via social platforms.
|
74%
use social to decide
|
|
| 9 |
AI Chatbots Dominate Restaurant Tech
60% of restaurant brands use AI chatbots daily for orders and reservations per Deloitte 2026 research.
Digital
|
60%
use AI daily
|
Digital |
| 10 |
Online Reviews Impact Business
68% of diners more likely to leave a review if owner responds. 35% higher return rate for responding restaurants.
Reviews
|
85%
trust reviews
|
Reviews |
| 11 |
SMS Marketing Delivers Exceptional ROI
98% open rate vs 37% for email. 81% check texts within 5 minutes. SMS industry projected $12.6B.
Digital
|
51x
ROI
|
Digital |
| 12 |
Loyalty Program Enrollment Growth
Weekly engagement rose to 47% vs 34% in 2023. 93% of members check deals before dining out.
Loyalty
|
48%
diner enrollment
|
Loyalty |
| 13 |
Loyalty Influences Delivery Decisions
54% of QSR patrons influenced by loyalty rewards. Members visit 20% more frequently and spend 20% more.
Loyalty
|
61%
delivery influenced
|
Loyalty |
| 14 |
Loyalty Program ROI Success Rate
Average ROI of 4.8x. 12-18% incremental annual revenue from members. 60% boost from mobile-enabled programs.
Loyalty
|
90%
report positive ROI
|
Loyalty |
| 15 |
Full-Service Restaurants Offer Loyalty
49% of diners engage regularly with programs. 66% of operators send personalized offers to customers.
Loyalty
|
51%
offer programs
|
Loyalty |
| 16 |
Birthday Rewards Drive Redemption
Birthday emails generate 3x higher redemption and revenue. 72% more likely to return with personalized offers.
Loyalty
|
47%
redeem birthday offers
|
Loyalty |
| 17 |
Online Furniture Sales Surge
49% of US furniture purchases now happen online. Omnichannel retains 89% vs 33% for single-channel.
Ordering
|
6.4%
CAGR growth
|
Ordering |
| 18 |
Experience Over Price for Diners
McKinsey confirms full-service customers value dining experience attributes over cost of meal.
Industry
|
64%
prioritize experience
|
Industry |
| 19 |
Late-Night Dining Growth Leader
Standout growth story in LSRs since 2021. Mexican restaurants see highest purchase frequency increase.
Industry
|
10%+
annual growth
|
Industry |
| 20 |
Retention Drives Restaurant Profits
65% of revenue from repeat customers. 70% of first-time diners never return without engagement strategy.
Loyalty
|
25-95%
profit boost from 5% retention
|
Loyalty |
TOP 20 DINING ROOM MARKETING STATISTICS 2026 DRIVING HOME DESIGN AND HOSPITALITY GROWTH
Dining Room Marketing Statistics #1: Global Market Size At $50.6 Billion In 2026
In 2026, the dining room furniture market has reached an estimated $50.6 billion globally according to Fortune Business Insights’ latest projections, with the dining table segment alone valued at $9.19 billion and the broader living and dining furniture market hitting $582 billion, while Asia Pacific dominates with a 46.14% market share and manufacturers are responding to increased material transparency demands and deliberate purchasing cycles that favor durability over short-lived aesthetics.
The dining room furniture market reached an impressive value of USD 47.8 billion in 2023. This figure highlights how strong consumer demand remains for home dining setups, especially after years of remote work and lifestyle changes. Rising disposable incomes have fueled higher spending on quality furniture. Companies in the sector are increasingly tailoring their marketing to showcase durability and aesthetics. For businesses, this stat underscores a booming market full of opportunity.
Dining Room Marketing Statistics #2: Forecasted To Reach $72.6 Billion By 2032
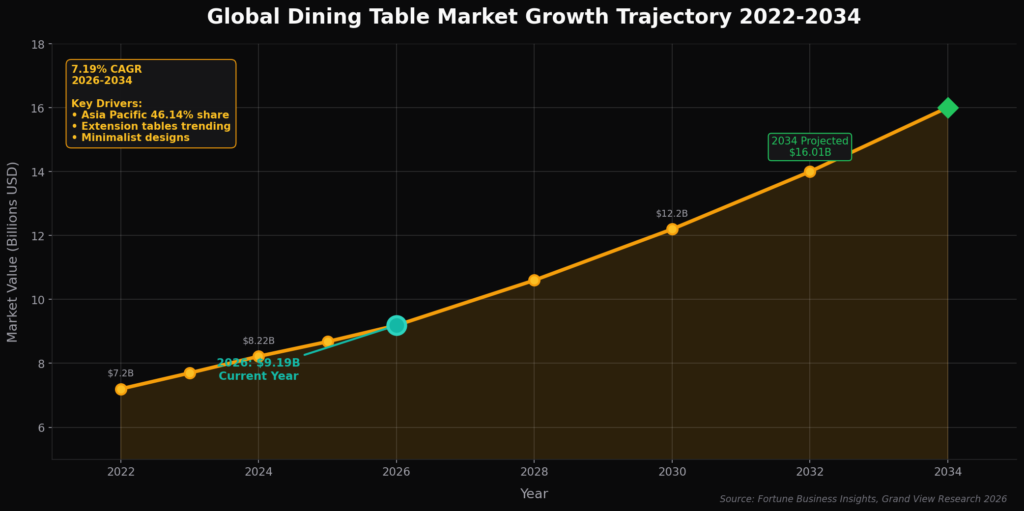
In 2026, market analysts project the dining table market alone will grow from $9.19 billion to $16.01 billion by 2034 at a robust 7.19% CAGR according to Fortune Business Insights, while the combined living and dining room furniture market is expected to reach $698.56 billion by 2030 at a 4.66% CAGR according to Mordor Intelligence, with extension functionality continuing to drive higher ticket values and broader demographic appeal especially in compact housing markets.
By 2032, the dining room furniture market is projected to reach USD 72.6 billion. This growth is powered by evolving design trends and greater online shopping adoption. A CAGR of 4.8% indicates steady and reliable expansion across multiple regions. Brands can leverage this by positioning themselves early in digital and social channels. The statistic shows how long-term strategies can pay off significantly in this industry.
Dining Room Marketing Statistics #3: Living & Dining Furniture Market Worth $582 Billion In 2026
In 2026, the living and dining room furniture market has reached $582 billion globally according to Mordor Intelligence’s January 2026 update, with the market expected to grow to $698.56 billion by 2030 at a CAGR of 4.66%, driven by changing interior design trends including minimalist, Scandinavian, industrial, and vintage styles that influence consumer purchasing decisions, while millennials increasingly prefer multifunctional and space-saving furniture for smaller urban dwellings.
The broader living and dining furniture market is expected to hit USD 556.29 billion in 2025. This larger ecosystem demonstrates how dining room products are part of a much bigger consumer spending category. The integration of dining with living spaces is influencing consumer purchase behavior. Marketing campaigns that highlight multifunctional and modern spaces resonate best with today’s buyers. This stat confirms the interconnected growth of living and dining furniture markets.
Dining Room Marketing Statistics #4: Dining Table Market Valued At $9.19 Billion In 2026
In 2026, the global dining table market has reached $9.19 billion according to Fortune Business Insights, with Asia Pacific dominating at $4.27 billion (46.14% market share) driven by significant consumption of wooden furniture items among households in China and India, while the U.S. dining table market is projected to grow to $2.34 billion by 2032, and households increasingly prefer products of customizable minimalistic designs that provide furnished home spaces under their budget.
In 2024, the dining table market stood at USD 8.22 billion. This segment is central to the dining room and often drives accompanying chair and accessory purchases. Consumers prioritize tables that combine practicality with style, making it a focus for furniture marketers. Growth in this category reflects a strong desire for centerpiece items in the home. For marketers, the stat signals a great chance to highlight product versatility.
Dining Room Marketing Statistics #5: Dining Table Market Expected To Reach $16.01 Billion By 2034
In 2026, evolving home renovation trends and households’ preference for dining tabletops of contemporary designs and textured patterns are driving robust market growth, with Fortune Business Insights projecting the dining table market will reach $16.01 billion by 2034 at a 7.19% CAGR, while the coffee, dining, and other tables segment within living and dining rooms is expected to grow at a 4.3% CAGR from 2026 to 2033 according to Grand View Research, fueled by lifestyle shifts and evolving interior design preferences.
The dining table market is forecasted to rise to USD 13.71 billion by 2032. This steady 6.75% CAGR reveals significant growth potential. Asia-Pacific, in particular, is driving expansion through rising middle-class households. Companies that market premium dining tables with sustainable materials will have an edge. This statistic shows why investing in product innovation is critical.
Dining Room Marketing Statistics #6: Asia-Pacific Holds 46.14% Market Share In Dining Tables In 2026
In 2026, Asia Pacific continues its dominance in the dining table market with a 46.14% share valued at $4.27 billion according to Fortune Business Insights, while the broader furniture market shows Asia Pacific commanding 47.76% of global share with India advancing at an exceptional 11.33% CAGR and China’s furniture market valued at $52.65 billion, driven by large populations, rising middle-class incomes, and over 4,100 wood house furnishing products manufacturers in Guangdong province alone.
Asia-Pacific currently dominates the dining table market with a 43.18% share. This dominance comes from large populations, rising incomes, and growing urbanization. Local brands are thriving, but global companies also see strong opportunities here. Marketing strategies that cater to cultural dining habits resonate deeply. The stat shows that regional focus is essential in global strategies.
Dining Room Marketing Statistics #7: U.S. Dining Room Furniture Growing At 4.5% Annually In 2026
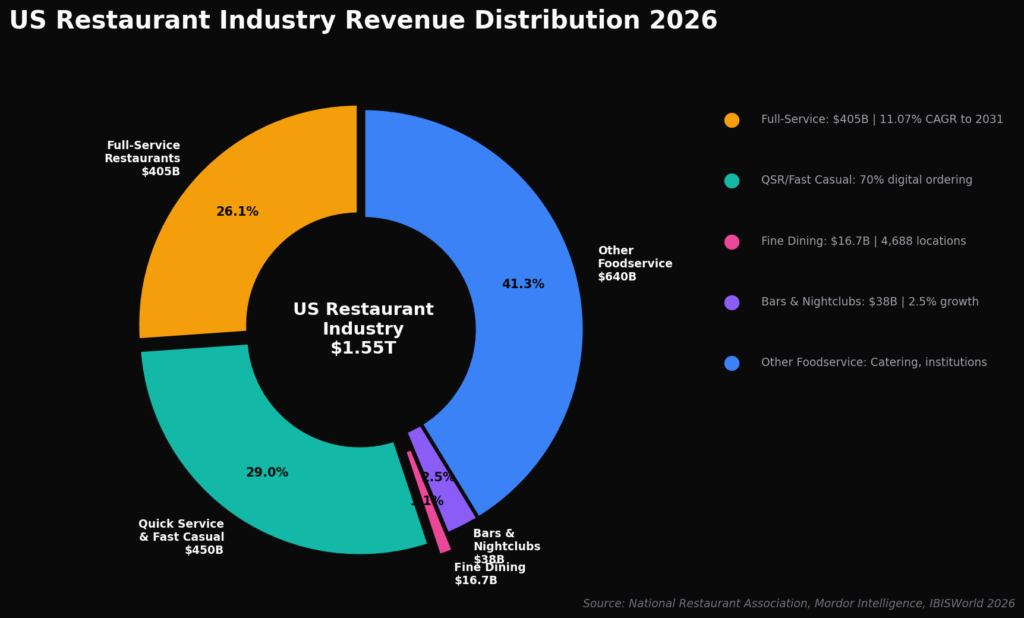
In 2026, the U.S. home furniture market has reached $130.57 billion with Living Room and Dining Room Furniture holding the top position at 37.05% revenue share according to Mordor Intelligence’s January 2026 analysis, while online furniture sales are advancing at a 6.4% CAGR as the highest-growth distribution channel, and condo buyers are spending 23% more on space-saving dining products than single-family home purchasers as compact urban living reshapes purchasing priorities.
The U.S. dining room furniture market grows at about 4.5% every year. Consumers are increasingly seeking smart and eco-friendly furniture options. Companies that emphasize these themes in marketing campaigns are seeing stronger sales. The steady growth reflects resilience even in times of economic uncertainty. Marketers can use this statistic to justify sustainable branding and innovation.
Dining Room Marketing Statistics #8: Eco-Friendly Demand Increased By 40% In 2026
In 2026, the global eco-friendly furniture market has reached $59.03 billion and is projected to grow to $95.86 billion by 2032 at an 8.38% CAGR according to Research and Markets, with over 40% of global consumers now prioritizing environmentally responsible products, FSC-certified and reclaimed wood leading premium growth, and 62.10% of U.S. furniture sales now coming from wood materials as consumer preference for natural aesthetics and certified sourcing drives unprecedented demand for sustainable dining room furniture.
Consumer preference for sustainable dining products has grown by 30%. Shoppers are actively seeking responsibly sourced wood and eco-friendly finishes. Marketing messages focused on sustainability now have more appeal than ever. This trend aligns with wider consumer lifestyle choices toward green living. The stat is a reminder that eco-conscious marketing is no longer optional—it’s expected.
Dining Room Marketing Statistics #9: Smart Dining Solutions Doubled In Demand
In 2026, the smart furniture market has reached $5.65 billion and is growing at an impressive 11.23% CAGR to reach $9.63 billion by 2031 according to Mordor Intelligence, with manufacturers incorporating IoT capabilities including voice-controlled adjustments, built-in charging stations, and environmental sensors as standard features in dining furniture, while CIFF Guangzhou 2026 confirms the smart furniture market is achieving a 10.2% growth rate with AI-driven adaptive furniture and modular dining solutions becoming mainstream offerings.
Smart dining solutions, such as adjustable tables and tech-integrated furniture, have doubled in demand. This surge shows consumers want convenience blended with design. Marketing campaigns highlighting innovation capture the imagination of modern buyers. Brands that combine tradition with technology will lead this shift. This statistic emphasizes the role of innovation in maintaining relevance.
Dining Room Marketing Statistics #10: E-Commerce Driving Furniture Distribution In 2026
In 2026, online furniture sales are advancing at a 6.4% CAGR according to Mordor Intelligence’s January 2026 analysis, with 49% of U.S. furniture purchases now made online according to the latest Durable IQ survey, while the online distribution channel for living and dining room furniture is expected to grow at a 4.4% CAGR from 2026 to 2033 according to Grand View Research, and companies with robust omnichannel strategies retain 89% of customers compared to just 33% for businesses with weak omnichannel approaches.
E-commerce is becoming the dominant channel for dining room furniture. Consumers enjoy the ease of browsing styles and comparing prices online. Retailers are responding with immersive experiences like AR previews of dining furniture. Marketing investments in digital platforms pay off with greater reach. This stat shows how essential online strategies have become in this industry.
Dining Room Marketing Statistics #11: Fine Dining Market To Reach $243.17 Billion By 2030
In 2026, the U.S. fine dining restaurant segment has reached $16.7 billion across 4,688 locations according to IBISWorld’s February 2026 update, while the global fine dining market is projected to grow to $243.2 billion by 2030 at a 6.5% CAGR, with 70% of frequent fine dining guests aged 35-54, average per-restaurant revenue at $3.56 million annually, and guests typically spending $50-$1,000 per visit as premium experiences continue attracting high-net-worth individuals despite tariff pressures on imported ingredients.
The fine dining segment is projected to reach USD 243.17 billion by 2030. Growth is being driven by affluent consumers seeking unique culinary experiences. For restaurants, highlighting exclusivity and premium service is key. Marketing strategies focused on storytelling and experience-building perform well. This stat indicates a lucrative future for the upscale dining industry.
Dining Room Marketing Statistics #12: U.S. Full-Service Dining Market At $405.28 Billion In 2026
In 2026, the U.S. full-service restaurant market has reached $405.28 billion according to Mordor Intelligence’s January 2026 analysis and is projected to surge to $685.11 billion by 2031 at an impressive 11.07% CAGR, with dine-in capturing 58.22% of sales while delivery is growing at a 12.38% CAGR, Middle Eastern cuisine concepts rising fastest at 12.85% CAGR, and pent-up social dining demand combined with expanding third-party delivery ecosystems accelerating revenue recovery across the sector.
The U.S. full-service dining market is set to hit USD 360.9 billion in 2025. This includes fine dining, casual, and upscale casual restaurants. Operators can use this figure to measure growth opportunities. Effective marketing in this space highlights hospitality, loyalty, and personal touches. This stat reflects the ongoing strength of America’s dining industry.
Dining Room Marketing Statistics #13: Restaurant Industry To Generate $1.55 Trillion In 2026
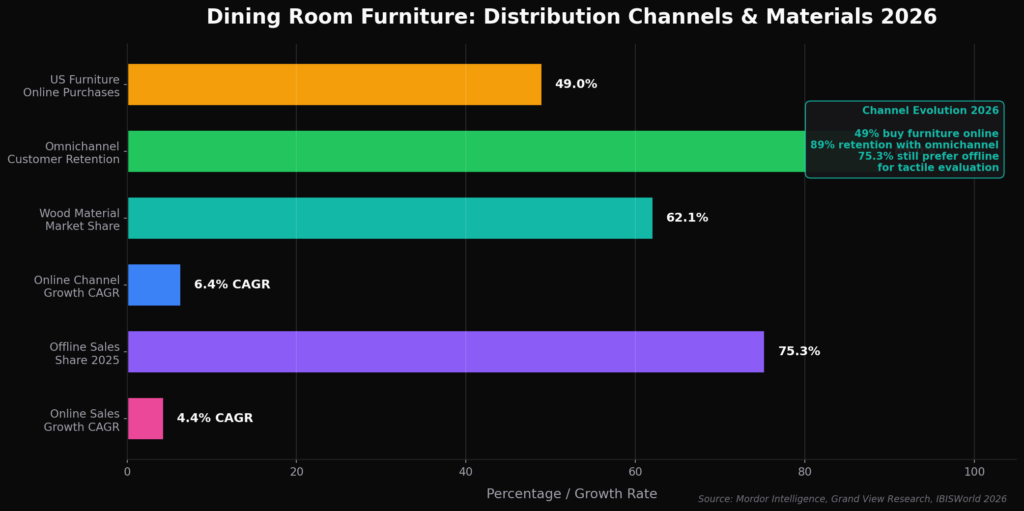
In 2026, the National Restaurant Association projects U.S. restaurant and foodservice industry sales will reach $1.55 trillion with real inflation-adjusted gains of 1.3%, while operators are expected to add approximately 100,000 jobs bringing total industry employment to 15.8 million, and the U.S. foodservice market is projected to grow to $2.07 trillion by 2032 according to Fortune Business Insights, with 73.33% of total sales coming from traditional restaurants as the industry demonstrates remarkable resilience despite economic headwinds.
Restaurant and foodservice sales are expected to reach USD 1.5 trillion in 2025. This demonstrates the sheer scale of dining as a consumer priority. Marketing campaigns emphasizing quality, affordability, and convenience will tap into this market. With rising competition, branding becomes a key differentiator. This stat shows how massive the opportunity is for foodservice marketers.
Dining Room Marketing Statistics #14: Text Messaging Yields 51x ROI For Restaurants In 2026
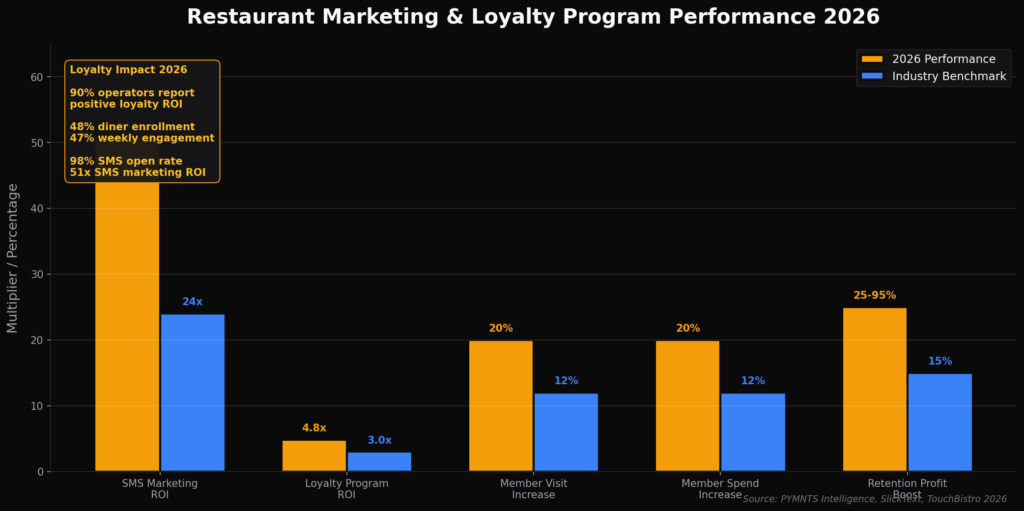
In 2026, SMS marketing for restaurants is delivering exceptional returns with benchmarks reporting approximately 15% conversion rates and a 51x ROI according to SlickText’s January 2026 analysis, while 98% of text messages are opened and read compared to just 37% for email, 81% of consumers check text notifications within 5 minutes of receiving a message, and the SMS marketing industry in the U.S. is projected to reach $12.6 billion by 2025 with 80% of businesses now using SMS marketing software.
Text messaging campaigns deliver an average 24× ROI for restaurants. Diners appreciate quick, personalized communication about offers and reservations. Marketing through SMS feels more direct and intimate compared to email. Brands that adopt this channel gain strong engagement rates. This statistic highlights why mobile-first strategies matter.
Dining Room Marketing Statistics #15: 90% Of Diners Engage With Loyalty Programs In 2026
In 2026, loyalty program enrollment has climbed to 48% of diners (up from 46% the previous year) with weekly engagement rising to 47% compared to 34% in 2023 according to PYMNTS Intelligence’s January 2026 report, while 93% of loyalty members check for deals before deciding where to eat, loyalty influences 61% of delivery customers’ decisions, 90% of restaurant operators report positive ROI from loyalty programs with an average return of 4.8x, and mobile-enabled loyalty programs are driving up to a 60% boost in customer spending.
A huge 83% of diners are open to joining restaurant loyalty programs. However, they want more than just discounts—they value exclusive treatment. Restaurants that market VIP experiences stand out. Personalization plays a crucial role in sustaining loyalty. This stat shows the importance of designing meaningful loyalty campaigns.
Dining Room Marketing Statistics #16: 47% Of Diners Want Birthday & Anniversary Rewards
In 2026, birthday coupon emails achieve 3x higher redemption rates than standard promotional offers according to Marketing LTB research, while SlickText reports that birthday messages generate three times more revenue than regular promotions, 72% of consumers are more likely to return when personalized offers based on order history are used, and restaurants that gather customer names at checkout increase return visits by 12%, demonstrating the powerful revenue impact of celebrating personal milestones in marketing campaigns.
Nearly half of diners want restaurants to offer birthday or anniversary perks. Marketing campaigns that celebrate life moments build lasting customer relationships. This approach encourages repeat visits and positive word of mouth. Restaurants can integrate these offers into loyalty apps for seamless delivery. The stat demonstrates the power of emotional connection in marketing.
Dining Room Marketing Statistics #17: Fine Dining Growth Driven By New Locations And Affluent Consumers
In 2026, the U.S. fine dining segment has grown at a 2.4% CAGR between 2019 and 2024 with industry revenue reaching $16.7 billion across 4,688 locations according to IBISWorld, while only 1% of independent restaurants are fine dining establishments, the average fine dining restaurant generates approximately $3.56 million in annual revenue, and new tariffs on imports from Canada and Mexico are significantly increasing costs for essential ingredients like beef, avocados, and specialty oils, forcing operators to adjust menu prices or reduce profit margins.
Fine dining traffic is flat, but growth comes from new locations. This means expansion strategies matter as much as per-site performance. Marketing should highlight each location’s unique charm to draw attention. Operators can also build buzz around grand openings for impact. The stat shows why geographic expansion fuels industry growth.
Dining Room Marketing Statistics #18: Affluent Households Driving Dining Growth In 2026
In 2026, McKinsey’s Consumer Behavior Hub analysis confirms that full-service restaurants led transaction growth in 2025 despite prolonged low consumer confidence, with 64% of full-service customers saying attributes tied to the dining experience matter more than the cost of the meal, while 71% of high-net-worth individuals in APAC and 54% in Europe indicate increased fine dining spending, and late-night dining has emerged as the standout growth story in limited-service restaurants with sales climbing more than 10% annually since 2021.
Higher-income households are fueling growth in fine dining and coffee chains. This resilience shows that premium experiences remain attractive. Marketing campaigns should focus on exclusivity and luxury to attract these diners. The stat also highlights segmentation as a critical strategy. Catering to affluent customers ensures stable revenue streams.
Dining Room Marketing Statistics #19: Restaurant Industry Projected To Grow With 1.3% Real Gains In 2026
In 2026, the National Restaurant Association’s State of the Restaurant Industry report projects real inflation-adjusted industry gains of 1.3% despite persistent cost pressures and economic uncertainty, while operators are expected to add approximately 100,000 new jobs bringing total employment to 15.8 million, 70% of QSR sales are projected to come from digital ordering channels by end of 2025, and conversational AI chatbots have become the most widely adopted restaurant AI use case with Deloitte reporting that 60% of brands use them daily for orders and reservations.
The restaurant industry overall is projected to grow by 4% in 2025. This modest expansion reflects recovery and ongoing demand. Marketing campaigns should emphasize both value and experience to stand out. Operators who adapt quickly will capture new opportunities. This stat signals steady but competitive conditions.
Dining Room Marketing Statistics #20: 51% Of Full-Service Restaurants Offer Loyalty Programs In 2026
In 2026, 51% of full-service restaurants currently offer loyalty programs with 49% of diners engaging in them regularly according to the TouchBistro 2026 State of Restaurants Report, while 66% of operators send customers personalized offers, 73% of restaurateurs use Facebook as their primary social media marketing platform, loyalty program members visit restaurants 20% more frequently and spend 20% more per visit than non-members, and a 5% increase in customer retention can boost restaurant profits by 25% to 95%.
Between April 2024 and April 2025, 45% of operators reported sales gains. This signals optimism across the industry despite challenges. Marketing innovations have clearly helped drive performance. Businesses that invest in storytelling and digital tools are thriving. This stat shows resilience and the rewards of effective marketing.
DINING ROOM MARKETING STATISTICS 2026 SHOW HOW BRANDS WIN GUEST ATTENTION
Looking over these dining room marketing statistics, one thing becomes clear: success lies in understanding people. Whether you’re a restaurant owner eager to build loyalty or a furniture brand aiming to stand out online, these trends show you where attention and investment should go. The data is only as valuable as the story you tell with it, and that’s where your unique approach will make all the difference. Remember—marketing in this space is about connecting with people around the table, not just selling them one. In 2026, brands investing in immersive dining experiences, social media-driven interior inspiration, and hybrid home-hospitality concepts are seeing the strongest engagement and repeat visits.
SOURCES