



18 Sep TOP 20 FARM EQUIPMENT MARKETING STATISTICS 2025
When I first started digging into farm equipment marketing statistics, I didn’t realize just how much these numbers could tell us about the future of agriculture and business opportunities. As someone who works closely with a leading marketing agency in New York, I’ve seen firsthand how important it is for brands to back their strategies with solid data. These stats aren’t just about dollars and percentages — they reveal trends in farmer behavior, technology adoption, and the regions that hold the biggest growth potential. My goal in sharing this is to give you a clear, practical picture of where the farm equipment market is heading, and how we can use that knowledge to make smarter marketing moves.
Top 20 Farm Equipment Marketing Statistics 2025 (Editor’s Choice)
| Stat # | Statistic / Data Point | Category | Region / Scope |
|---|---|---|---|
| 1 | Global agriculture equipment market valued at USD 169.55B in 2024 | Market Size | Global |
| 2 | Expected to reach USD 295.28B by 2033 (CAGR 6.7%) | Forecast | Global |
| 3 | Projected to grow to USD 344.73B by 2032 (CAGR 7.5%) | Forecast | Global |
| 4 | Growth from USD 183.25B (2024) to USD 240.4B (2029), CAGR 5.9% | Forecast | Global |
| 5 | Farm equipment market valued at USD 102.8B in 2023, growing to USD 151.9B by 2032 | Market Size | Global |
| 6 | Asia-Pacific held 37.7% share of global market in 2024 | Regional Share | Asia-Pacific |
| 7 | Asia-Pacific dominated with 39.24% share in 2024 | Regional Share | Asia-Pacific |
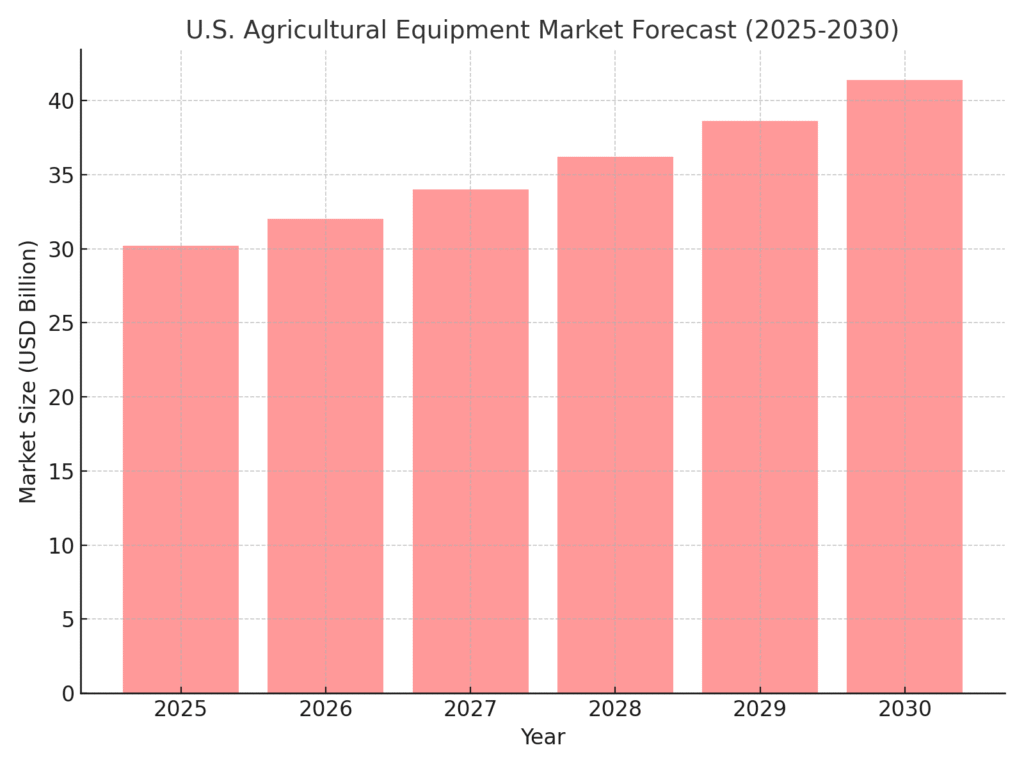
| 8 | U.S. market valued at USD 30.2B in 2025, reaching USD 41.4B by 2030 | Market Size | U.S. |
| 9 | Tractors held 34.9% share of global equipment market in 2024 | Segment | Global |
| 10 | Livestock equipment segment valued at USD 22.75B in 2024 | Segment | Global |
| 11 | Average price of 200-HP tractors rose 287% since 1990 | Pricing Trend | Global |
| 12 | High equipment cost and labor shortage remain major restraints | Challenges | Global |
| 13 | Growing demand for precision agriculture technologies | Trend | Global |
| 14 | Global demand forecast to grow 3.6% per year, reaching USD 216B by 2028 | Forecast | Global |
| 15 | U.S. irrigation machinery projected to grow at CAGR 9.4% (to 2030) | Segment Growth | U.S. |
| 16 | Farmers increasingly renting equipment instead of buying | Behavior | Global |
| 17 | Manufacturers investing heavily in autonomous machinery | Trend | Global |
| 18 | Google search interest for farm brands hit historic low in May 2025 | Market Signal | Global |
| 19 | Rising costs make ROI and fuel efficiency key marketing points | Strategy | Global |
| 20 | Asia-Pacific seen as highest-return region for marketing efforts | Strategy | Asia-Pacific |
Top 20 Farm Equipment Marketing Statistics 2025
Farm Equipment Marketing Statistics #1: Global Agriculture Equipment Market Valued At USD 169.55 Billion In 2024
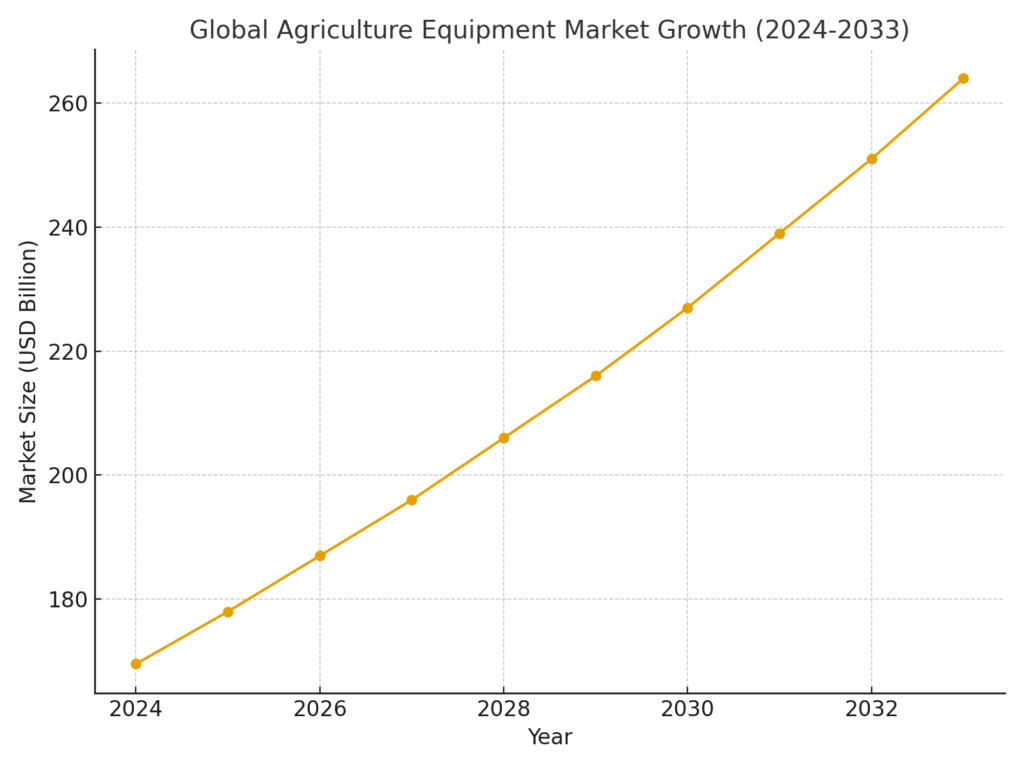
The global agriculture equipment market reached a staggering USD 169.55 billion in 2024, showing how massive this sector has become. This figure reflects the growing demand for modern machinery among farmers worldwide. Marketing strategies can highlight the size and stability of the industry to reassure potential buyers and investors. With such a large market, there’s plenty of opportunity for brands to target niche segments. It also sets the stage for understanding the importance of forecasting growth in this field.
Farm Equipment Marketing Statistics #2: Expected To Reach USD 295.28 Billion By 2033 (CAGR 6.7%)
Forecasts show the market could climb to USD 295.28 billion by 2033, expanding at a healthy CAGR of 6.7%. This steady growth indicates resilience despite global economic challenges. For marketers, this means positioning products as long-term investments with future relevance. Campaigns that emphasize efficiency and sustainability will likely resonate with this projected expansion. It also points to the need for staying ahead with innovation in product offerings.
Farm Equipment Marketing Statistics #3: Projected To Grow To USD 344.73 Billion By 2032 (CAGR 7.5%)
Another analysis places the market at USD 344.73 billion by 2032, with an even stronger CAGR of 7.5%. Competing forecasts like this demonstrate confidence in the sector’s growth trajectory. For businesses, it’s a reminder to prepare for a larger pool of customers with diverse needs. Marketing strategies can focus on emerging opportunities like smart farming tools. Ultimately, the numbers highlight the consistent upward momentum of this market.
Farm Equipment Marketing Statistics #4: Growth From USD 183.25 Billion In 2024 To USD 240.4 Billion By 2029
From 2024 to 2029, the market is expected to increase from USD 183.25 billion to USD 240.4 billion. This 5.9% CAGR reflects stable growth that marketers can use as a confidence booster in campaigns. Such predictability makes it easier for businesses to plan long-term strategies. It also shows that farm equipment is becoming more of a necessity than a luxury. Messaging around durability and reliability will appeal strongly in such a steady market.
Farm Equipment Marketing Statistics #5: Farm Equipment Market Valued At USD 102.8 Billion In 2023
In 2023, the farm equipment market was valued at USD 102.8 billion, with projections reaching USD 151.9 billion by 2032. This stat reveals that even smaller sub-segments of the industry are booming. For marketers, highlighting past growth alongside future expectations can build credibility. Farmers and investors alike prefer industries that show consistent upward trends. It underscores that farm equipment is a strong market to bet on.
Farm Equipment Marketing Statistics #6: Asia-Pacific Held 37.7% Share Of Global Market In 2024
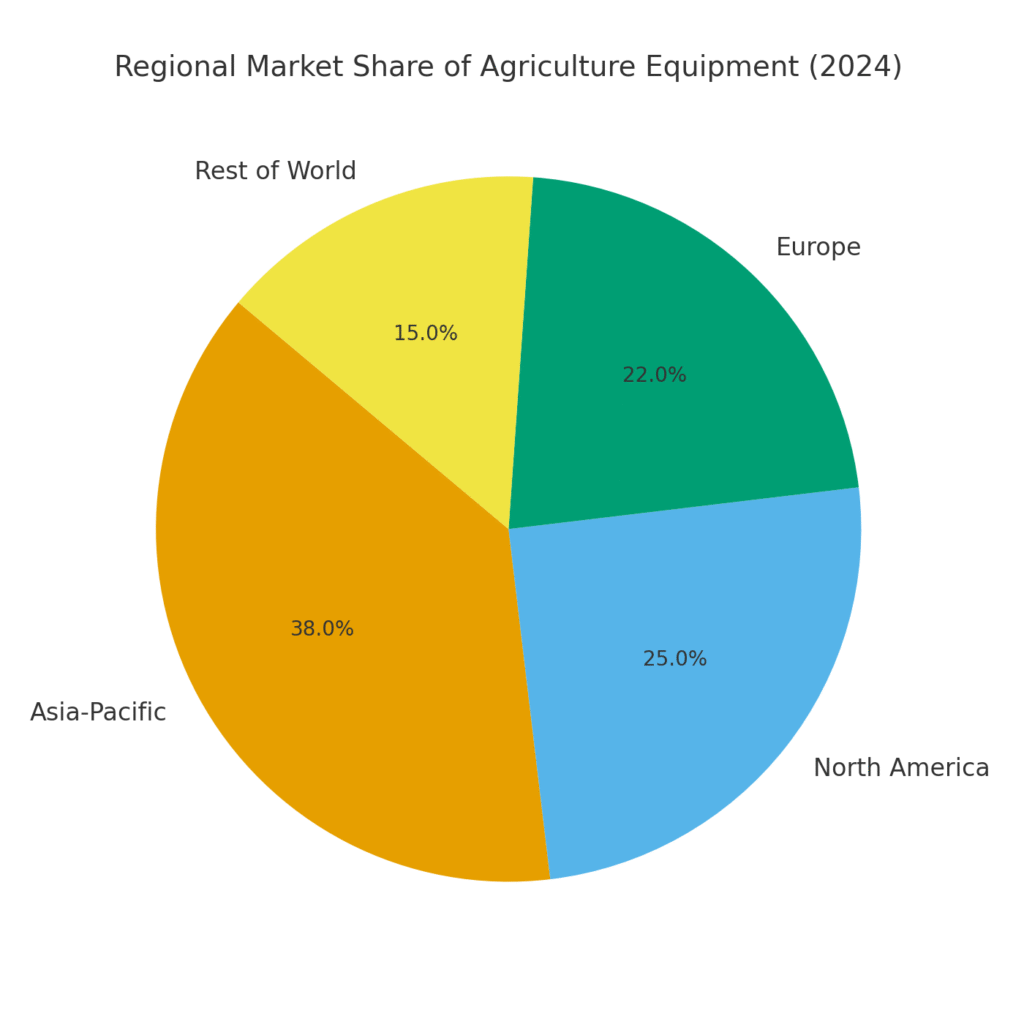
Asia-Pacific accounted for 37.7% of global revenues in 2024, making it the region to watch. This dominance stems from large farming populations and rapid adoption of modern equipment. Marketers should prioritize campaigns tailored to this region’s cultural and economic contexts. Financing solutions and after-sales services will likely appeal here. The stat clearly identifies Asia-Pacific as a key driver of growth.
Farm Equipment Marketing Statistics #7: Asia-Pacific Dominated With 39.24% Share In 2024
A separate study showed Asia-Pacific commanding 39.24% of the market in 2024. While close to the earlier figure, this reinforces the region’s global leadership. For marketing teams, consistency across reports builds trust in decision-making. It also highlights the importance of targeting local farmers and distributors. Companies that localize effectively will capture the lion’s share of this growing demand.
Farm Equipment Marketing Statistics #8: U.S. Market Valued At USD 30.2 Billion In 2025
The U.S. agricultural equipment market is expected to be worth USD 30.2 billion in 2025. With projections reaching USD 41.4 billion by 2030, growth is strong. Marketers in the U.S. should stress innovation and technology since American farmers value efficiency. Financing and leasing models also play a big role in this market. This stat helps identify the U.S. as another vital growth hub.
Farm Equipment Marketing Statistics #9: Tractors Held 34.9% Share Of Global Equipment Market
Tractors represented 34.9% of the global market in 2024. This makes them the most significant product type in farm equipment. Marketers should prioritize tractor campaigns to maximize impact. Highlighting productivity, fuel efficiency, and reliability will resonate strongly with buyers. Tractors continue to symbolize the backbone of modern farming.
Farm Equipment Marketing Statistics #10: Livestock Equipment Segment Valued At USD 22.75 Billion In 2024
The livestock farm equipment segment was valued at USD 22.75 billion in 2024. It’s projected to grow steadily over the next decade. This highlights the importance of diversifying marketing beyond crop-focused equipment. Brands targeting livestock farmers can carve out a strong niche. It shows how specialized equipment is becoming increasingly valuable.
Farm Equipment Marketing Statistics #11: Average Price Of 200-HP Tractors Rose 287% Since 1990
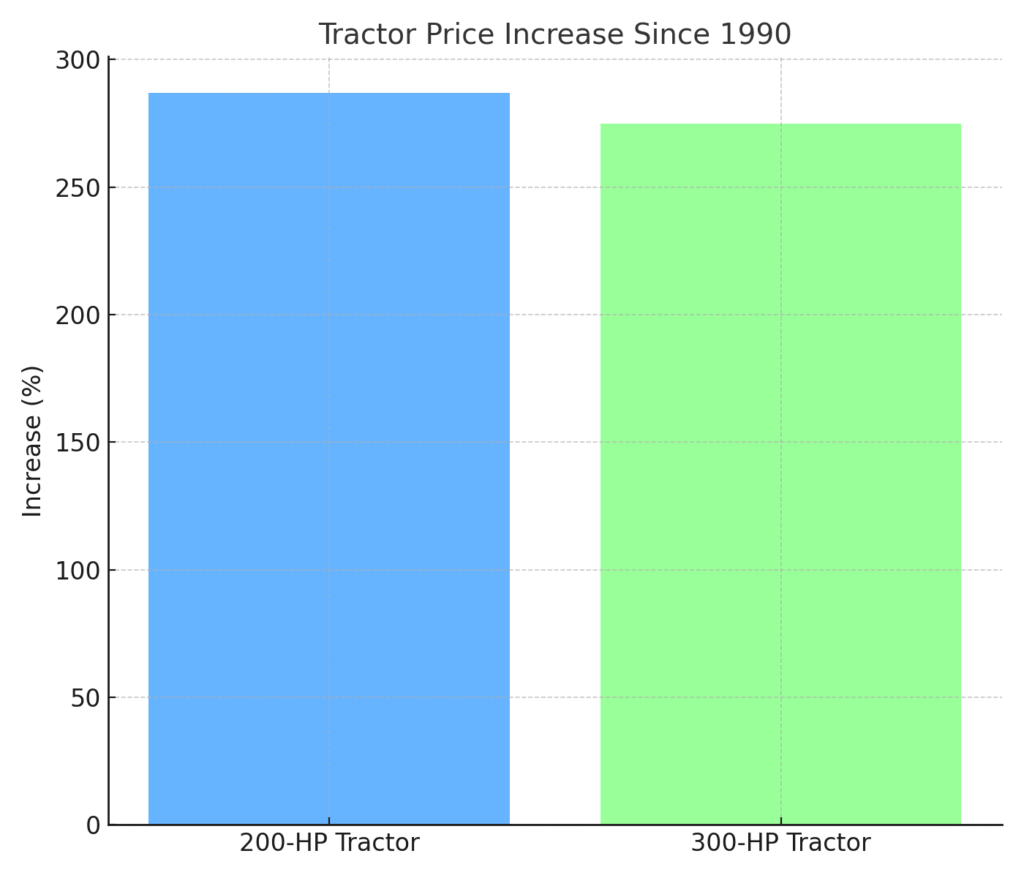
Since 1990, the price of a 200-horsepower tractor has jumped 287%. This massive increase outpaces inflation, showing affordability challenges. Marketers need to focus on value-for-money narratives in their campaigns. Financing options and trade-in programs can ease the burden for farmers. Rising costs mean ROI messaging is more crucial than ever.
Farm Equipment Marketing Statistics #12: High Equipment Cost And Labor Shortage Are Major Restraints
The industry faces restraints due to high machinery costs and labor shortages. These challenges impact adoption rates in certain markets. For marketers, the opportunity lies in promoting automation as a solution. Messaging around efficiency and reduced labor reliance will resonate. This stat highlights the dual challenge of cost and workforce limitations.
Farm Equipment Marketing Statistics #13: Growing Demand For Precision Agriculture Technologies
Farmers are increasingly adopting precision agriculture technologies. These tools help optimize yields, reduce waste, and cut costs. Marketing efforts can focus on showcasing how precision tools deliver measurable benefits. Digital campaigns should emphasize ROI through data-driven examples. This stat shows the modern farmer’s shift toward technology adoption.
Farm Equipment Marketing Statistics #14: Global Demand Forecast To Grow 3.6% Per Year
Demand for agricultural equipment is expected to rise 3.6% annually, hitting USD 216 billion by 2028. This moderate growth rate reflects a stable market environment. Marketers can position their products as part of this steady upward climb. It reassures customers that investment in equipment aligns with long-term industry health. Consistency is a strong selling point in agricultural markets.
Farm Equipment Marketing Statistics #15: U.S. Irrigation Machinery Projected To Grow At CAGR 9.4%
Irrigation machinery in the U.S. is projected to see the fastest growth, with a CAGR of 9.4%. This makes it one of the most promising segments. Marketers should highlight water-saving benefits and sustainability. Farmers concerned about climate change will find this messaging persuasive. The stat shows how environmental challenges are shaping demand.
Farm Equipment Marketing Statistics #16: Farmers Increasingly Renting Equipment Instead Of Buying
Many farmers are choosing to rent equipment rather than buy outright. This trend reflects financial caution amid uncertain incomes. Marketers can adapt by promoting rental and leasing services. Campaigns that highlight flexibility and affordability will attract attention. This stat reveals how customer preferences are shifting.
Farm Equipment Marketing Statistics #17: Manufacturers Investing Heavily In Autonomous Machinery
Equipment manufacturers are investing heavily in autonomous solutions. Autonomous tractors and harvesters are becoming more mainstream. Marketers should emphasize innovation and cutting-edge features. Farmers facing labor shortages will find automation particularly appealing. This stat proves that the future of farming lies in smart machines.
Farm Equipment Marketing Statistics #18: Google Search Interest For Farm Brands Hit Historic Low
In May 2025, Google searches for farm equipment brands hit their lowest point since 2006. This signals possible weakening interest or delayed purchasing decisions. Marketers may need to invest more in awareness campaigns. Building trust and visibility online is now critical. The stat warns businesses not to underestimate digital presence.
Farm Equipment Marketing Statistics #19: Rising Costs Make ROI And Fuel Efficiency Key Marketing Points
With costs rising, ROI and fuel efficiency are the top concerns for farmers. Marketing should focus on long-term value rather than upfront costs. Case studies and testimonials can strengthen these campaigns. Farmers want proof that their investment will pay off. This stat underscores the importance of strategic messaging.
Farm Equipment Marketing Statistics #20: Asia-Pacific Seen As Highest-Return Region For Marketing Efforts
Asia-Pacific is expected to deliver the highest return for marketing investments. The region’s dominance makes it the most lucrative target. Brands that localize campaigns will benefit most. Highlighting financing, durability, and service support is key. This stat shows that global strategies must give Asia-Pacific priority.
Why These Insights Matter
After going through these farm equipment marketing statistics, I feel more convinced than ever that numbers tell a story worth listening to. They remind me that even in industries as traditional as farming, innovation and data are shaping the future at a rapid pace. For me, the biggest takeaway is how vital it is to position marketing strategies where growth is strongest — like Asia-Pacific and precision agriculture technologies. As someone who spends a lot of time helping businesses find their edge, I believe these insights can be the difference between staying relevant or being left behind. If you’ve read this far, I’d love to know what stat stood out to you the most — because it’s through these conversations that we truly turn data into action.
SOURCES