



19 Sep TOP 20 FEED MARKETING STATISTICS 2025
When I first started diving into the world of digital advertising, I realized just how powerful the feeds we scroll through every day can be. That’s why I’ve put together these feed marketing statistics—to give you a clear picture of where the industry stands and where it’s heading. As someone who works closely with a leading marketing agency in New York, I’ve seen firsthand how businesses are reshaping their strategies to meet consumers right where they spend their time: in their social and content feeds. My goal here isn’t to throw numbers at you, but to share insights you can actually use to make smarter, more human-centered marketing decisions.
Top 20 Feed Marketing Statistics 2025 (Editor’s Choice)
📊 Top 20 Feed Marketing Statistics 2025
Essential Data-Driven Insights for Social Media Success
| Rank | Category | Key Statistic | Description & Impact |
|---|---|---|---|
1 |
🌍 Global Reach |
5.42 Billion Users |
Total social media users worldwide in 2025, averaging 6.83 different networks per month per user |
2 |
🛒 Product Discovery |
61% Use Instagram |
Social users turn to Instagram to find their next purchase, making it the top platform for product discovery |
3 |
📱 Instagram Dominance |
2 Billion MAU |
Instagram monthly active users with 84% of social users having an Instagram profile (highest of all networks) |
4 |
⏱️ TikTok Engagement |
47.3 Minutes Daily |
Average daily time spent on TikTok with 2.65 billion monthly visits as of January 2025 |
5 |
🤝 Brand Interaction |
50% Daily Interaction |
Instagram users interact with brands at least once daily, creating significant engagement opportunities |
6 |
🎯 Content Preference |
69% Most Engaging |
Social users see the most engaging brand content on Instagram, with 44% wishing brands used it more |
7 |
📈 Platform Comparison |
7.5% vs 3.65% |
TikTok smaller creators achieve higher engagement rates compared to Instagram creators |
8 |
💬 Engagement Benchmarks |
1.4% - 2.8% Rate |
Average social media engagement rate range across platforms, varying by platform and content type |
9 |
🎬 Video Dominance |
90% Internet Traffic |
Short-form video projected to account for 90% of all internet traffic in 2025 |
10 |
📚 Learning Preference |
78% Prefer Video |
People prefer to learn about new products/services via short video content over other formats |
11 |
💰 ROI Champion |
21% Highest ROI |
Marketers report short-form videos bring the highest ROI compared to any other content type |
12 |
📊 Market Growth |
$140.18 Billion |
Global digital video advertising market growth from $104.65B in 2024 to $140.18B in 2025 |
13 |
🤖 AI Revolution |
86% Growth |
AI adoption for text creation skyrocketed with 86% growth between 2023-2024 |
14 |
⚡ AI Implementation |
75% Plan to Use |
Social marketers plan to implement generative AI tools for better customer experiences |
15 |
⏰ Efficiency Gains |
90% Time Savings |
Businesses using GenAI for social content report moderate to significant time savings |
16 |
💸 Ad Spend Projection |
$276.7 Billion |
Social media advertising spend in 2025, with 83% generated on mobile by 2030 |
17 |
📺 Feed Revenue |
53.7% of Revenue |
Instagram Feed represents majority of ad revenue, with Stories at 24.6% |
18 |
🎯 Acquisition Channel |
83% Primary Channel |
Marketers say social media has become their primary customer acquisition channel |
19 |
🔍 Business Discovery |
58% Discover Brands |
Consumers discover new businesses via social media, outperforming traditional search and TV |
20 |
⚡ Response Expectations |
79% Expect 24hr |
Consumers expect response within 24 hours, showing importance of fast, attentive engagement |
Top 20 Feed Marketing Statistics 2025
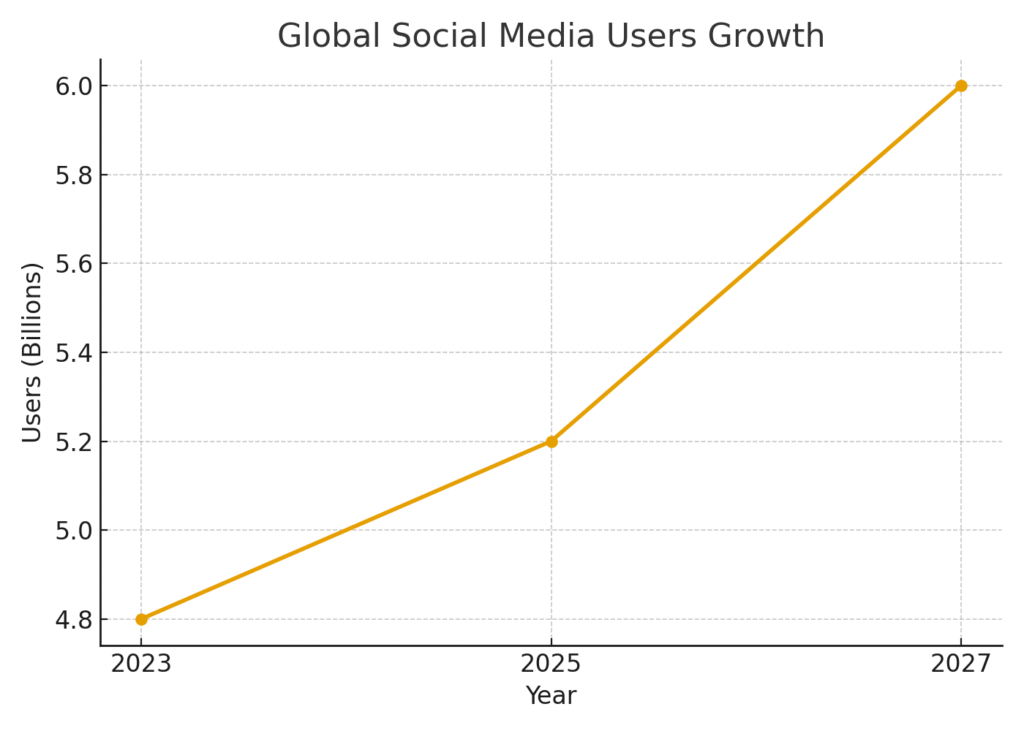
Feed Marketing Statistics #1: Global Social Media Usage Reaches 5.07–5.24 Billion
The number of global social media users has grown to over 5 billion, which is nearly two-thirds of the world’s population. This massive audience makes social feeds one of the most powerful marketing channels available today. As a marketer, I see this as both an opportunity and a challenge—standing out in such a crowded space requires strategy. It also highlights the importance of meeting people where they are most active. Feed marketing strategies that tap into this user base can truly shape brand visibility worldwide.
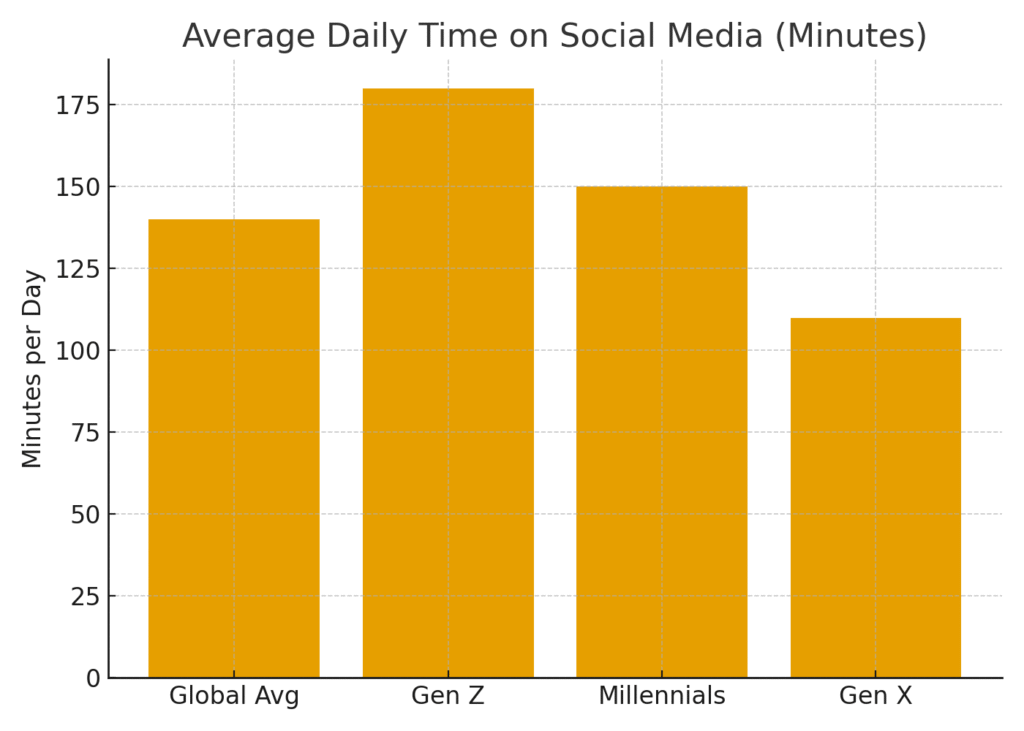
Feed Marketing Statistics #2: Average Daily Time Spent Is 2 Hours 20 Minutes
People spend about 2 hours and 20 minutes daily on social media, often scrolling through their feeds. This means brands have an extended window to capture attention if they position content wisely. Personally, I think this emphasizes the value of creating content that blends into a user’s daily experience. The more seamless the content feels in their feed, the more likely it is to engage. Every minute spent on feeds is a chance for a brand to build awareness.
Feed Marketing Statistics #3: Mobile Accounts For 80% Of Social Activity
With 80% of social media activity happening on mobile, feed marketing must be optimized for smaller screens. I’ve noticed that visuals, captions, and even ad placements need to feel natural on mobile devices. This shift forces brands to design “thumb-stopping” content that grabs attention instantly. It also underscores why mobile-first design is no longer optional—it’s critical. Feeds today are practically mobile-native, and marketers must respect that behavior.
Feed Marketing Statistics #4: Over 70% Of Businesses Use Social Media Marketing
More than 70% of businesses are now using feeds as a marketing channel. To me, this shows just how mainstream and competitive social media has become. Standing out requires creativity, consistency, and a unique brand voice. Businesses that ignore feeds risk losing visibility in a space where competitors are thriving. Feed marketing has shifted from an option to an expectation.
Feed Marketing Statistics #5: Global Ad Spend Will Hit $200 Billion
Social media advertising spend is projected to hit $200 billion worldwide. This investment reflects how valuable feed-based marketing is to brands across industries. I see this as proof that companies are doubling down on the ROI of feed ads. However, it also means the competition is fierce, and costs may rise for ad placements. Crafting authentic, resonant content is how brands can maximize returns in such a crowded market.
Feed Marketing Statistics #6: 58% Discover New Businesses On Social Media
Around 58% of consumers say they first discover new businesses through social feeds. That’s powerful—feeds are now the digital storefront for many brands. Personally, I think this highlights the importance of a consistent and engaging presence. Brands that showcase their value early in the feed win mindshare. Discovery today isn’t just about search—it’s about being present in the right scroll at the right time.
Feed Marketing Statistics #7: 78% Research Brands Before Purchase
Nearly 78% of shoppers research brands on social feeds before purchasing. To me, this signals that trust-building happens directly in the feed. People want reviews, testimonials, and authentic stories before they buy. This means marketers must prioritize transparency and credibility in their feed content. A well-managed feed can tip the decision from hesitation to confident purchase.
Feed Marketing Statistics #8: 79% Expect Response Within 24 Hours
Consumers expect brands to respond to their social messages within 24 hours. From my perspective, this expectation transforms feeds into customer service hubs as well as marketing spaces. Quick responses foster trust and deepen relationships. The challenge is scaling responsiveness while staying personal. Brands that meet this demand stand out as truly customer-focused.
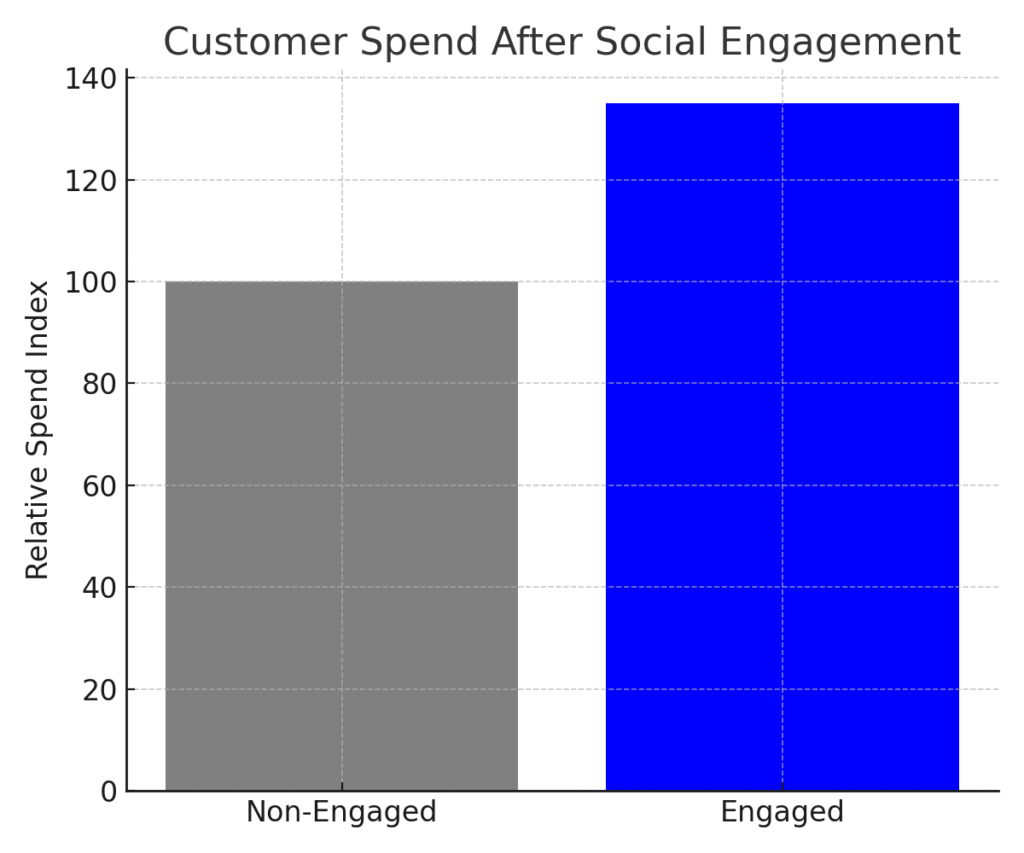
Feed Marketing Statistics #9: Customers Spend 35–40% More After Engagement
Customers who interact with a brand’s feed spend 35–40% more on purchases. I think this stat reveals just how valuable engagement really is. It’s not just about likes and comments—it translates directly to sales. Meaningful conversations in the feed create loyalty that drives revenue. Engagement is no longer a vanity metric; it’s a business driver.
Feed Marketing Statistics #10: 76% Recommend After Positive Experience
About 76% of consumers recommend brands after positive feed interactions. Word-of-mouth has always been powerful, but now it happens in feeds instantly. As a marketer, I love how this makes social proof more visible than ever. Every positive comment, share, or tag acts as a mini-testimonial. Building positive interactions should be every brand’s priority.
Feed Marketing Statistics #11: UGC Boosts Engagement By 20%
User-generated content in feeds can increase engagement by 20%. Personally, I find this exciting because it puts the customer at the center of the brand story. When people see others like them sharing experiences, it feels real. Feeds thrive on authenticity, and UGC provides just that. Encouraging customers to contribute is a win-win strategy.
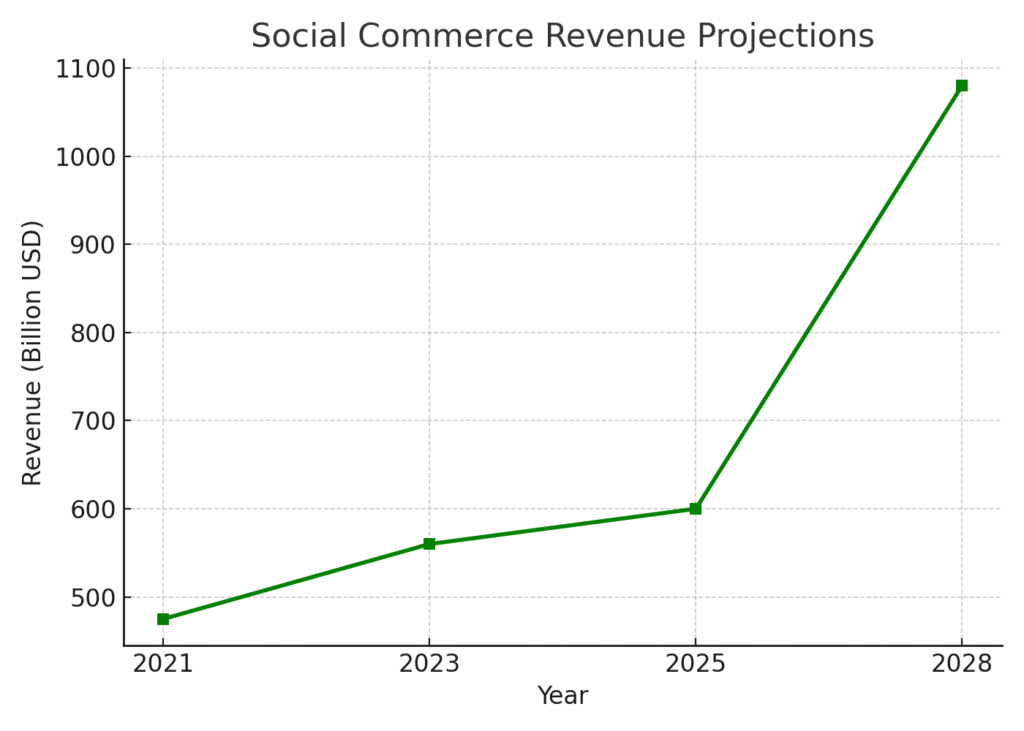
Feed Marketing Statistics #12: Social Commerce To Exceed $600 Billion
Social commerce sales are expected to exceed $600 billion in 2025. That’s an astonishing figure that shows how feeds are becoming shopping destinations. To me, this blurs the line between discovery and purchase. With one click in a feed, customers move from interest to checkout. Brands must design feeds with seamless purchase pathways in mind.
Feed Marketing Statistics #13: Projected Revenue To Reach $1.08 Trillion By 2028
By 2028, social commerce revenue may reach $1.08 trillion. This long-term projection tells me feed marketing isn’t a trend—it’s the future. Feeds are becoming digital marketplaces where trust and convenience meet. For marketers, this is a call to invest early and innovate constantly. The brands that adapt now will lead tomorrow’s trillion-dollar landscape.
Feed Marketing Statistics #14: 90% Of Small Businesses Use Social Media
About 90% of small businesses incorporate feeds into their marketing. I’ve seen how this levels the playing field, giving smaller players visibility alongside global brands. Feeds allow storytelling without massive budgets. It’s inspiring to see how creativity can outperform size. For small businesses, feed marketing is a lifeline to growth.
Feed Marketing Statistics #15: 92% Of Marketers Report Increased Exposure
Roughly 92% of marketers say feeds increased their brand’s exposure. This makes sense—social feeds are where people spend their daily attention. I personally think of feeds as digital billboards with targeting power. Brands get noticed faster and by the right people. It’s proof that feed marketing is one of the most efficient awareness tools available.
Feed Marketing Statistics #16: Nearly 1 Billion More Users Expected By 2027
Social media is projected to add nearly 1 billion more users by 2027. This growth means feeds will only get more influential. As a marketer, I see this as a reminder to stay adaptable. Every new user is another potential customer to connect with. The future of feed marketing is about scalability and personalization.
Feed Marketing Statistics #17: 70% Say Algorithms Shape Strategy
Over 70% of marketers admit algorithm changes shape their feed strategies. Personally, I’ve felt this firsthand—one tweak can impact reach dramatically. It forces constant learning and flexibility. Feeds aren’t static; they evolve with platforms. Marketers who adapt fastest thrive the most.
Feed Marketing Statistics #18: 78% Prefer Short Video Content
About 78% of consumers prefer learning through short videos in their feeds. To me, this highlights why TikTok and Reels are exploding in popularity. Short-form video feels digestible and engaging. Brands that master storytelling in under a minute will dominate feeds. Video-first strategies are no longer optional—they’re essential.
Feed Marketing Statistics #19: 72% Say Feeds Build Deeper Brand Connections
Roughly 72% of people feel feeds help them connect with brands on a deeper level. I believe this comes from the conversational nature of social media. Unlike traditional ads, feeds let brands talk with—not at—their audience. This back-and-forth builds trust over time. Feeds are becoming digital communities as much as marketing channels.
Feed Marketing Statistics #20: 63% Plan Visits After Positive Interaction
About 63% of consumers plan to visit a business after a positive feed interaction. This shows that digital touchpoints influence offline behavior. I love how a simple comment or like can translate into real-world foot traffic. It proves feeds aren’t just for clicks—they drive real action. For local businesses, this is especially powerful.
Looking back at these feed marketing statistics, I can’t help but feel inspired by how quickly this space continues to evolve. The way people interact with brands in their feeds is becoming less about interruption and more about connection—and that’s something I personally value. For me, it’s not just about campaigns or conversions, but about building real trust with the audiences we serve. I hope these insights give you the same sense of possibility they give me, and maybe even spark some new ideas for your own work. After all, the feed isn’t just where content lives—it’s where relationships begin.
SOURCES
- https://socialmediatoday.com/news/digital-marketing-statistics-2025-h1-by-the-numbers/752547/ Social Media Today