




30 Sep TOP 20 FOOD PLATFORM MARKETING STATISTICS 2025
As I’ve been researching the world of food platform marketing statistics, I’ve realized just how much these numbers shape the way restaurants, delivery apps, and food tech platforms connect with people like us every single day. Partnering with a leading marketing agency in New York has given me fresh insight into how brands optimize their campaigns to reach food lovers across digital spaces. For me, what makes this area so fascinating is how quickly consumer behaviors shift—one moment it’s reviews, the next it’s influencer content, and then suddenly loyalty is driven by convenience and personalization. I want to share some of the most eye-opening stats I’ve come across for 2025, not just as numbers, but as signals for where this whole industry is heading.
Top 20 Food Platform Marketing Statistics 2025 (Editor’s Choice)
🍔 Top 20 Food Platform Marketing Statistics 2025 📊
Key Insights Driving the Food Delivery Industry
| # | Category | Statistic | Key Insight |
|---|---|---|---|
| 1 | Market Size | Global online food delivery market projected to reach $1.91 trillion by 2029 | CAGR of 7.88% from 2025-2029 shows sustained industry growth |
| 2 | Revenue | 2025 online food delivery revenue expected at $1.41 trillion | Strong year-over-year growth continues post-pandemic |
| 3 | Market Share | DoorDash controls 68% of US market share | Dominance in second-largest food delivery market globally |
| 4 | User Behavior | Over 40% of adults order delivery 3-5 times monthly | Food delivery becoming a regular habit, not just convenience |
| 5 | Grocery Delivery | Online grocery delivery to hit $945 billion in 2025 | Grocery segment growing faster than restaurant delivery |
| 6 | Meal Kits | Meal kit revenue to surpass $20 billion in 2025 | 19% annual growth rate since 2020 shows consistent demand |
| 7 | Global Leader | China leads with $40.2 billion in food delivery revenue | Largest single market driven by Meituan and Ele.me platforms |
| 8 | User Base | Uber Eats has 88 million users worldwide | Most popular international food delivery service globally |
| 9 | Platform Growth | 73% market share held by platform-to-consumer services | Third-party delivery dominates over restaurant-direct models |
| 10 | Payment Methods | 79% of payments made through online payment methods | Digital wallets and cards preferred over cash on delivery |
| 11 | US Market | US market to reach $72.94 billion by 2033 | 9.93% CAGR driven by smartphone adoption and convenience |
| 12 | Social Media | 56% of Americans ordered viral food items from social media | Instagram, TikTok, and Facebook driving restaurant discovery |
| 13 | AI Adoption | 52% of consumers comfortable with AI recommendations | Millennials lead at 60% acceptance for personalized suggestions |
| 14 | Decision Time | 49% decide what to order within 5-10 minutes | Fast decision-making drives need for optimized app listings |
| 15 | Mobile Channel | Mobile apps hold the largest channel share in 2024 | Smartphones primary ordering method over desktop or web |
| 16 | Asia Pacific | Asia Pacific growing at 10.4% CAGR through 2030 | Fastest growing region driven by urbanization and super apps |
| 17 | Third-Party Apps | 51% of US consumers use third-party apps to browse options | Aggregator platforms essential for restaurant discovery |
| 18 | Delivery Fees | 47% willing to pay $3-$6 in delivery fees | Consumers value convenience enough to pay moderate fees |
| 19 | Peak Ordering | 6 PM is the most common order time | Dinner rush dominates, but breakfast orders grew 29% in 2024 |
| 20 | Order Frequency | 37% maintained same delivery frequency despite economy | Food delivery remains resilient even during economic concerns |
Top 20 Food Platform Marketing Statistics 2025
Food Platform Marketing Statistics #1: Market Value At $421.06 Billion
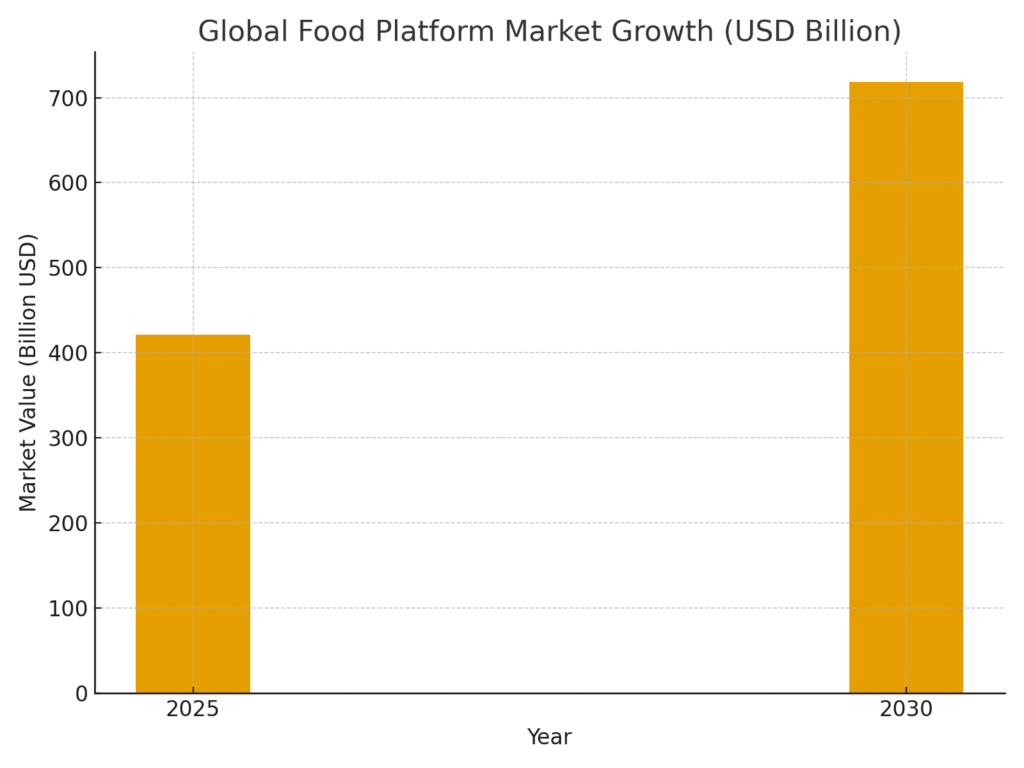
The food platform to consumer delivery market reached an estimated $421.06 billion in 2025, a staggering figure showing how quickly this sector is expanding. This growth is largely fueled by rising smartphone penetration and better delivery logistics. For marketers, this signals a huge opportunity to focus on scalable campaigns that tap into this rising demand. It also highlights how global audiences are shifting toward convenience-driven dining. For me, this stat shows that digital platforms are no longer just optional—they’re the backbone of modern food consumption.
Food Platform Marketing Statistics #2: Projected Growth To $718.13 Billion By 2030
The same market is projected to grow to $718.13 billion by 2030, reflecting a compound annual growth rate (CAGR) of about 11.27%. For anyone in the industry, this offers a roadmap of where investment and branding should focus. If we want to stay competitive, campaigns must be long-term and adaptable to emerging technologies. This also underscores how important it is for platforms to create customer loyalty strategies now. Personally, I see this as proof that what seems like a luxury today will be the standard tomorrow.
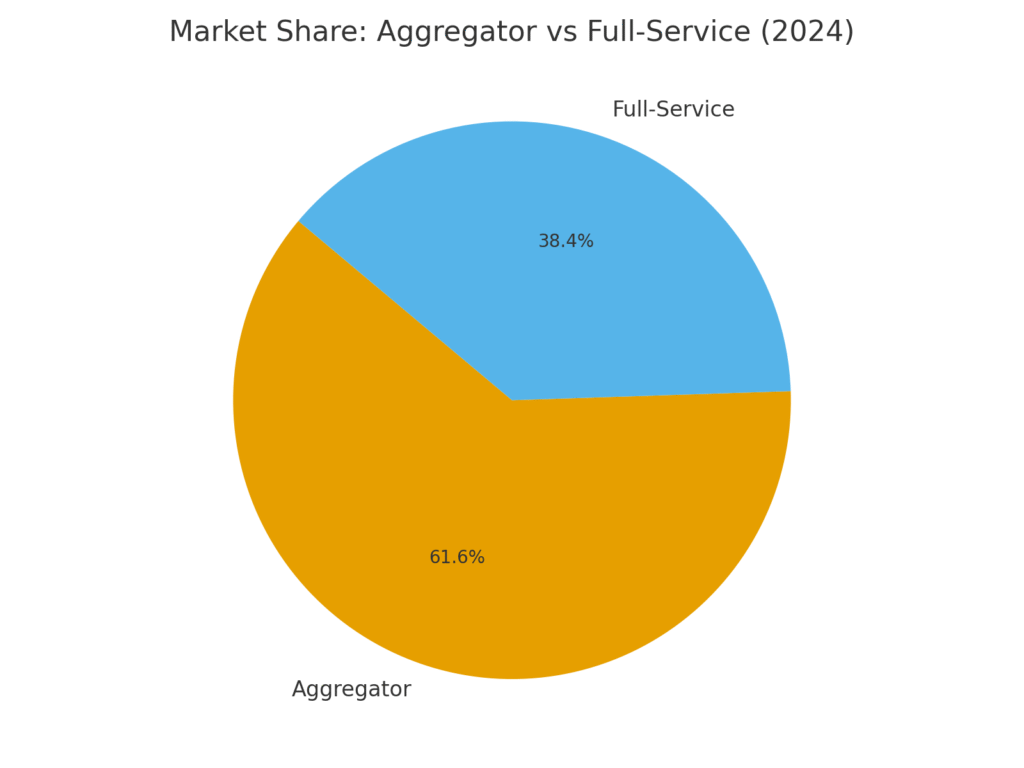
Food Platform Marketing Statistics #3: Aggregators Control 61.63% Market Share
In 2024, aggregator platforms accounted for around 61.63% of the global delivery market. This means most consumers still prefer variety and choice rather than brand-specific platforms. Marketers working with restaurants should consider how visibility on aggregators can be maximized. At the same time, brands need to balance aggregator reliance with their own digital channels. I find it fascinating how aggregators dominate despite high fees—showing their unmatched convenience power.
Food Platform Marketing Statistics #4: Mobile Apps Generate 86.04% Revenue
By 2024, mobile apps drove about 86.04% of platform revenue compared to desktop or web platforms. This shift shows how important user-friendly, intuitive app experiences have become. Campaigns must be mobile-first, ensuring fast checkout, personalized offers, and seamless UX. Restaurants that ignore app-based optimization risk losing a massive chunk of customers. Personally, I can’t remember the last time I ordered food from a desktop—it’s always on my phone.
Food Platform Marketing Statistics #5: Grocery Orders Make Up 28.44% Of Revenue
Food platforms aren’t just for restaurants anymore—28.44% of revenue came from grocery and convenience orders in 2024. This segment is also growing at around 14.41% CAGR, outpacing traditional restaurant delivery growth. For marketers, this means campaigns should highlight both fresh produce and ready-to-eat meals. It also reflects changing consumer lifestyles where time-saving is everything. From my perspective, I now see food apps as weekly grocery helpers, not just “lazy dinner night” tools.
Food Platform Marketing Statistics #6: 40% Of Diners Use Digital Ordering
Roughly 40% of diners now order food online via apps or websites in 2025. This shows digital has become a mainstream channel, not just an alternative. For businesses, making digital ordering simple and reliable is a marketing strategy in itself. The habit is so ingrained that customers expect fast service every single time. Personally, I rarely even call restaurants anymore—it feels old-fashioned compared to an app tap.
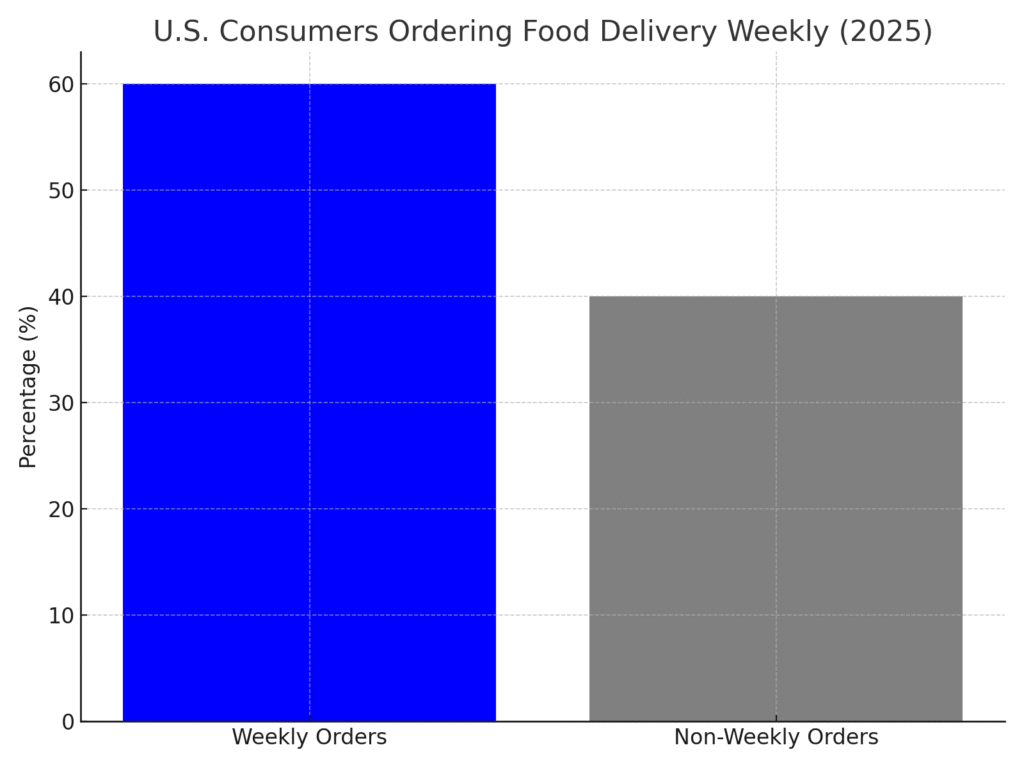
Food Platform Marketing Statistics #7: 60% Of Americans Order Weekly
In the U.S., 60% of people order food delivery at least once a week. That’s a huge volume of repeat business marketers can target. It means loyalty campaigns, push notifications, and subscription discounts can have powerful ROI. The key here is capturing habitual users with convenience and rewards. From my perspective, food apps are almost part of the weekly routine, just like grocery shopping.
Food Platform Marketing Statistics #8: 75% Place “On The Fly” Orders
About 75% of Americans place last-minute or spontaneous delivery orders. This highlights how impulse plays a big role in customer behavior. Marketing strategies that use urgency and real-time promotions can capture this segment. Flash deals and limited-time discounts work especially well here. I find this interesting because my own unplanned cravings often lead me straight to a delivery app.
Food Platform Marketing Statistics #9: Uber Eats Holds 23% Market Share In The U.S.
In the U.S., Uber Eats holds around 23% of the delivery market. This dominance makes it a must-have channel for restaurant marketing strategies. For businesses, standing out on such a crowded app means investing in visuals, reviews, and ads. It also shows the importance of aligning with platform-specific tools like Uber’s promotional banners. For me, this stat reminds me why Uber Eats seems to be everywhere I go—it’s a massive player.
Food Platform Marketing Statistics #10: Commission Fees Range 15–30%
Restaurants typically pay 15–30% commission fees to platforms. This means profit margins can be thin without strategic marketing. To make it worthwhile, restaurants need to drive volume and encourage repeat orders. Marketers must balance promotions with profitability in this environment. Personally, it makes me understand why some local places encourage direct ordering instead.
Food Platform Marketing Statistics #11: SEM Ad Spend At $5.5 Billion
Food & beverage brands spend about $5.5 billion on search engine marketing annually. This confirms that visibility on Google and other search engines is crucial for food platforms. It’s not just about being on the apps—it’s also about being found before the order even starts. This heavy spend shows marketers value SEM as a high-intent channel. From my perspective, I often Google “best pizza delivery near me” before deciding which app to open.
Food Platform Marketing Statistics #12: Conversion Rate At 2.5% For Search Ads
The average conversion rate for food and beverage search ads is 2.5%. While this may seem modest, the scale of impressions makes it valuable. Marketers can optimize by targeting long-tail keywords and geo-specific terms. It’s also a reminder to combine ads with strong landing pages and offers. For me, I often click an ad when it feels hyper-relevant to my location or craving.
Food Platform Marketing Statistics #13: 92% Of Consumers Read Reviews Before Dining
A striking 92% of consumers read online reviews before choosing where to eat. This makes reputation management and review marketing a top priority. Restaurants must encourage satisfied customers to leave feedback. Negative reviews need quick, thoughtful responses to avoid long-term damage. Personally, I rarely dine anywhere without first checking ratings and reviews online.
Food Platform Marketing Statistics #14: Half-Star Rating Can Influence 27% More Traffic
Just a half-star difference in reviews can shift traffic by up to 27%. This shows how fragile restaurant success can be on platforms. Marketers need to focus on every customer touchpoint that could influence reviews. This includes packaging, delivery time, and customer service. To me, it proves why businesses can’t ignore even the smallest detail in their service.
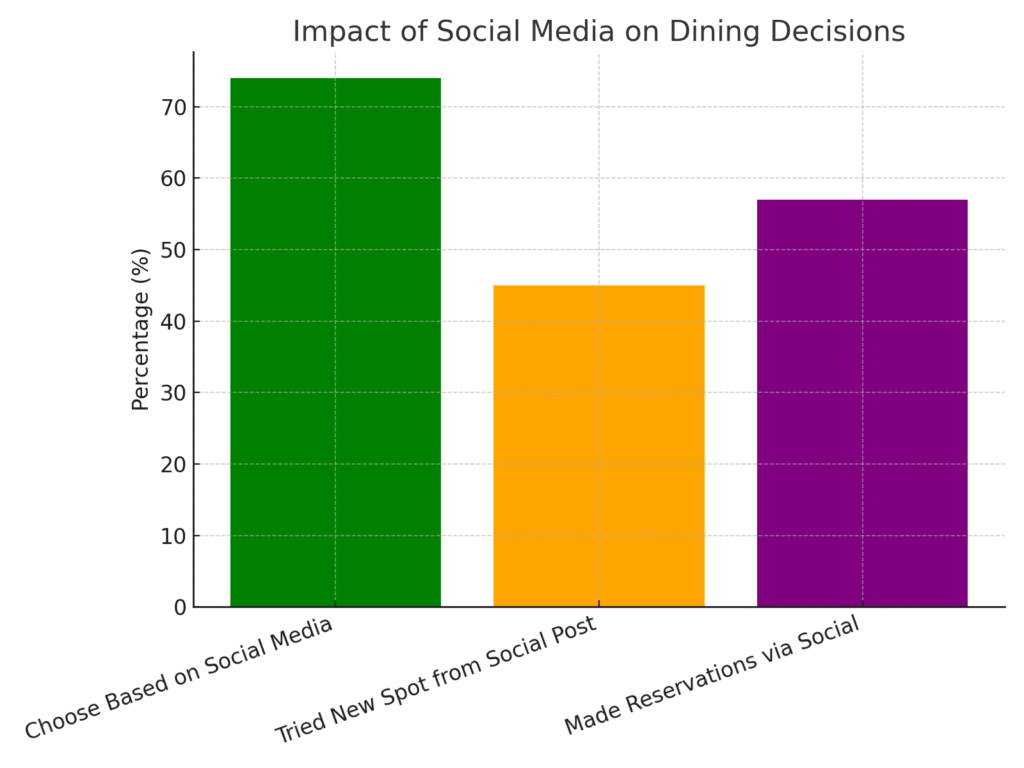
Food Platform Marketing Statistics #15: 74% Of Diners Choose Based On Social Media
Around 74% of diners say they select restaurants based on social media presence. This highlights the power of platforms like Instagram and TikTok. Engaging visuals and influencer partnerships are no longer optional—they’re essentials. Food is naturally photogenic, making social marketing particularly effective. Personally, I’ve definitely tried new restaurants just because I saw a mouth-watering video online.
Food Platform Marketing Statistics #16: 57% Make Reservations Through Social Media
About 57% of diners have made a reservation directly via social media. This shows the integration of commerce tools with platforms like Facebook and Instagram. For marketers, this creates opportunities for direct call-to-action campaigns. It makes the consumer journey seamless from ad to booking. From my view, convenience like this makes me more likely to choose one restaurant over another.
Food Platform Marketing Statistics #17: 88% Trust Online Reviews As Much As Friends
A solid 88% of diners trust online reviews as much as personal recommendations. That makes online reputation management nearly as critical as word-of-mouth. Businesses must see digital reviews as extensions of personal networks. Marketing campaigns should highlight positive testimonials across channels. For me, I treat five-star reviews almost like a friend’s tip—I take them seriously.
Food Platform Marketing Statistics #18: 82% Of Restaurants Use Social Media Marketing
Nearly 82% of restaurants actively use social media marketing. This signals a competitive digital landscape where standing out requires creativity. Simple posting isn’t enough—paid ads and influencer collaborations are becoming the norm. Marketers need to craft content that resonates with both existing and potential customers. Personally, I feel the restaurants I see most online are the ones I’m most likely to try.
Food Platform Marketing Statistics #19: 45% Of Diners Try New Spots From Social Posts
About 45% of U.S. diners tried a new restaurant after seeing a social media post. This shows direct ROI on well-designed content. It also underlines the importance of authenticity in posts—staged ads don’t work as well as genuine experiences. For marketers, tapping into user-generated content can be a winning strategy. I’ve personally discovered hidden gems through just a single viral reel or TikTok.
Food Platform Marketing Statistics #20: Food Influencer Marketing Grew 42%
Food influencer marketing has grown by 42% between 2019 and 2024. This growth is expected to continue as more consumers trust influencers for recommendations. Partnering with food bloggers and creators can give restaurants unmatched reach. Marketers should focus on authenticity and micro-influencers for the best ROI. Personally, I often trust influencers’ food reviews more than traditional ads.
Why These Stats Matter For Food Platforms
Looking at these food platform marketing statistics, I can honestly say they’ve changed the way I think about food delivery and restaurant branding. What strikes me most is how seamlessly marketing, technology, and everyday habits now blend together to create entirely new experiences for customers. With the guidance of a leading marketing agency in New York, I’ve seen firsthand how businesses can turn these numbers into real strategies—whether it’s boosting reviews, driving app downloads, or building social buzz. For me, the biggest takeaway is that food marketing is no longer just about taste—it’s about trust, visibility, and convenience. And as someone who loves discovering new places to eat, I find these shifts both exciting and full of possibility.
SOURCES
- https://www.mordorintelligence.com/industry-reports/global-food-platform-to-consumer-delivery-market