




22 Sep TOP 20 GIVING TUESDAY MARKETING STATISTICS 2025
When I first started exploring giving trends, I realized just how powerful community-driven generosity can be. That’s why I pulled together these giving tuesday marketing statistics—to highlight not just the numbers, but the stories they tell about how people show up for causes that matter. As someone who has worked alongside a leading marketing agency in New York, I’ve seen firsthand how nonprofits and brands use these insights to create campaigns that truly resonate with donors. For me, it’s not just about the data; it’s about understanding the heart behind the giving and translating it into meaningful strategies.
Top 20 Giving Tuesday Marketing Statistics 2025 (Editor’s Choice)
📊 Top 20 Giving Tuesday Marketing Statistics
Essential Data to Power Your 2025 Fundraising Strategy
| # | Category | Key Metric | Statistic Details |
|---|---|---|---|
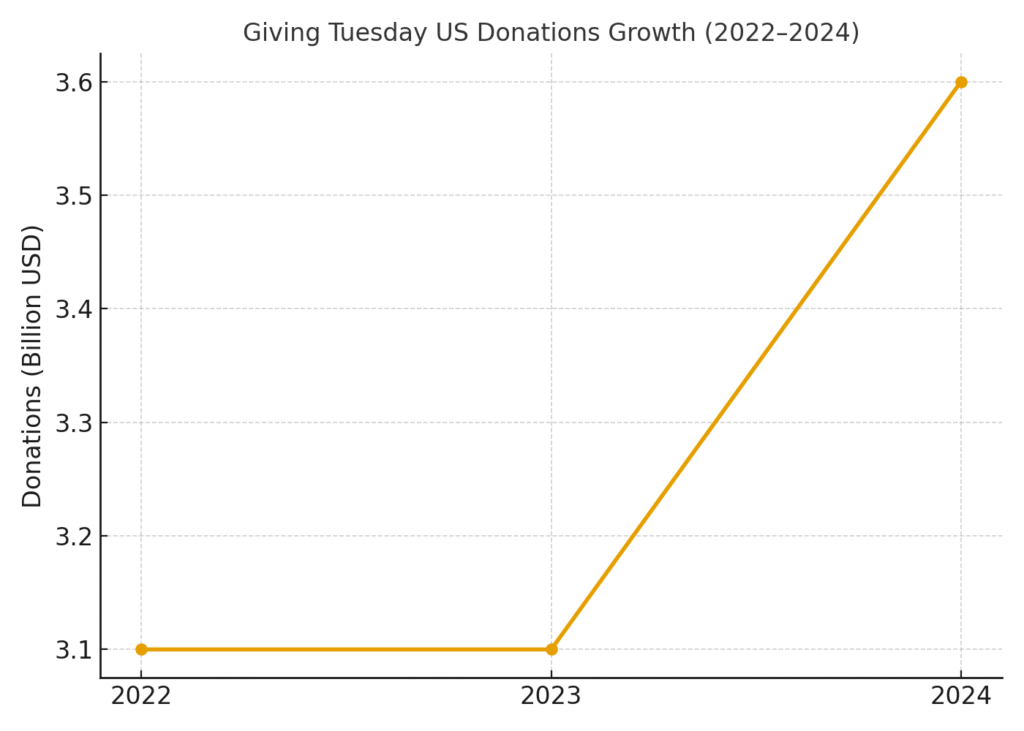
| 1 | 💰 Total Impact | $3.6 Billion | Donated in the U.S. on Giving Tuesday 2024, representing a 16% increase from 2023's $3.1 billion |
| 2 | 👥 Participation | 36.1 Million | Record-breaking number of people who participated in Giving Tuesday 2024 across the U.S. |
| 3 | 📈 Historical Growth | $18.5 Billion | Total donations generated since Giving Tuesday's launch in 2012 |
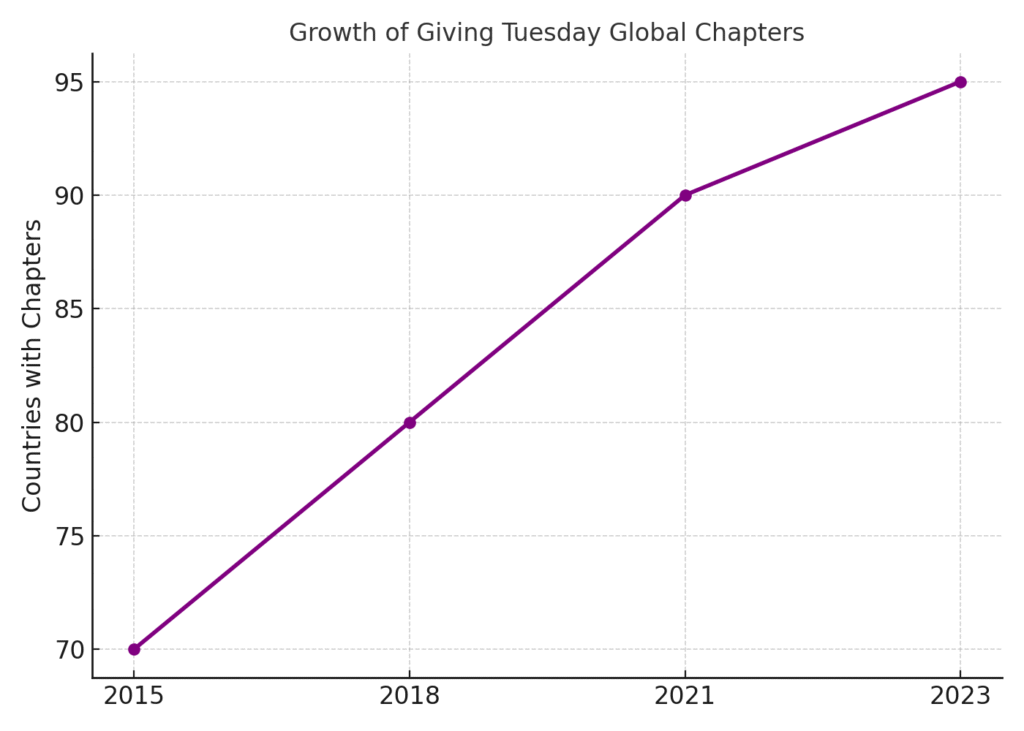
| 4 | 🎯 Engagement Types | Multi-Channel | 18.5M gave money, 16.6M advocated, 12.9M gave goods, and 9.2M volunteered |
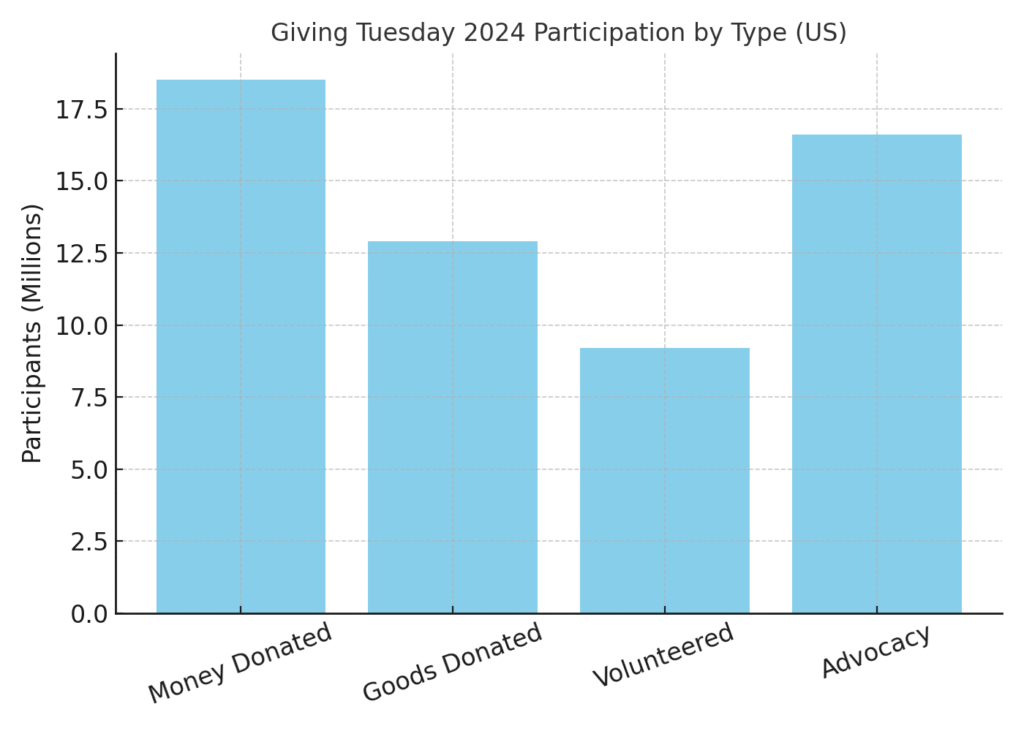
| 5 | 🌍 Global Reach | 95 Countries | Over 300 communities worldwide participated in GivingTuesday 2023 |
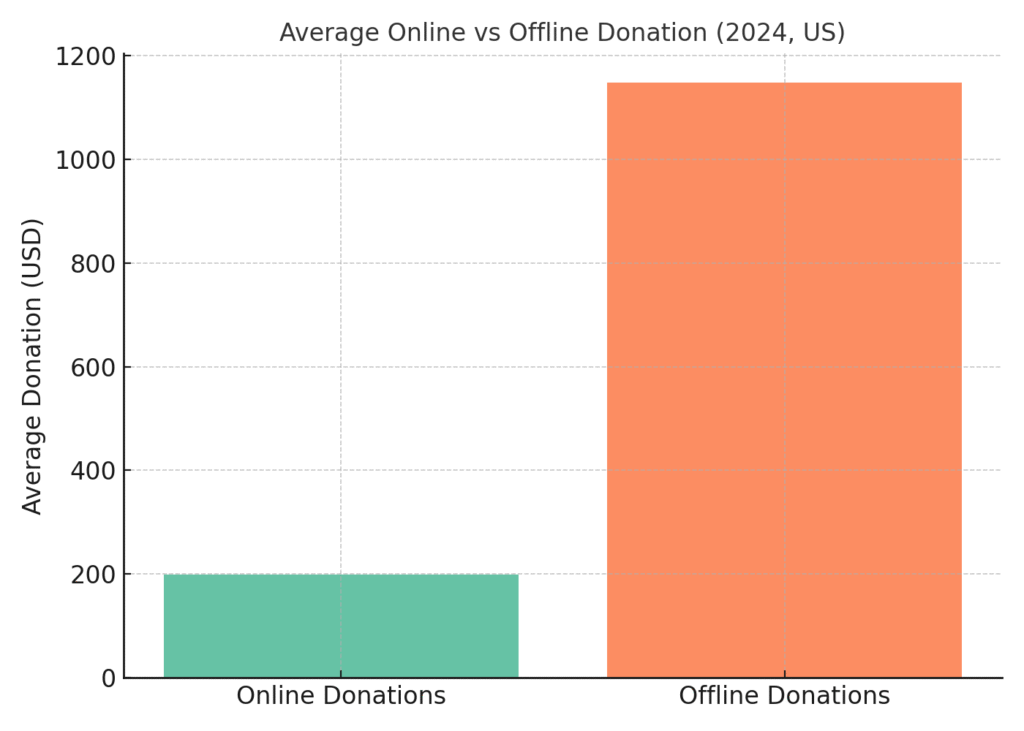
| 6 | 💸 Average Gift | $199 Online | Average online donation was $199 (median $76); offline averaged $1,147 (median $108) |
| 7 | 💻 Online Giving | $1+ Billion | In 2022, online GivingTuesday donations in the U.S. crossed the $1 billion mark for the first time |
| 8 | 🔄 Recurring Donors | 5% | Of new donors became recurring contributors on Giving Tuesday 2024 |
| 9 | 📊 Recurring Growth | +34% | Increase in recurring gifts on GivingTuesday 2023 among Neon CRM clients |
| 10 | ⏰ Last-Minute Giving | 12% | Of December donations are made in the final 72 hours of the year |
| 11 | 📧 Email Open Rate | 21.56% | Average email open rate on Giving Tuesday 2024, with 2.57% click-through rate |
| 12 | 💌 Email Revenue | 14% | Of digital revenue during year-end campaigns came from email in 2022 |
| 13 | 📱 Mobile Traffic | 57% | Of nonprofit website traffic came from mobile devices (but 75% of revenue from desktop) |
| 14 | 📲 Mobile Growth | +50% | Increase in online donations completed via mobile devices |
| 15 | 🐦 Social Trending | #1 on X | GivingTuesday trended #1 on X (formerly Twitter) in 2023 |
| 16 | 🤝 Community Power | 52% | Of supporters drawn to the idea of a bigger group of people doing good |
| 17 | 📱 Social Action | 55% | Of people who engage with nonprofits on social media end up taking action |
| 18 | 👶 Gen Z Sharing | 50% Weekly | Half of Gen Z shares causes/fundraisers weekly; 46% believe sharing inspires others |
| 19 | 🎄 December Revenue | 40% | Nonprofits received 40% of their 2024 online revenue in December |
| 20 | 🎯 Touchpoints | 3-5 Contacts | Donors need 3-5 touchpoints during year-end season to make a gift |
Top 20 Giving Tuesday Marketing Statistics 2025
Giving Tuesday Marketing Statistics #1: $3.6 Billion Raised In 2024
In 2024, Giving Tuesday generated a record-breaking $3.6 billion in the United States. This amount represented a 16% increase compared to 2023, showing that generosity continues to grow despite economic uncertainty. Nonprofits of all sizes benefited from this surge, with many smaller organizations seeing new donor activity. The sheer scale of donations proves the power of coordinated giving days. For marketers, this statistic highlights the importance of aligning campaigns with this global movement.
Giving Tuesday Marketing Statistics #2: 36.1 Million Participants In The U.S.
Over 36.1 million Americans participated in Giving Tuesday 2024, either by donating, volunteering, or giving goods. This was a 7% increase compared to 2023, reflecting stronger engagement. The rise in participation demonstrates how awareness campaigns are resonating with more people each year. It’s not just about financial giving—many individuals contributed their time and voices to causes. Marketers can learn that participation diversity is just as valuable as monetary contributions.
Giving Tuesday Marketing Statistics #3: 18.5 Million Donated Money In 2024
Out of the 36.1 million participants, 18.5 million made direct financial donations. This emphasizes how critical cash contributions remain for nonprofits during Giving Tuesday. While giving comes in many forms, monetary gifts still form the backbone of the movement. Campaigns that simplify the donation process tend to capture a larger share of this group. The data underscores the need for user-friendly, mobile-first giving experiences.
Giving Tuesday Marketing Statistics #4: 12.9 Million Donated Goods In 2024
In 2024, 12.9 million people donated goods instead of, or in addition to, money. This highlights the importance of including in-kind donation options in Giving Tuesday campaigns. Many donors find it easier to give food, clothing, or other essentials rather than financial contributions. Nonprofits that set up clear systems to collect and distribute these items benefit from increased engagement. It also shows the broader definition of generosity beyond dollars.
Giving Tuesday Marketing Statistics #5: 9.2 Million Volunteered Their Time
Alongside financial and material giving, 9.2 million people volunteered their time on Giving Tuesday 2024. Time is often considered one of the most valuable resources, and this statistic shows its significance. Volunteer opportunities often lead to long-term supporter relationships for nonprofits. Marketers can encourage participation by highlighting how even small amounts of time make an impact. Campaigns should emphasize both immediate and long-term benefits of volunteering.
Giving Tuesday Marketing Statistics #6: 16.6 Million Advocated Online
Another form of contribution came from 16.6 million individuals who advocated for causes online in 2024. Advocacy is a powerful way to extend reach beyond direct donors. Through posts, shares, and digital storytelling, these supporters amplify nonprofit visibility. This proves that engagement strategies must include digital activism, not just donations. Social media marketing plays a crucial role in mobilizing these voices.
Giving Tuesday Marketing Statistics #7: $3.1 Billion Raised In 2023
In 2023, Giving Tuesday brought in $3.1 billion in the U.S. While impressive, the growth compared to 2022 was only 0.06%, showing signs of plateauing. Despite slower growth, the campaign remained essential for nonprofits. This stagnation highlighted the need for fresh strategies and donor engagement approaches. Marketing teams should consider this a call to innovate fundraising tactics.
Giving Tuesday Marketing Statistics #8: 34 Million Participants In 2023
Participation numbers in 2023 reached around 34 million adults in the U.S. However, this marked a 10% decline compared to 2022. The drop suggested that some donor fatigue or economic pressure impacted turnout. Campaigns needed stronger messaging to re-energize audiences. For marketers, this highlights the risk of assuming participation will always rise year-over-year.
Giving Tuesday Marketing Statistics #9: Recurring Gifts Increased By 34.23% In 2023
Recurring gifts saw a significant 34.23% increase during Giving Tuesday 2023 among Neon CRM nonprofits. This demonstrates that one-time campaigns can serve as gateways to long-term support. Nonprofits that emphasized monthly giving options benefited most. Recurring donations create financial stability, which is vital for organizational growth. Marketing strategies should encourage sustained commitments alongside one-time gifts.
Giving Tuesday Marketing Statistics #10: Average Online Donation Was $199 In 2024
In 2024, the average online donation was around $199. This figure shows how much individuals are comfortable contributing digitally. Online giving platforms must ensure secure and smooth checkout experiences to maintain donor trust. The accessibility of digital channels helps boost overall participation. For marketers, the data proves that online-focused campaigns can yield substantial revenue.
Giving Tuesday Marketing Statistics #11: Average Offline Donation Was $1,147 In 2024
While online donations are increasing, offline donations averaged a much higher $1,147 in 2024. This suggests that larger donors still prefer traditional giving methods. Nonprofits should not overlook offline strategies such as checks, in-person events, or corporate partnerships. These offline channels often secure major gifts that balance smaller online contributions. Effective campaigns blend both digital and traditional fundraising.
Giving Tuesday Marketing Statistics #12: 5% Of New Donors Became Recurring In 2024
About 5% of new donors on Giving Tuesday 2024 became recurring donors. This is a powerful indicator of long-term fundraising potential. Even small percentages of recurring conversions can create sustainable revenue. Nurturing these donors through consistent communication ensures stronger retention. Marketers should always integrate stewardship strategies post-Giving Tuesday.
Giving Tuesday Marketing Statistics #13: Email Click-Through Rate Was 2.57% In 2024
Email marketing performed strongly on Giving Tuesday 2024, with a 2.57% click-through rate. This represented a 58% improvement compared to previous years. It highlights that donors still respond well to targeted email campaigns. Subject line optimization and personalization likely drove this success. Nonprofits should prioritize email as a high-impact channel for donor engagement.
Giving Tuesday Marketing Statistics #14: Overall Revenue Grew By 7% In 2024
Between 2023 and 2024, nonprofits using Neon One reported a 7% increase in Giving Tuesday revenue. Online revenue specifically grew by 8.4%, showing continued digital momentum. This steady growth reflects improving donor confidence in online platforms. It also shows that incremental improvements can still make a big difference. For marketers, consistent optimization is key to sustained gains.
Giving Tuesday Marketing Statistics #15: 36% Donated Money In 2022
In 2022, 36% of participants donated money during Giving Tuesday. This shows that over a third of participants engaged financially in some way. While financial giving is still central, other contributions like time and goods also matter. This diversity underscores the holistic nature of Giving Tuesday. Campaigns should highlight multiple pathways to support.
Giving Tuesday Marketing Statistics #16: 95 Countries Had Chapters By 2023
Giving Tuesday had grown to include 95 country chapters by 2023. This illustrates the global expansion of the movement. What started as a U.S.-based initiative has truly become international. Nonprofits now coordinate across borders to inspire worldwide generosity. Marketers can use this global momentum to build inclusive, multicultural campaigns.
Giving Tuesday Marketing Statistics #17: 84% Of Aware People Gave More In 2023
A 2023 survey found that 84% of people aware of Giving Tuesday said they gave more. Awareness directly influenced generosity levels. This statistic underlines the role of marketing in building visibility. The more people know about the day, the more likely they are to act. Campaigns that focus on education and storytelling drive stronger results.
Giving Tuesday Marketing Statistics #18: 20 Billion Social Media Impressions
Giving Tuesday campaigns generated over 20 billion impressions on social media. This staggering number shows the impact of digital advocacy. Hashtags and user-generated content helped nonprofits reach vast audiences. Social media remains one of the most effective tools for scaling campaigns. Marketers must invest in creating shareable, engaging content.
Giving Tuesday Marketing Statistics #19: 82% Of Nonprofits Tested New Strategies
In recent years, 82% of nonprofits used Giving Tuesday to test new fundraising or marketing strategies. The day acts as a laboratory for innovation. Whether experimenting with TikTok videos, new email sequences, or live events, nonprofits embraced creativity. Many of these tactics went on to become part of year-round strategies. Marketers can view Giving Tuesday as both a fundraising opportunity and a testing ground.
Giving Tuesday Marketing Statistics #20: December Drives 17–20% Of Annual Revenue
For many nonprofits, December—including Giving Tuesday—accounts for 17–20% of annual revenue. This concentration of donations makes year-end giving critical. Campaigns that miss this window risk losing out on vital funds. Marketers must prepare well in advance to capture December’s generosity peak. This statistic reinforces why Giving Tuesday is positioned at the perfect time.
Reflecting on the Numbers
Looking over these statistics, I can’t help but feel encouraged by the growing spirit of generosity, even in times when participation numbers fluctuate. What stands out to me most is the resilience of donors—whether they’re giving money, time, or simply amplifying a cause online. My hope is that these insights give you the same motivation they gave me: to keep testing, learning, and connecting with people in ways that matter. At the end of the day, these numbers remind us that behind every click, share, or dollar is a person who believes in making a difference—and that’s what keeps me inspired to do this work.
SOURCES
https://www.givingtuesday.org/blog/givingtuesday-2024-record-breaking-results/
https://pro.gofundme.com/c/blog/giving-tuesday-2024-results/
https://thegivingblock.com/resources/givingtuesday-stats/
https://donorbox.org/nonprofit-blog/end-of-year-giving-statistics
https://volunteerhub.com/blog/giving-tuesday-statistics
https://www.frontstream.com/blog/giving-tuesday-2023-everything-your-nonprofit-should-know
https://www.nonprofitpro.com/article/givingtuesday-2024-breaks-records/
https://www.bonterratech.com/resources/what-we-learned-givingtuesday-2024
https://fundraiseup.com/blog/giving-tuesday-stats/
https://www.wholewhale.com/tips/givingtuesday-stats-and-facts/
https://www.givingtuesday.org/blog/growing-giving/
https://apnews.com/article/1d040a71fbd292230209c8418369ca73
https://www.givingtuesday.org/blog/making-the-case-for-givingtuesday/