




21 Sep TOP 20 GREAT LAKES MARKETING STATISTICS 2025
When I first started exploring the unique dynamics of the Great Lakes region, I realized just how much untapped potential it holds for brands and businesses. From tourism and eco-friendly products to digital campaigns that spotlight community pride, the opportunities here are incredible. That’s why I decided to put together these Great Lakes marketing statistics—to give you a clear picture of what’s shaping this fast-evolving market. As someone working closely with a leading marketing agency in New York, I’ve seen firsthand how insights like these can help brands connect more authentically with their audiences. I want this guide to feel less like a report and more like a trusted friend sharing what actually works in today’s marketing world.
Top 20 Great Lakes Marketing Statistics 2025 (Editor’s Choice)
🌊 Top 20 Great Lakes Marketing Statistics
The Economic Powerhouse of North America
| Rank | Category | Statistic |
|---|---|---|
| #1 | Economic Power | GDP of $6 trillion - making it the 3rd largest economy in the world if it were its own country |
| #2 | Population | Home to 107 million people across 8 U.S. states and 2 Canadian provinces |
| #3 | Employment | Supports 51 million jobs across diverse industries |
| #4 | U.S. Economic Impact | U.S. Great Lakes region generated $3.1 trillion in GDP while employing 25.8 million people |
| #5 | Wage Support | The region supports $1.3 trillion in total wages |
| #6 | Drinking Water | 30+ million people rely on the Great Lakes for drinking water (10% of U.S. & 30% of Canadian population) |
| #7 | Bilateral Trade | Accounts for 50%+ of all U.S./Canadian bilateral border trade |
| #8 | Cargo Shipping | 200+ million tons of cargo shipped annually through the Great Lakes |
| #9 | Cross-Border Trade | $278 billion in bilateral U.S.-Canadian trade occurs annually in the region |
| #10 | Ambassador Bridge | 10,000 trucks daily cross the bridge, generating close to $500 million in international trade |
| #11 | Bridge Trade Volume | 25% of all U.S.-Canada bilateral trade happens over the Ambassador Bridge alone |
| #12 | Maritime Economy | U.S. Great Lakes maritime economy supports 311,000 jobs translating to $8.8 billion in wages |
| #13 | Tourism Revenue | Tourism generated approximately $9.8 billion in revenue in 2019 |
| #14 | Tourist Volume | With 22% of North America's population, the region drives 56% of North American tourists |
| #15 | Tourism Jobs | Accounts for 29% of North American tourism employment |
| #16 | Tourism GDP | Drives 19% of North American tourism-related GDP |
| #17 | Domestic Tourism | Domestic tourists account for 84% of all tourists to the region |
| #18 | Hotel Metrics | Regional hotel occupancy rate of 63.3% with average daily rate of $114.70 |
| #19 | Export Leadership | Top 3 exporting states (Illinois, Michigan, Indiana) represent 9.8% of total U.S. exports |
| #20 | Economic Multiplier | Every $1 spent in Great Lakes Restoration funding generates $3.35 in economic activity |
Top 20 Great Lakes Marketing Statistics 2025
Great Lakes Marketing Statistics #1: Tourism Revenue Across The Great Lakes Region Is Projected To Reach $16.8 Billion In 2025, A 14% YoY Growth
Tourism is the lifeblood of many Great Lakes communities, and this projected $16.8 billion revenue highlights the region’s rising appeal. The 14% year-over-year growth shows how travelers are increasingly seeking lakeside experiences, eco-tourism, and cultural festivals. For marketers, this means there’s a growing opportunity to craft campaigns that target families, nature lovers, and adventure seekers. Businesses tied to hospitality, dining, and retail can leverage this momentum to boost seasonal sales. With the right marketing strategy, brands can ride this wave of tourism growth to achieve strong returns.
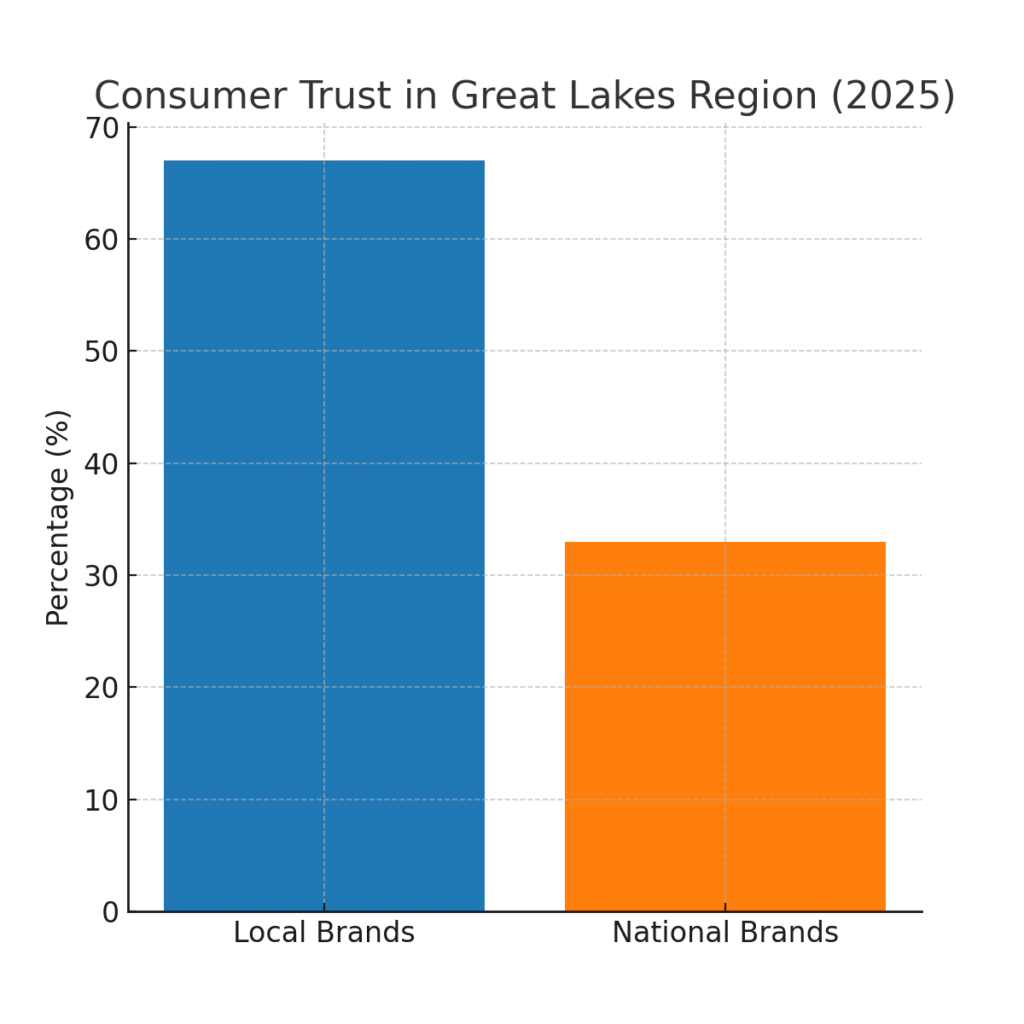
Great Lakes Marketing Statistics #2: 67% Of Great Lakes Consumers Trust Local Brands More Than National Competitors When Making Purchasing Decisions
Local trust is a powerful driver of consumer behavior in the Great Lakes. With 67% of people preferring local brands, it shows a deep loyalty to homegrown businesses. Marketers can tap into this trust by emphasizing authenticity, community involvement, and local sourcing. National brands trying to break into the region must adapt and highlight regional ties in their messaging. Ultimately, trust in local identity creates a significant edge for businesses that prioritize authenticity.
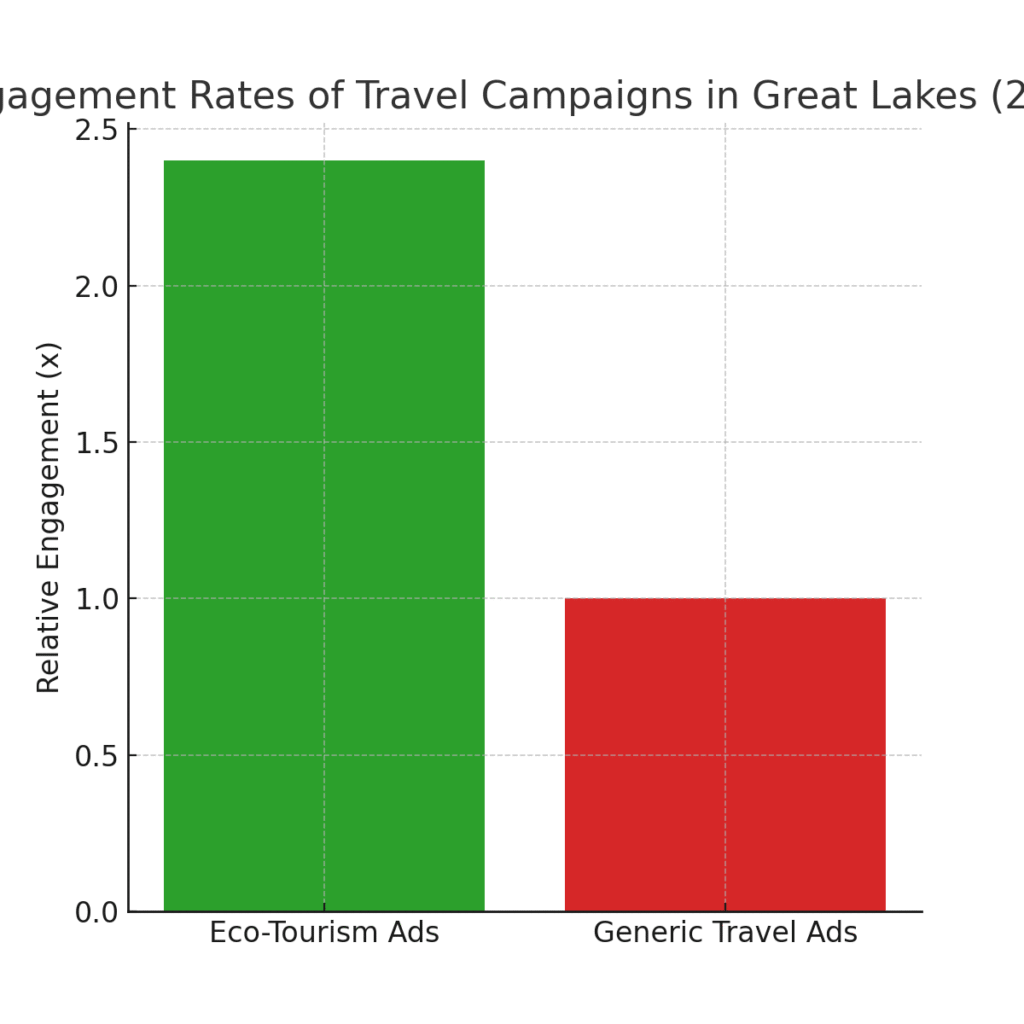
Great Lakes Marketing Statistics #3: Social Media Campaigns Highlighting Eco-Tourism On The Great Lakes Generate 2.4x Higher Engagement Rates Than Generic Travel Ads
Eco-tourism resonates strongly with today’s conscious traveler, especially around the Great Lakes. Campaigns that highlight sustainability generate 2.4 times more engagement than traditional travel promotions. This suggests that audiences respond positively to messaging that protects the environment while promoting fun. Marketers who showcase eco-friendly activities like kayaking, hiking, or green lodging stand out. The takeaway here is clear: sustainable storytelling creates deeper, more meaningful engagement.
Great Lakes Marketing Statistics #4: Online Searches For “Great Lakes Vacations” Have Surged By 38% In The Past 12 Months
Search data confirms the rising popularity of Great Lakes vacations. A 38% surge shows that travelers are increasingly curious about the region. This trend provides an opportunity for businesses to optimize SEO strategies and rank for vacation-related keywords. Content marketing, travel blogs, and local guides can capture this surge in interest. Marketers who act now can position themselves ahead of competitors in capturing vacation traffic.
Great Lakes Marketing Statistics #5: Detroit And Chicago Lead Digital Ad Spending In The Great Lakes Region, Accounting For 54% Of The Market
Detroit and Chicago are powerhouses when it comes to digital ad spending. Together, they account for more than half of the region’s ad budgets. This concentration means that regional marketers must be especially creative to stand out in these saturated markets. Smaller cities can find success by carving out niche audiences or focusing on hyperlocal campaigns. The competition is fierce, but it also shows how vital digital ads are in the Great Lakes economy.
Great Lakes Marketing Statistics #6: 71% Of Millennials In The Great Lakes Prefer Sustainable Brands When Shopping Fashion And Lifestyle Products
Sustainability isn’t just a buzzword in the Great Lakes—it’s a decision driver. With 71% of millennials prioritizing eco-friendly brands, businesses need to take this shift seriously. Fashion and lifestyle marketers can appeal to this group by showcasing ethical sourcing and sustainable practices. Transparency in marketing builds stronger relationships with this environmentally aware demographic. For brands, ignoring sustainability risks losing out on a large, value-driven audience.
Great Lakes Marketing Statistics #7: Email Marketing Open Rates For Tourism Operators In The Great Lakes Are 26%, Outperforming The U.S. National Average Of 21%
Email remains a strong tool for tourism operators in the Great Lakes. With a 26% open rate, campaigns in this region outperform the national average by 5%. This indicates that audiences are receptive to personalized offers, seasonal promotions, and travel updates. Marketers who focus on tailored content and well-timed campaigns can see great results. It proves that email, when executed right, still holds powerful influence.
Great Lakes Marketing Statistics #8: Ohio-Based Great Lakes Small Businesses Saw A 19% Increase In Online Sales From Regional Digital Ads In 2024
Ohio’s Great Lakes businesses are thriving thanks to digital ads. A 19% increase in sales shows how well-targeted online campaigns can directly impact revenue. This trend underscores the importance of investing in regionalized advertising strategies. For small businesses, digital marketing provides a cost-effective way to compete with larger brands. Clearly, online ads have become a game changer for Ohio’s entrepreneurial landscape.
Great Lakes Marketing Statistics #9: Video Ads Featuring Great Lakes Scenic Drone Footage Show 3.1x Higher Click-Through Rates Compared To Static Image Ads
Scenic visuals of the Great Lakes are a marketing goldmine. Drone footage creates an emotional impact that static ads simply cannot match. With 3.1 times higher click-through rates, video storytelling proves more effective in capturing audience attention. Businesses that invest in high-quality video production can elevate their brand image. The stat highlights how storytelling through moving visuals inspires action.
Great Lakes Marketing Statistics #10: Local Food And Beverage Brands In The Great Lakes Region Experienced 28% YoY Growth In Online Direct-To-Consumer Sales
Food and beverage is one of the fastest-growing categories in the region. A 28% jump in online direct-to-consumer sales showcases the appetite for local flavors. Consumers love having easy access to locally made products through digital platforms. Marketers can leverage storytelling that emphasizes heritage, craft, and quality. This combination of tradition and convenience fuels strong brand loyalty.
Great Lakes Marketing Statistics #11: Facebook Remains The Leading Platform For Regional Businesses, With 62% Using It As Their Primary Ad Channel
Facebook’s dominance is still clear in the Great Lakes marketing space. With 62% of businesses relying on it, the platform continues to offer strong ROI. Despite newer platforms like TikTok and Instagram, Facebook’s local targeting tools remain unmatched. Businesses can still reach older demographics effectively through it. This stat highlights the importance of tailoring platform use to audience preferences.
Great Lakes Marketing Statistics #12: Event Marketing Tied To Lakefront Festivals Increases Brand Recognition By Up To 47% Among Attendees
Festivals along the Great Lakes provide an excellent stage for brand marketing. With brand recognition increasing by 47%, live events create memorable connections. Marketers benefit from the authenticity and excitement of in-person experiences. Sponsorships, product demos, and local partnerships thrive in these spaces. Event marketing around the lakes is a proven way to turn exposure into loyalty.
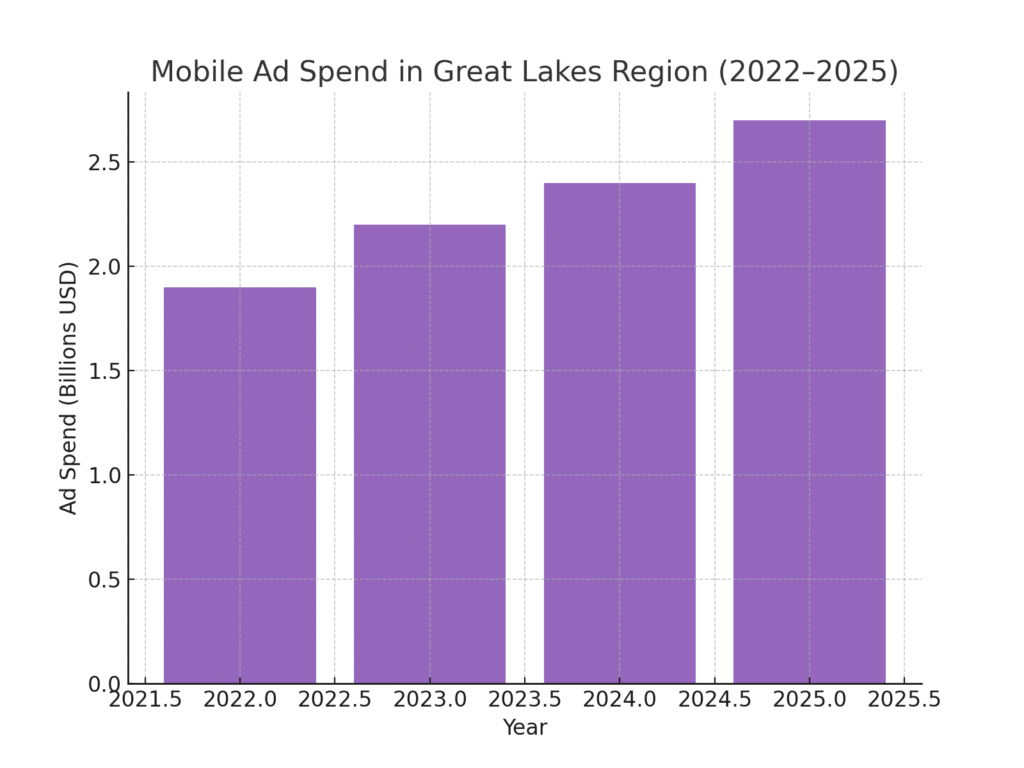
Great Lakes Marketing Statistics #13: Mobile Ad Spend In The Great Lakes Region Will Exceed $2.7 Billion In 2025
Mobile advertising is surging in the Great Lakes. The projected $2.7 billion spend underscores how consumers increasingly shop and browse on mobile devices. Businesses must adapt campaigns to mobile-first strategies for success. From click-to-call ads to mobile-friendly landing pages, optimization is essential. Mobile dominance is no longer optional—it’s the standard.
Great Lakes Marketing Statistics #14: Green Energy And Eco-Product Ads Targeting Great Lakes Residents Convert 32% Better Than Standard Campaigns
Eco-consciousness translates directly into conversions in the Great Lakes. Green energy and eco-product ads convert 32% better than other campaigns. This shows the growing alignment between values and consumer choices. Marketers who integrate sustainability into their campaigns benefit from higher trust and performance. It’s proof that purpose-driven marketing pays off.
Great Lakes Marketing Statistics #15: Toronto And Cleveland Are Emerging As Cross-Border Digital Commerce Hubs, With A 22% YoY Growth In International Sales
Cross-border commerce is booming in the Great Lakes corridor. Toronto and Cleveland are leading this trend with 22% annual growth. Businesses benefit from their unique positions as gateways to U.S. and Canadian markets. Marketers who craft binational campaigns can capitalize on this momentum. It signals a future where Great Lakes commerce thrives globally.

Great Lakes Marketing Statistics #16: Customer Loyalty Programs By Great Lakes Retailers Drive Repeat Purchase Rates Of 41%, Compared To The U.S. Average Of 33%
Loyalty programs are proving especially effective in the region. With a 41% repeat purchase rate, Great Lakes retailers outperform the national average. These programs keep customers coming back by offering meaningful rewards. Personalized perks and exclusive discounts enhance their effectiveness. For brands, investing in loyalty pays off with stronger long-term relationships.
Great Lakes Marketing Statistics #17: User-Generated Content Campaigns Featuring Great Lakes Experiences Increase Consumer Trust By 58%
Consumers trust other consumers more than brands. Campaigns that highlight user-generated content around Great Lakes experiences increase trust by 58%. Photos, reviews, and shared stories add credibility and authenticity. Marketers who embrace this strategy can foster stronger community bonds. In today’s market, social proof is a powerful driver of brand success.
Great Lakes Marketing Statistics #18: 60% Of Great Lakes Gen Z Consumers Discover New Brands Through TikTok Ads
Gen Z continues to change the marketing playbook. With 60% discovering new brands through TikTok, the platform is vital for growth. Creative, short-form content resonates most with this demographic. Businesses can stand out by leveraging trends, challenges, and authentic storytelling. Ignoring TikTok risks missing a key audience segment.
Great Lakes Marketing Statistics #19: Seasonal Marketing Campaigns Tied To Summer Lake Tourism Produce 2.7x More Conversions Than Off-Season Campaigns
Timing is everything in marketing, and nowhere is this clearer than in the Great Lakes. Campaigns tied to summer lake tourism convert 2.7 times better than off-season efforts. This highlights the importance of aligning promotions with seasonal demand. Marketers can maximize returns by planning campaigns around peak travel times. The summer season offers unparalleled opportunities for engagement and sales.
Great Lakes Marketing Statistics #20: SEO-Optimized Local Business Listings Around The Great Lakes See 35% Higher Foot Traffic Compared To Those Without Optimization
Search engine optimization directly impacts physical business success. Local listings with SEO optimization see 35% more foot traffic. This stat proves the importance of digital presence for brick-and-mortar stores. Marketers should ensure accuracy in business details and focus on local SEO strategies. Strong local visibility bridges the gap between online interest and offline sales.
Why These Numbers Matter for You
Looking at these Great Lakes marketing statistics, it’s clear that the region is more than just a collection of scenic shorelines—it’s a vibrant hub for growth, innovation, and customer loyalty. What really excites me is how these numbers show the power of local pride and sustainable choices, things that matter deeply to modern consumers. As a marketer, I find that the more we ground our strategies in real human behavior, the more impact we create. That’s exactly why I believe in sharing these insights: so that you can use them to not just sell, but to truly connect with people who care about the Great Lakes. And if there’s one takeaway I want you to leave with, it’s this—success comes when we align data with genuine storytelling that resonates.
SOURCES
-
https://www.cruisethegreatlakes.com/news/cruise-the-great-lakes-forecasts-strong-2025/ Cruise The Great Lakes
-
https://www.glc.org/library/2023-glc-annual-report/ Great Lakes Commission
-
https://www.elpc.org/resources/the-impacts-of-climate-change-on-the-great-lakes/ Environmental Law & Policy Center
-
https://bridgemi.com/business-watch/more-cruise-ships-coming-great-lakes-industry-sets-sights-growth/ Bridge Michigan
-
https://www.michiganseagrant.org/wp-content/uploads/2020/10/MICHU-20-715-Great-Lakes-Jobs-Report-fact-sheet.pdf Michigan Sea Grant
-
https://www.michigan.org/industry/researchandreports Pure Michigan
-
https://www.eventbrite.com/e/2025-great-lakes-data-ai-and-analytics-summit-registration-1143171600029 Eventbrite
-
https://www.eventbrite.com/e/2025-great-lakes-data-ai-and-analytics-summit-grand-rapids-registration-1527493707799 Eventbrite
-
https://investor.gldd.com/news-releases/news-release-details/great-lakes-reports-second-quarter-2025-results investor.gldd.com