




21 Sep TOP 20 GULF COAST MARKETING STATISTICS 2025
When I first began researching gulf coast marketing statistics, I was struck by how much these numbers reveal about the heart and rhythm of the region. From the growth of tourism to the evolving economic contributions of coastal communities, each figure tells a story about resilience and opportunity. As someone working closely with a leading marketing agency in New York, I’ve learned that behind every statistic is a chance to connect with people and businesses in meaningful ways. That’s why I wanted to gather these insights—not as cold numbers, but as a living narrative of how marketing and economic trends are shaping the Gulf Coast today.
Top 20 Gulf Coast Marketing Statistics 2025 (Editor’s Choice)
🌊 Gulf Coast Marketing Statistics 2025
Key Insights & Data-Driven Trends Shaping the Region's Business Landscape
| # | Category | Key Metric | Insight & Description |
|---|---|---|---|
| 1 | 📊 Regional GDP | $495.7B | Gulf Coast region GDP in 2020, representing 27.9% of Texas' total economic output |
| 2 | 💰 Household Income | $72,964 | Median household income in 2021, up 28% from $57,145 in 2011 |
| 3 | 👥 Workforce Size | 3.2M | Employed workers in the region, representing 25% of Texas jobs |
| 4 | 📈 Employment Growth | 17.3% | Total regional employment increase between 2012 and 2022 |
| 5 | 🏢 Marketing Revenue | $3.4M | Gulf Coast Marketing Services annual revenue in 2025 |
| 6 | 🏠 Home Value Growth | 2-4% | Year-over-year home value appreciation across Gulf Coast in 2025 |
| 7 | 🏦 Mortgage Rates | 6.5-6.8% | Current mortgage rates driving buyers toward adjustable-rate products |
| 8 | 🌱 Housing Trends | Compact+Eco | Buyers favoring energy-efficient homes due to insurance and construction costs |
| 9 | 💵 Ad Spend Guide | 2-10% | Recommended percentage of gross sales for advertising budgets (SBA) |
| 10 | 💼 Marketing Salaries | $26K-$37K | Range from Digital Marketing Strategist to Marketing Manager positions |
| 11 | 🍔 Top Industries | 4 Sectors | Restaurants, education, employment services, and healthcare lead employment |
| 12 | 📊 Restaurant Jobs | +36% | Growth in restaurant employment over 10-year period ending 2022 |
| 13 | 📦 Warehousing | Top Growth | Warehousing and storage led regional job gains between 2015-2020 |
| 14 | 📊 Data-Driven | 29% | Marketers emphasizing data to inform marketing strategy decisions |
| 15 | 💹 ROI Focus | 26% | Marketers prioritizing data to demonstrate ROI and business value |
| 16 | 🎯 Marketing Goals | 31% | Top benefit: understanding which marketing strategies are most effective |
| 17 | 🎓 Education Premium | $50,400 | Additional annual earnings for bachelor's degree holders vs. non-degree workers |
| 18 | 🏫 Educational Access | 27 Institutions | 10 universities, 11 colleges, 6 health science schools in the region |
| 19 | ⚡ Energy Jobs | +500 | Louisiana oil & gas jobs added Jan-Aug 2024, with flat forecast through 2027 |
| 20 | 🔌 Industrial Growth | 25.8% | Gulf Coast industrial electricity sales growth over 10 years vs. 1.2% US average |
Top 20 Gulf Coast Marketing Statistics 2025
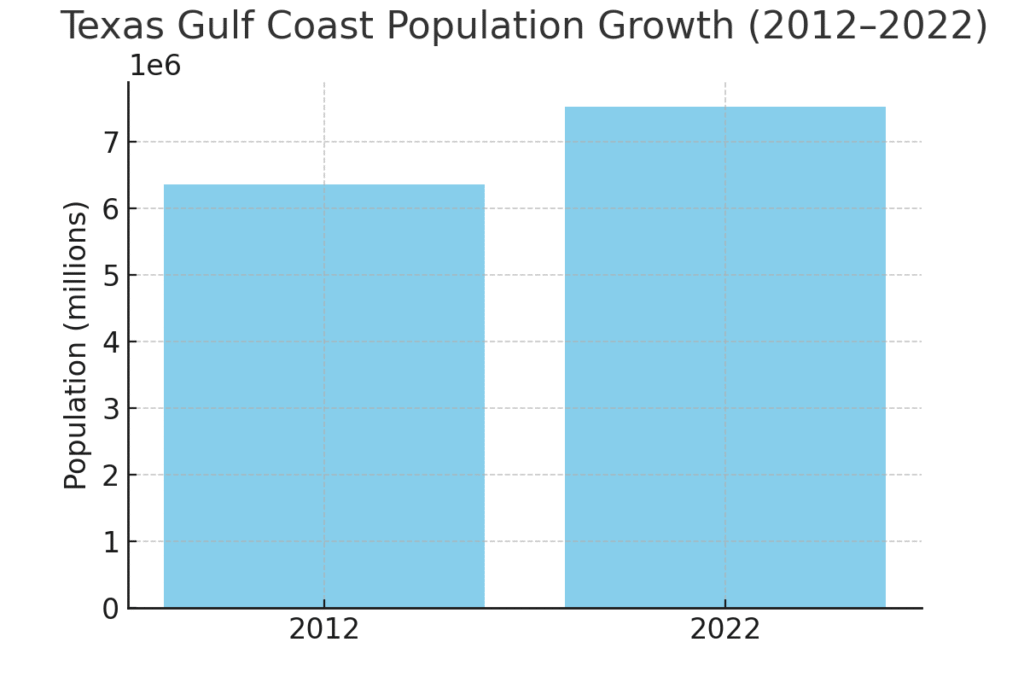
Gulf Coast Marketing Statistics #1 – Population Growth Of 1.16 Million (2012–2022)
Between 2012 and 2022, the Texas Gulf Coast region saw its population rise by approximately 1.16 million residents. This growth highlights the increasing appeal of coastal cities for both work opportunities and lifestyle benefits. For marketers, this surge means a larger and more diverse audience to reach with campaigns. It also underlines the importance of adapting strategies to accommodate both newcomers and long-standing communities. Population growth is always a signal of expanding markets, and here it suggests long-term demand for consumer goods and services.
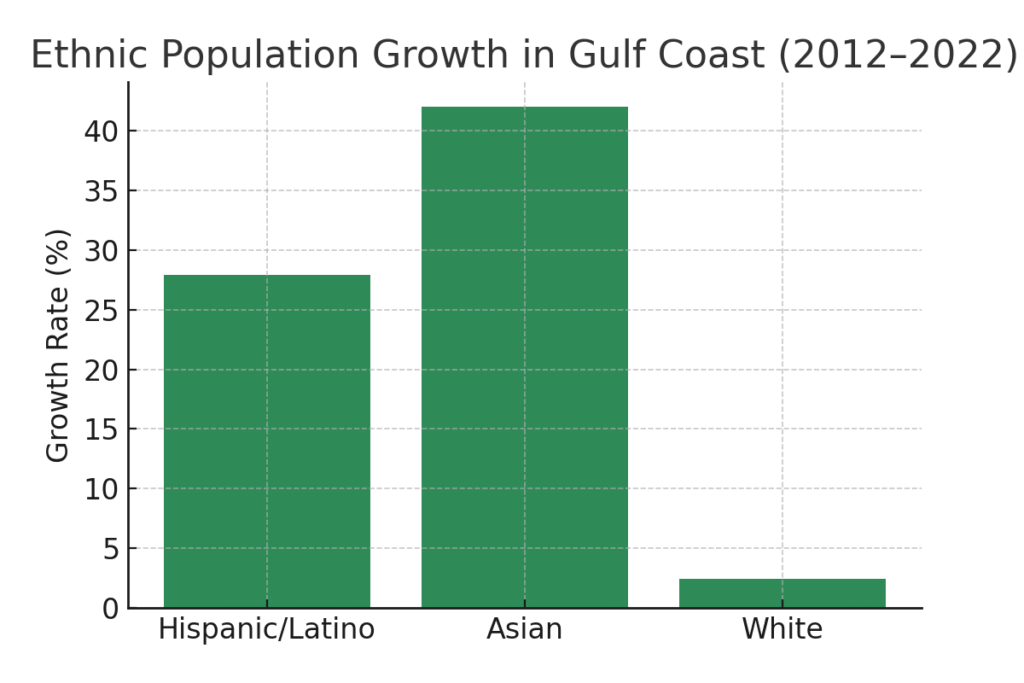
Gulf Coast Marketing Statistics #2 – Hispanic/Latino Population Grew 27.9%
The Hispanic/Latino community in the Gulf Coast region experienced significant growth, increasing by nearly 28%. This demographic shift offers marketers opportunities to create culturally resonant campaigns. Bilingual advertising and inclusive branding are becoming more essential than ever in this market. The increase also reflects broader national trends where Hispanic consumers represent one of the fastest-growing segments. Brands that authentically engage with this audience will likely see higher loyalty and trust.
Gulf Coast Marketing Statistics #3 – Asian Population Growth Of 42%
Over the same decade, the Asian population in the Gulf Coast grew by a remarkable 42%. This rapid increase signals the rising influence of Asian culture and consumer preferences in the region. For businesses, it means tailoring marketing strategies to embrace cultural festivals, foods, and community priorities. These consumers often value quality, authenticity, and family-centric messaging. Recognizing this growth ensures campaigns remain relevant and effective in the changing demographic landscape.
Gulf Coast Marketing Statistics #4 – Senior Population Rose By 58%
The share of residents aged 65 and above rose by about 58% from 2012 to 2022. This highlights the Gulf Coast as not only a hub for young professionals but also retirees. For marketers, it means tailoring products and services to address healthcare, leisure, and retirement lifestyles. Seniors are also becoming increasingly active online, meaning digital campaigns can reach them effectively. This segment represents a stable and loyal consumer base when engaged properly.
Gulf Coast Marketing Statistics #5 – 34.5% Hold A Bachelor’s Degree Or Higher
By 2022, about 34.5% of Gulf Coast residents had at least a bachelor’s degree. This indicates a highly skilled and educated workforce within the region. For marketers, it suggests that audiences may respond well to data-driven, value-based, and sophisticated messaging. It also reflects the area’s ability to attract industries requiring advanced education. Education levels strongly shape consumer preferences, making this stat crucial for campaign planning.
Gulf Coast Marketing Statistics #6 – $575 Billion Regional GDP (2021)
The Gulf Coast contributed roughly $575 billion to Texas’ GDP in 2021, or about 27% of the state’s total. This shows the region’s enormous economic weight in the state and country. A high GDP suggests strong consumer purchasing power and thriving industries. Marketers can see this as a green light for investment in targeted campaigns. The Gulf Coast is not just an economic engine—it’s a market that brands cannot afford to ignore.
Gulf Coast Marketing Statistics #7 – $75 Billion In Exports (2021)
Exports from the Gulf Coast totaled nearly $75 billion in 2021. This underlines the region’s role as a global trade hub, with international connections driving demand. For marketers, this means campaigns may need to reflect a global perspective. The presence of export-heavy industries also supports B2B marketing opportunities. The scale of exports showcases the Gulf Coast as both a local and international marketplace.
Gulf Coast Marketing Statistics #8 – 584,813 Marine Economy Employees
The Gulf of Mexico marine economy employs over half a million people. These jobs range from tourism to fishing to shipping, highlighting the diverse economic base. Marketers can tap into niche audiences by recognizing these specialized industries. This workforce represents not only employees but also families and communities to market to. It’s a clear sign of how vital the marine economy is to the Gulf Coast identity.
Gulf Coast Marketing Statistics #9 – $32 Billion In Marine Wages
Employees in the marine economy earned about $32 billion in wages. This provides them with solid spending power across retail, leisure, and housing. Marketers should recognize the ripple effect these wages have in boosting local consumer demand. Industries tied to the sea—from seafood dining to recreational boating—benefit most directly. This wage strength adds resilience to the Gulf Coast economy.
Gulf Coast Marketing Statistics #10 – Tourism ROI $43 For Every $1 Spent
Marketing campaigns in the Mississippi Gulf Coast once returned $43 in visitor spending for every $1 invested. This is an exceptional ROI, showcasing the power of tourism marketing in the region. It validates that targeted campaigns can transform visitor interest into real revenue. Marketers in other sectors can learn from this efficiency in storytelling and branding. It also emphasizes tourism as a backbone of Gulf Coast economic growth.
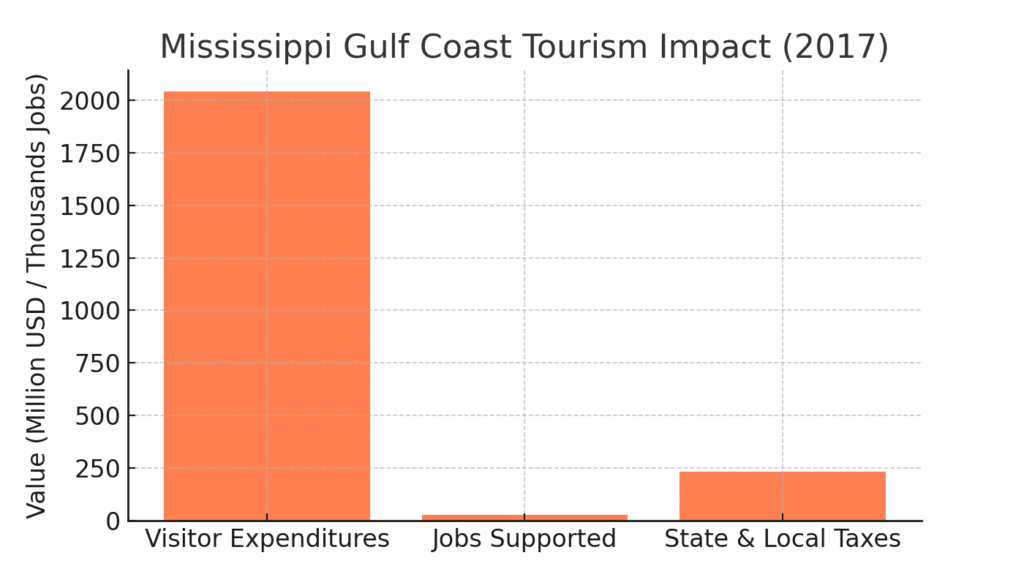
Gulf Coast Marketing Statistics #11 – $2.04 Billion Visitor Expenditures
Tourism in Mississippi’s Gulf Coast generated $2.04 billion in visitor spending in 2017. This money rippled across hotels, dining, entertainment, and attractions. It supported nearly 26,600 jobs and created a major tax base for the region. For marketers, it demonstrates the tourism industry’s multiplier effect. When people visit, they fuel a cycle of growth that benefits entire communities.
Gulf Coast Marketing Statistics #12 – 26,600 Tourism Jobs Supported
Tourism directly supported about 26,600 jobs in the Mississippi Gulf Coast. These positions included hotel staff, restaurant workers, tour operators, and more. For marketers, this reinforces how tourism campaigns don’t just attract visitors—they support livelihoods. Employment stability in this sector strengthens local economies. Marketing here isn’t abstract; it directly affects families and communities.
Gulf Coast Marketing Statistics #13 – Hotel ADR Increased To $89.59
Hotel performance in the Gulf Coast improved significantly, with Average Daily Rate rising to $89.59 by 2017. This reflects growing demand and the region’s ability to capture more value per visitor. For marketers, this highlights the importance of premium positioning. It also shows how improved branding and infrastructure can elevate an area’s perceived value. The stronger the ADR, the healthier the tourism economy becomes.
Gulf Coast Marketing Statistics #14 – 66% Of Overnight Trips Marketable
About 66% of overnight trips to the Gulf Coast were considered “marketable” or influenced by campaigns. This proves that marketing directly drives tourism decisions. It means creative ads and strategic outreach truly shape consumer behavior. For marketers, this is validation of their work’s measurable impact. Campaigns here don’t just raise awareness—they move people.
Gulf Coast Marketing Statistics #15 – Average Stay 3.3 Nights
Visitors to the Gulf Coast stayed an average of 3.3 nights. This length of stay translates to multiple touchpoints for marketers across industries. From dining promotions to entertainment packages, businesses have room to upsell. It also reflects the appeal of the region as more than a day-trip destination. Extending stays even further can drive exponential economic gains.
Gulf Coast Marketing Statistics #16 – 10.5 Million Social Media Impressions
Digital marketing in the region drove about 10.5 million impressions on social media. This stat underscores the Gulf Coast’s increasing reliance on online visibility. Campaigns that go viral or trend regionally can quickly influence visitor flows. It demonstrates the need for creative, shareable content. Social platforms are not just tools—they are engines of Gulf Coast tourism growth.
Gulf Coast Marketing Statistics #17 – Marine Average Wages $54,774
Workers in the marine economy earned an average of nearly $55,000 annually. This income level provides a solid middle-class foundation for the region. Marketers can tap into this demographic with aspirational yet accessible products. It reflects the stability of industries tied to the sea. Reliable wages translate to reliable consumer demand across multiple sectors.
Gulf Coast Marketing Statistics #18 – Coastal Counties 33.4% Of Texas GDP
Texas coastal counties contributed about 33.4% of the state’s GDP. This demonstrates the Gulf Coast’s critical role in the overall Texas economy. For marketers, this concentration of wealth and activity cannot be overlooked. It also signals the resilience of coastal economies despite environmental challenges. Where GDP thrives, so too does opportunity for effective marketing campaigns.
Gulf Coast Marketing Statistics #19 – Fort Bend County Growth Of 42%
Fort Bend County experienced an explosive 42% growth between 2012 and 2022. This makes it one of the fastest-growing areas in the Gulf Coast. Marketers must adapt quickly to capture new residents’ needs. From housing to services to entertainment, demand in fast-growing counties is highly dynamic. Rapid growth also presents chances for new brands to gain a foothold.
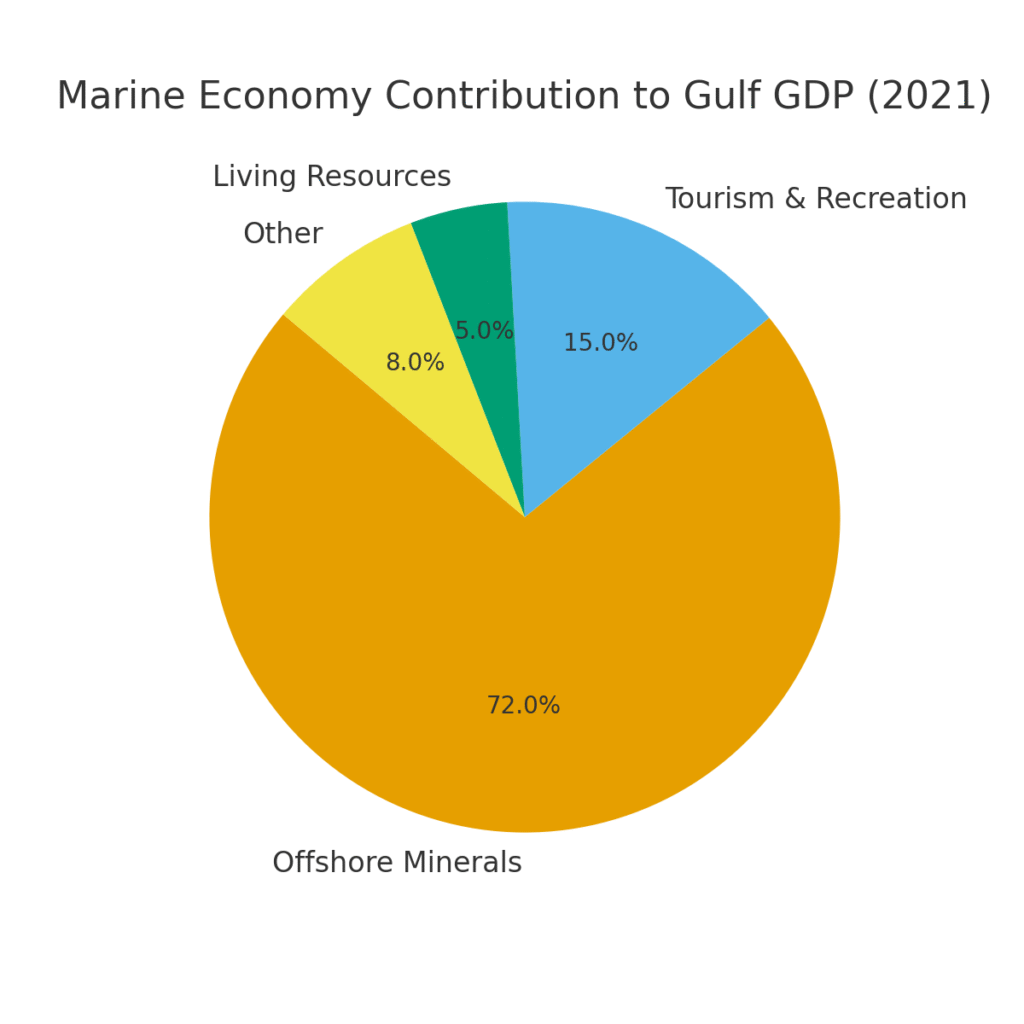
Gulf Coast Marketing Statistics #20 – Offshore Mineral GDP At 72% Share
Offshore mineral resources accounted for 72% of the Gulf’s marine GDP. This underscores the dominance of oil and gas in the regional economy. For marketers, this means there’s opportunity in B2B energy campaigns as well as community engagement initiatives. It also highlights the importance of diversification beyond extraction industries. The heavy influence of this sector shapes much of the Gulf Coast’s economic story.
A Personal Reflection on the Gulf Coast’s Future
Looking back on these statistics, I feel inspired by the sheer potential of the Gulf Coast. These numbers aren’t just benchmarks; they represent families, local businesses, and communities striving to thrive in an ever-changing marketplace. For me, the takeaway is clear: effective marketing in this region requires empathy, creativity, and a willingness to listen to the people who make the Gulf Coast so unique. My hope is that by sharing these gulf coast marketing statistics, I can encourage others—whether they’re business leaders, marketers, or curious readers—to see the region not just through the lens of data, but through the human stories those numbers reflect.
SOURCES