



18 Sep TOP 20 HORSE MARKETING STATISTICS 2025
I put this roundup of horse marketing statistics together the same way I plan real campaigns—with a cup of coffee, a barn playlist, and a focus on what actually moves the needle. When I say “horse marketing statistics,” I’m not just talking about big numbers; I’m talking about practical signals that tell me where to place creative, when to sponsor live moments, and how to speak to riders with respect for the sport and its welfare standards. As a leading marketing agency in New York, I’ve seen how the right mix of event tentpoles, federation channels, and creator content can turn interest into measurable lift. These insights help me shape offers for returning riders, craft messaging for young female audiences, and time product drops around competition calendars. Most of all, they keep me honest—grounded in data, but always tuned to the community.
Top 20 Horse Marketing Statistics 2025 (Editor’s Choice)
Top 20 Horse Marketing Statistics
| # | Metric | Value | Year / Context |
|---|---|---|---|
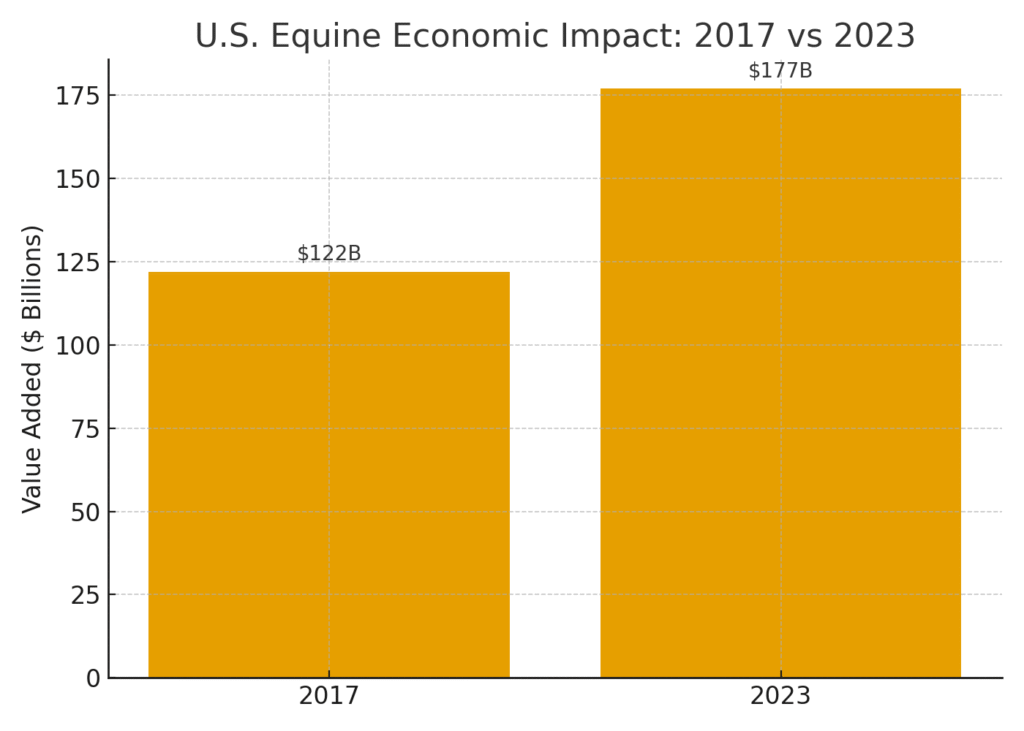
| 1 | 💰Total Economic Impact (U.S.) | $177B | 2023 • Industry value added |
| 2 | 👷Jobs Supported (U.S.) | 2.2M | 2023 • Direct & indirect |
| 3 | 🐎Horse Population (U.S.) | 6.6M | 2023 • All breeds/disciplines |
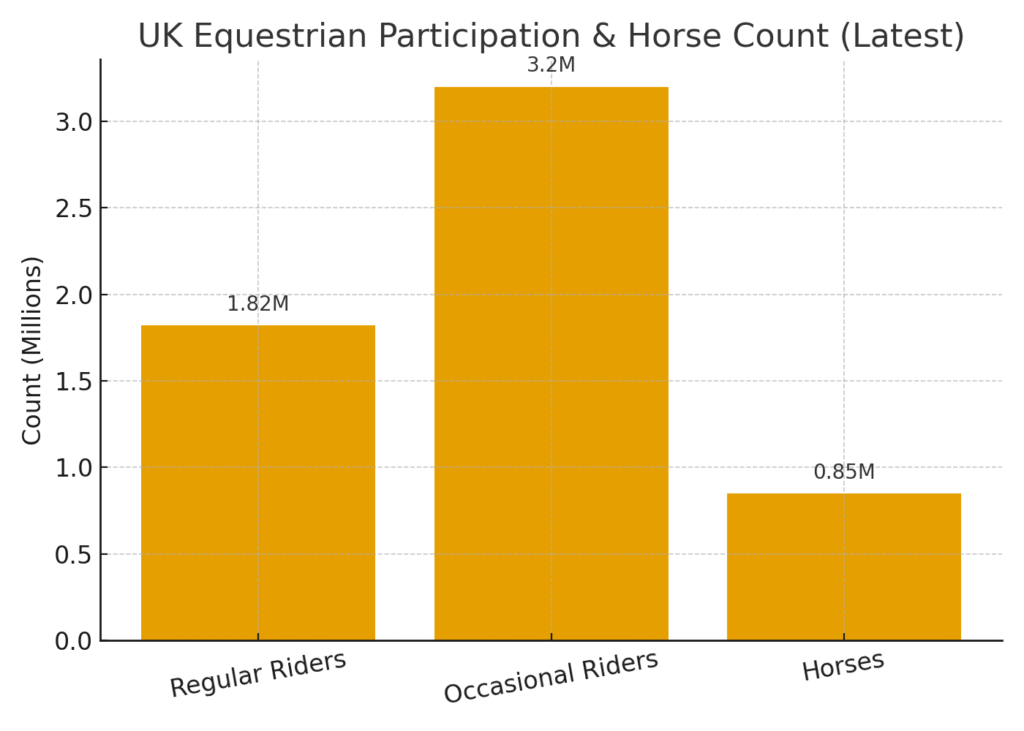
| 4 | 🇬🇧UK Riders & Horses | 1.82M regular • 3.2M occasional • ~850k horses | Latest UK participation |
| 5 | 🔁Ex-Riders WTP Return (UK) | 6M households • 51% want to return | Re-activation opportunity |
| 6 | 📣British Equestrian Digital Reach | 1.73M followers/subscribers | Federation channels |
| 7 | 👩Female Share of UK Regular Riders | 88% • Peak age 16–24 | Audience targeting |
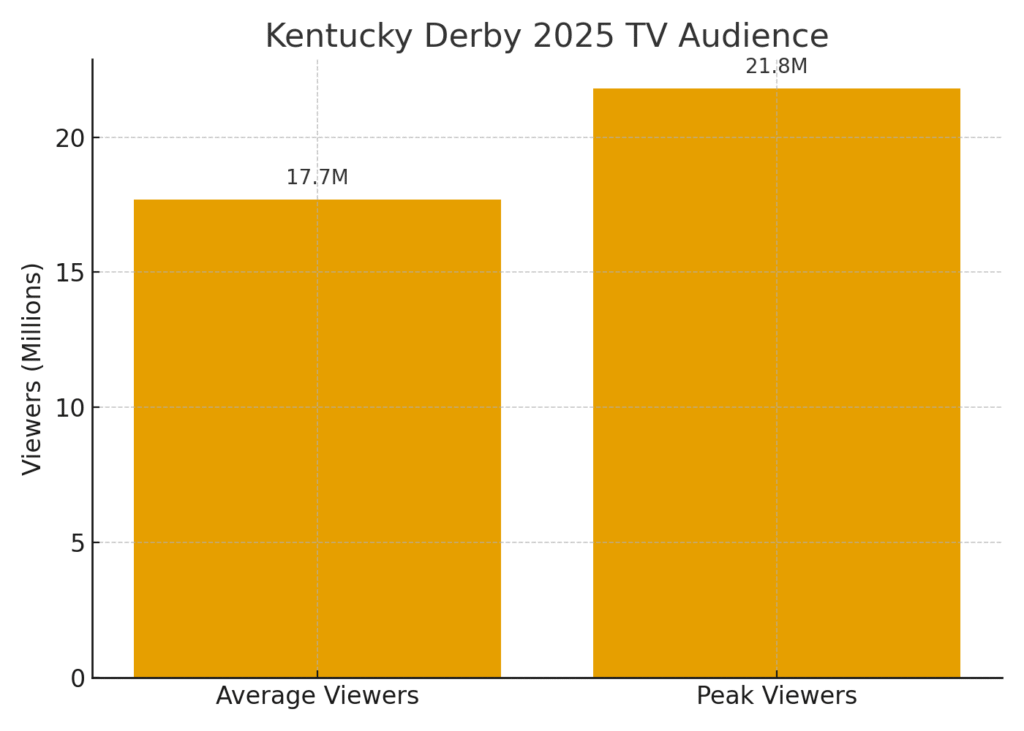
| 8 | 📺Kentucky Derby TV Viewers | 17.7M avg • 21.8M peak | 2025 broadcast |
| 9 | 🎟️Badminton Horse Trials Attendance | ~180,000 | 5-day event (onsite) |
| 10 | 🌍FEI Global Digital Fans | 4M+ | Governing body channels |
| 11 | 📸FEI Instagram Followers | ~570k | @fei_global |
| 12 | 🎵#equestrian on TikTok | ~45.8B views | Creator/UGC potential |
| 13 | 🧑🤝🧑USEF Members & Fans | ~480k | U.S. Equestrian community |
| 14 | 🏆USEF Competition & Reach | 85,970 horses • 275k stream viewers • 1.2M site uniques | 2024 season |
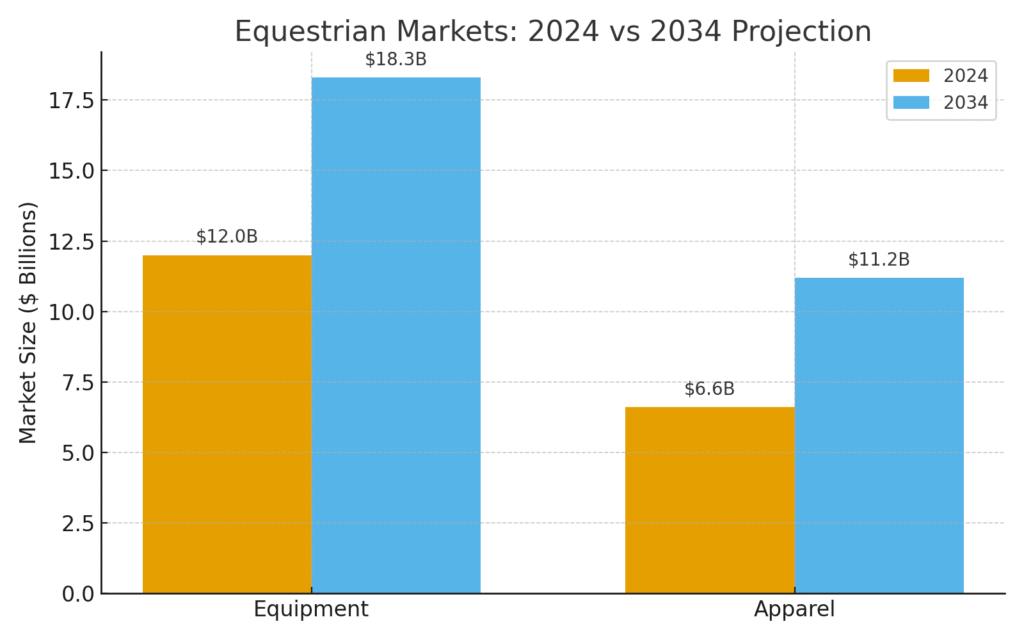
| 15 | 🧰Equestrian Equipment Market | $12B (2024) → $18.3B (2034) • CAGR ~4.3% | Global forecast |
| 16 | 🧥Equestrian Apparel Market | $6.6B (2024) → $11.2B (2034) • CAGR ~5.5% | Global forecast |
| 17 | 🛒Online Riding Gear Sales Growth | CAGR ~8.2% | 2024–2030 • E-commerce tailwind |
| 18 | 📈Equipment Market Incremental Growth | +$3.12B • CAGR ~4.8% | 2024–2028 • Technavio |
| 19 | 🛡️UK Public Sentiment (Welfare/Safety) | 22% don’t support • 58% want more safety | Messaging & sponsorship risk |
| 20 | 📡FEI Media & Partner Momentum | Broadcast & digital viewership up | 2023–2024 • Rights & partnerships |
Top 20 Horse Marketing Statistics 2025
Horse marketing statistics #1: Total Economic Impact (U.S.) — $177B
This headline figure signals that equine is a heavyweight category with national reach. Marketers can justify large-scale campaigns because stakeholders—breeders, events, retailers, media—sit inside this value chain. A $177B footprint attracts non-endemic brands seeking credibility with rural, luxury, and lifestyle audiences. It also supports multi-channel plans spanning broadcast, social, experiential, and affiliate. Use this number in sponsorship decks to anchor why horses deserve premium placements.
Horse marketing statistics #2: Jobs Supported (U.S.) — 2.2M
Two-point-two million jobs means a sprawling partner ecosystem for collaborations and co-marketing. Employment scale also implies persistent purchase cycles in feed, tack, apparel, transport, and services. For advertisers, that translates into many conversion touchpoints from B2B to D2C. It also suggests strong local media opportunities around barns, shows, and regional networks. Highlight this stat to position your brand as a community builder.
Horse marketing statistics #3: Horse Population (U.S.) — 6.6M
A 6.6M herd equals a deep installed base for replacement and upgrade products. Lifecycle marketing works well here—horses age, disciplines change, and gear refreshes. Segment offers by discipline (hunter/jumper, eventing, western, racing) to increase relevance. Geographic clusters enable targeted fulfillment and same-day promotions. Use this figure to forecast TAM for consumables and recurring subscriptions.
Horse marketing statistics #4: UK Riders & Horses — 1.82M Regular, 3.2M Occasional, ~850k Horses
These volumes unlock both core and casual audience strategies. Regular riders convert on performance gear, while occasional riders respond to entry-level bundles and lessons. The horse count indicates sustained demand for veterinary, farrier, and boarding services. Regional messaging should reflect country lifestyles and urban equestrian access points. Treat regular vs. occasional as separate personas in creative and CRM.
Horse marketing statistics #5: Ex-Rider Households (UK) — 6M; 51% Want To Return
Lapsed riders are a goldmine for re-activation campaigns. Friction busters—trial lessons, rental tack, and budget starter kits—can tip them back in. Paid social can target nostalgia and wellness benefits to drive clicks. Partnerships with riding schools create low-risk re-entry paths. Build drip journeys that celebrate “first ride back” milestones.
Horse marketing statistics #6: British Equestrian Digital Reach — 1.73M Followers
Federation channels offer brand-safe, highly qualified reach. Co-branded content can feature athlete stories, training tips, and welfare messages. Use these owned audiences to seed product education and early access drops. Creator whitelisting from federation talent boosts ad trust. Track referral traffic and coupon codes to prove partner ROI.
Horse marketing statistics #7: Female Share Of UK Regular Riders — 88%; Peak Age 16–24
Creative should lean into female-first narratives and fit considerations. The 16–24 peak calls for TikTok, Reels, and mobile-native landing pages. Influencer casting should reflect authenticity, safety, and progression. Offer student pricing and flexible payment plans to reduce entry barriers. Align brand values with welfare and inclusivity to deepen loyalty.
Horse marketing statistics #8: Kentucky Derby TV Viewers — 17.7M Average; 21.8M Peak
This is a mass-reach tentpole perfect for national awareness. Integrations span linear spots, CTV, social live rooms, and second-screen contests. Luxury, beverage, fintech, and travel brands fit the Derby lifestyle halo. Use peak-moment creative to capture attention during post-race highlights. Bundle Derby with shoulder content for cost-effective frequency.
Horse marketing statistics #9: Badminton Horse Trials Attendance — ~180,000
Five days of shoulder-to-shoulder fans means exceptional sampling and CRM capture. Booths should feature experiential demos and quick-scan QR offers. Hospitality works for B2B and high-AOV consumer conversions. Geo-fenced ads can retarget attendees with post-event offers. Collect UGC via hashtags to extend reach long after the event.
Horse marketing statistics #10: FEI Global Digital Fans — 4M+
Global governance brings year-round content and international credibility. Brands can run multilingual campaigns across seasons and championships. Athlete-led education pieces convert well for technical products. Always pair performance claims with clear safety messaging. Use FEI calendars to plan launches around viewership spikes.
Horse marketing statistics #11: FEI Instagram Followers — ~570k
Instagram remains a showcase for motion, kit details, and barn culture. Carousel tutorials and short reels can explain product benefits in context. Shoppable tags reduce steps to purchase from inspiration to checkout. Collaborate with team accounts to amplify limited drops. Track saves and shares as early indicators of demand.
Horse marketing statistics #12: #Equestrian On TikTok — ~45.8B Views
This scale proves equestrian is mainstream on creator platforms. Short-form storytelling—before/after training, day-in-the-life, and barn hacks—performs. Launch a creator brief with safe-handling standards and trending sounds. Spark Ads can extend winning UGC into paid reach. Use comment mining to inform FAQs and product page copy.
Horse marketing statistics #13: USEF Community — ~480k Members & Fans
Membership data offers precise targeting for competitive and aspiring riders. Educational content (rules, conditioning, equipment care) builds trust. Sponsorship of pathways and youth programs enhances brand goodwill. Email partnerships can deliver high-intent traffic to product guides. Align promotions with championship qualifiers for timely relevance.
Horse marketing statistics #14: USEF 2024 Activity — 85,970 Horses; 275k Stream Viewers; 1.2M Site Uniques
These touchpoints enable cross-channel retargeting from stream to site to store. Feature event-specific bundles and limited-edition merchandise. Stream ad units should drive to mobile-optimized PDPs with fast checkout. Post-event highlight reels can anchor always-on creative. Attribute sales using UTMs and unique codes per show.
Horse marketing statistics #15: Equestrian Equipment Market — $12B (2024) → $18.3B (2034), ~4.3% CAGR
A steady CAGR favors long-horizon brand building and repeat purchase models. Subscription replenishment for care and maintenance can lift LTV. Product development should consider durability, fit, and safety certifications. Wholesale strategies can coexist with direct channels when margins are protected. Forecast demand waves around competition seasons and holidays.
Horse marketing statistics #16: Equestrian Apparel Market — $6.6B (2024) → $11.2B (2034), 5.5% CAGR
Apparel growth rewards frequent refreshes and limited drops. Fit diversity, breathable fabrics, and safety innovation drive differentiation. Collaborations with athletes and creators can unlock new demographics. Visual search and size-guides help reduce returns. Loyalty tiers that recognize training milestones encourage repeat buys.
Horse marketing statistics #17: Online Riding Gear Sales — ~8.2% CAGR (2024–2030)
E-commerce acceleration favors fast fulfillment and transparent returns. Invest in PDP video, sizing tools, and barn-tested reviews. Marketplaces broaden reach; brand sites protect margin and data. Bundle essentials (gloves, socks, grooming) to raise AOV. Use email/SMS replenishment cues tied to average usage intervals.
Horse marketing statistics #18: Equipment Market Incremental Growth — +$3.12B (2024–2028), ~4.8% CAGR
This incremental pie funds new entrants and niche categories. Category “white spaces” include youth fit, sustainable materials, and travel solutions. Retailers can expand shelf space for high-velocity accessories. Manufacturers should lock in supply chains to avoid seasonal stockouts. Tie product roadmaps to competition calendars for launch buzz.
Horse marketing statistics #19: UK Public Sentiment — 22% Don’t Support; 58% Want More Safety
Messaging must proactively address welfare, safety, and transparency. Publish safety features and adherence to standards in all creative. Partner with welfare initiatives to build social proof. Crisis-ready comms plans are essential around major events. Use this stat to guide brand suitability checks before sponsorships.
Horse marketing statistics #20: FEI Media & Partner Momentum — Broadcast & Digital Viewership Up
Rising audiences mean inventory scarcity around key meets. Lock-in packages early to secure prime placements. Pair broadcast with digital extensions for full-funnel performance. Measurement should blend brand lift with last-click conversions. Leverage partner storytelling to humanize technical product claims.
A Personal Wrap-Up
Looking over these stats, I’m already mapping out three moves: first, I’ll lock in season-long packages around peak viewing moments to secure premium placements; second, I’ll build creator briefs that blend safety, style, and day-in-the-life authenticity; and third, I’ll set up lifecycle sequences for lapsed riders who just need an easy way back in. I’ll pair broadcast reach with social proof, then close the loop with fast, mobile-ready PDPs and clear returns—because friction kills conversions. I’ll also keep a standing “welfare & safety” section in every deck to earn trust before I earn clicks. If you want, I can turn this into a one-pager or slide deck next—I already have the hooks and headlines in mind.
SOURCES