




20 Sep TOP 20 IMPORTED PRODUCTS MARKETING STATISTICS 2025
In today’s interconnected economy, understanding imported products marketing statistics is more than just reviewing numbers—it’s about grasping the story behind global trade, shifting consumer preferences, and the strategies that help businesses stay competitive. As companies look for smarter ways to expand into international markets, having the right insights becomes crucial for making informed decisions. At the heart of this journey, working with a marketing agency in New York can make all the difference, as they bring the expertise to transform data into real growth strategies. This blog takes you through the most recent and impactful statistics that highlight how imported products are shaping the future of marketing and trade worldwide.
Top 20 Imported Products Marketing Statistics 2025 (Editor’s Choice)
| # | Statistic | Insight |
|---|---|---|
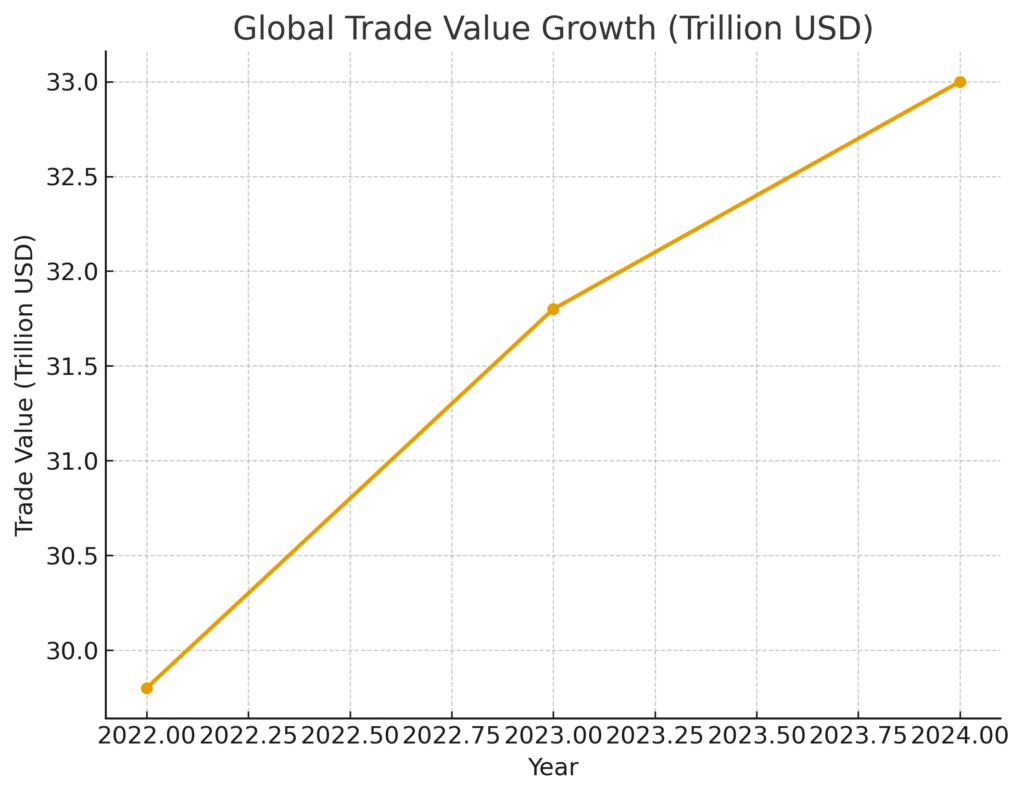
| 1 | Global Trade Value Hits $33 Trillion | In 2024, world trade grew 3.7% YoY, reflecting rising demand across sectors. |
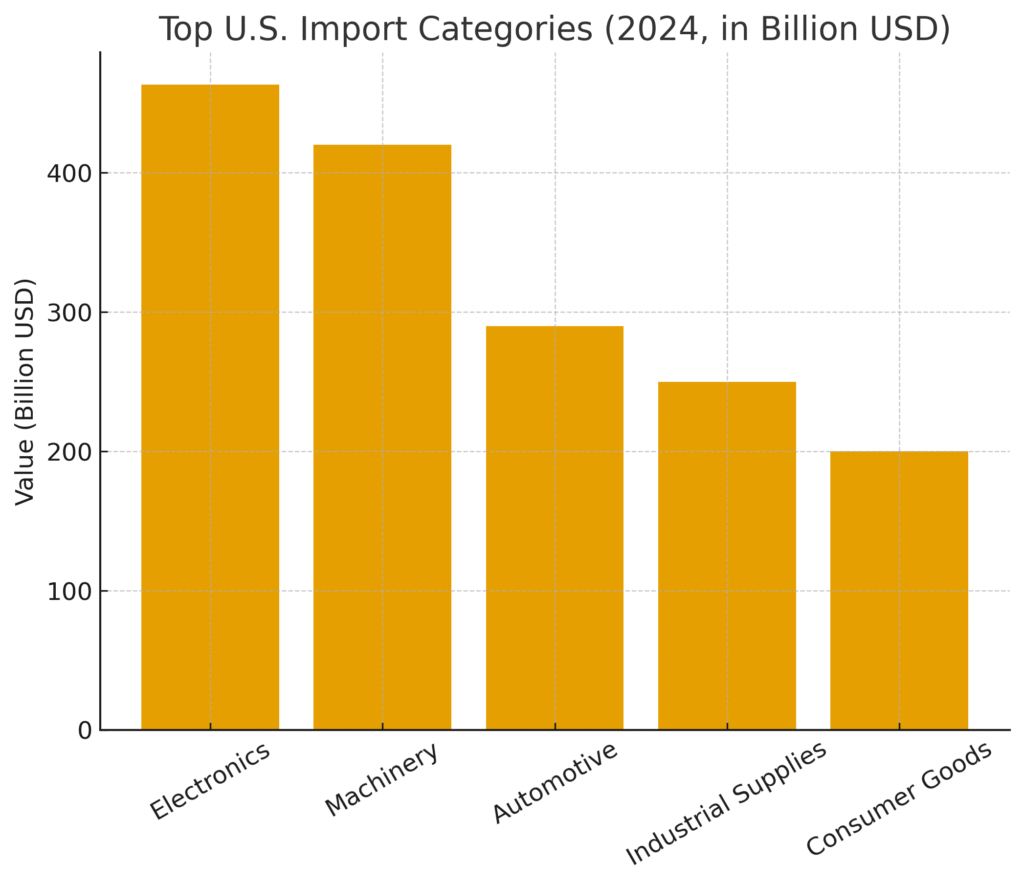
| 2 | Electronics Lead U.S. Imports | Valued at $463.36B, electronics remain the U.S.’s largest import category. |
| 3 | Machinery & Boilers Rank Second | Heavy equipment continues to drive import value and industrial reliance. |
| 4 | U.S. Imports Rise 12.1% YoY | Strong growth in consumer demand and global sourcing boosted import levels. |
| 5 | Trade Deficit Up $161.5B | The U.S. goods & services deficit rose 38.3% compared to the prior year. |
| 6 | Import Prices Up 0.3% in August 2025 | Moderate monthly increases highlight ongoing inflationary pressures. |
| 7 | Non-Fuel Goods Prices Rising | Industrial supplies, capital goods, and consumer goods continue climbing. |
| 8 | Food Imports Decline | Fruit, cocoa, and green coffee imports saw falling prices in 2025. |
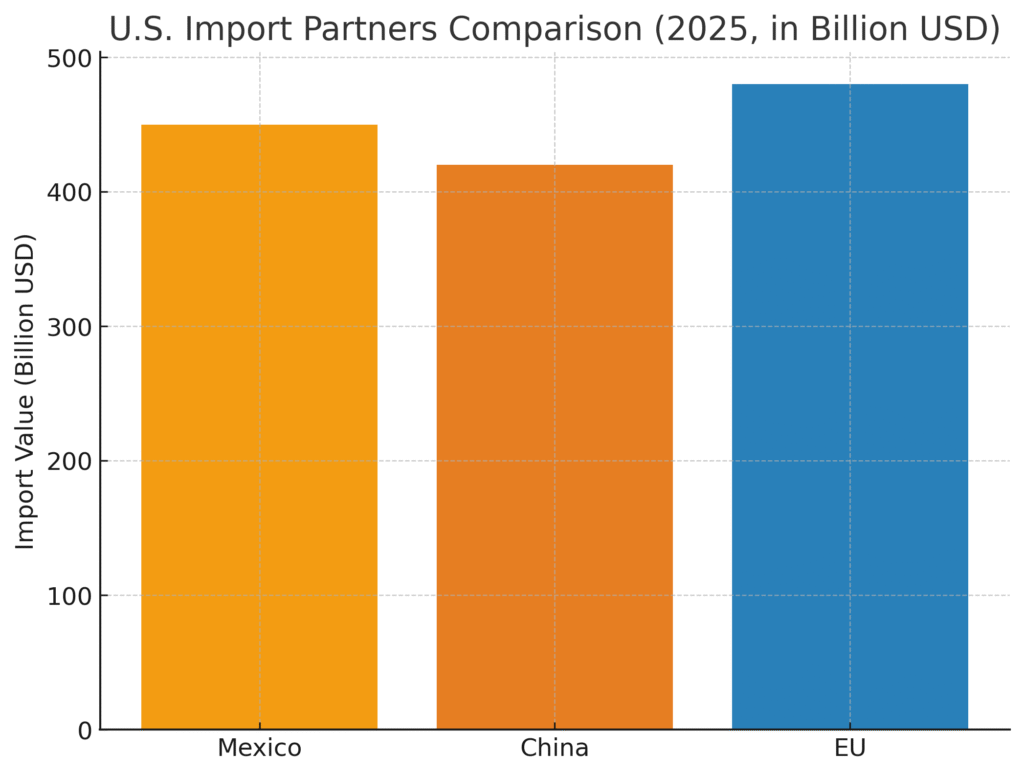
| 9 | Mexico Among Top Import Partners | Mexico remains one of the U.S.’s largest suppliers of imported goods. |
| 10 | Slowdown in Consumer Goods Imports | Growth in consumer goods imports cooled compared to prior years. |
| 11 | E-Commerce Drives Low-Value Imports | Spain’s share of low-value imports rose from 14% to 54% (1997–2023). |
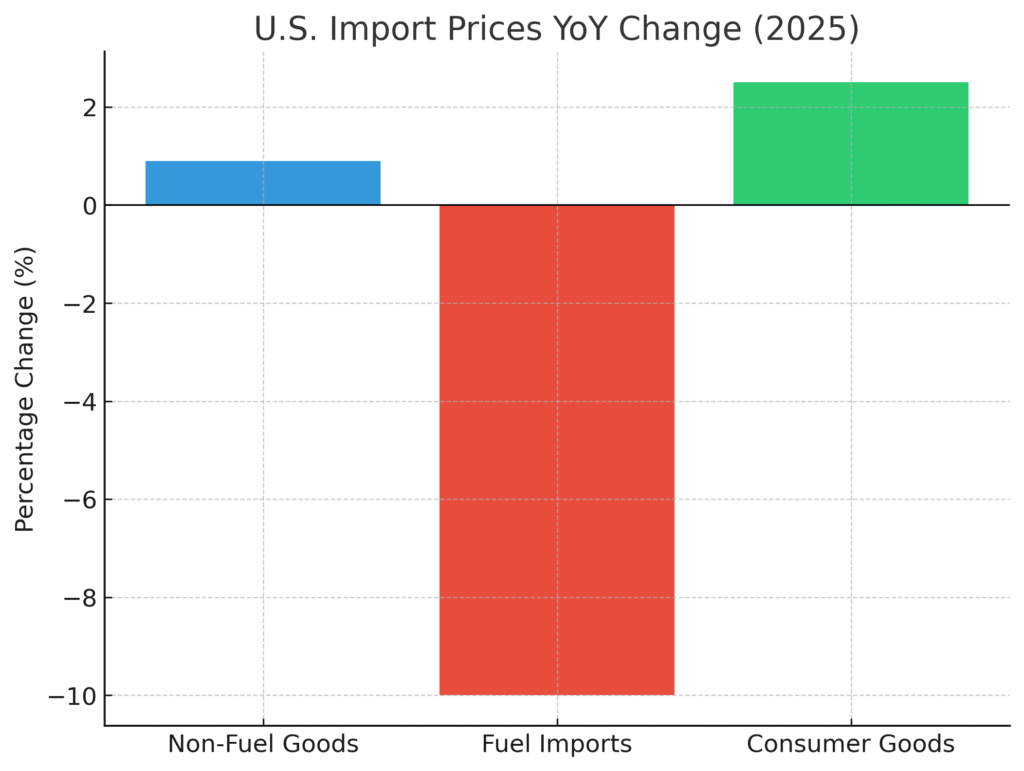
| 12 | Fuel Imports Down ~10% YoY | Falling energy imports offset some gains in other product categories. |
| 13 | Non-Fuel Goods Up 0.9% YoY | Steady growth in essential imports keeps trade balances shifting. |
| 14 | Industrial Supplies Surge | Imports rose $12.5B, led by strong demand for non-monetary gold. |
| 15 | U.S. Deficit Averages $64B Monthly | A three-month average highlights persistent trade imbalances. |
| 16 | Import Volumes Climb | Goods volume grew 12.1% YoY in several key U.S. markets. |
| 17 | Consumer Goods Inflation | Moderate import price hikes affect consumer retail and profit margins. |
| 18 | Tariffs Shift Global Supply Chains | U.S. tariffs redirected Chinese goods to EU markets, altering trade routes. |
| 19 | Automotive Imports Expanding | Vehicles, semiconductors, and capital goods drive new growth trends. |
| 20 | EU Imports Surpass China | U.S. dependence on EU imports rose, outpacing Chinese imports in 2025. |
Top 20 Imported Products Marketing Statistics 2025
Imported Products Marketing Statistics #1: Global Trade Value Hits $33 Trillion
The global trade value reached an impressive $33 trillion in 2024, reflecting a 3.7% year-over-year increase. This steady growth highlights the resilience of international markets despite economic uncertainties. Companies that rely on imports must pay close attention to these shifts to forecast future demand accurately. For marketers, the sheer scale of this figure emphasizes the importance of targeting global audiences. It also shows that businesses investing in imports are operating in one of the world’s most dynamic sectors.
Imported Products Marketing Statistics #2: Electronics Lead U.S. Imports
Electronics remain the largest import category in the United States, valued at $463.36 billion. This dominance reflects the continued consumer demand for gadgets, smartphones, and computing devices. Brands that market imported electronics can benefit from tailoring campaigns toward innovation and connectivity. The high demand in this category also creates competitive pressure for businesses to stand out with unique selling propositions. For marketers, electronics imports represent a chance to leverage consumer interest in cutting-edge technology.
Imported Products Marketing Statistics #3: Machinery & Boilers Rank Second
Machinery, nuclear reactors, and boilers represent another leading U.S. import category. These items are essential for industrial growth, manufacturing, and infrastructure. Their importance in trade indicates that businesses focusing on industrial imports should market efficiency, durability, and innovation. Marketers in this sector often highlight cost savings and advanced engineering as primary selling points. The continued growth of this category reinforces the need for targeted B2B marketing strategies.
Imported Products Marketing Statistics #4: U.S. Imports Rise 12.1% YoY
U.S. imports grew by 12.1% year-over-year, showing how quickly demand for international goods is accelerating. This growth reflects both consumer purchasing power and a reliance on global supply chains. Businesses marketing imported products must adapt quickly to keep up with consumer expectations. For marketers, this rise in imports provides a rich environment for promotions and competitive branding. It also emphasizes the need for consistent monitoring of trade patterns to stay ahead.
Imported Products Marketing Statistics #5: Trade Deficit Up $161.5B
The U.S. trade deficit increased by $161.5 billion, a jump of 38.3% compared to the previous year. While a rising deficit may concern policymakers, for marketers it highlights the volume of imported products reaching American consumers. Businesses can view this as proof of a healthy demand for international goods. Marketers may use this insight to emphasize global sourcing as a strength. It also suggests opportunities for brands that want to fill gaps in domestic supply.
Imported Products Marketing Statistics #6: Import Prices Up 0.3% In August 2025
In August 2025, U.S. import prices rose 0.3% compared to the previous month. This indicates that inflationary pressures remain present in global trade. For marketers, rising costs can affect pricing strategies and profit margins. Transparency about price fluctuations can help build consumer trust. Businesses that communicate value effectively may turn these challenges into opportunities.
Imported Products Marketing Statistics #7: Non-Fuel Goods Prices Rising
Non-fuel goods, such as industrial supplies, capital goods, and consumer products, have shown steady price increases. These categories form the backbone of international trade, and their rising costs affect businesses across sectors. Marketers may highlight efficiency and value when promoting such products. Businesses can also leverage cost-saving campaigns to attract cautious buyers. This trend emphasizes the importance of aligning marketing with global economic conditions.
Imported Products Marketing Statistics #8: Food Imports Decline
Food imports, including items like fruit, cocoa, and green coffee, experienced price declines in 2025. This trend reflects changing global supply and demand dynamics. For marketers, lower food import prices can be positioned as consumer savings. Businesses may also highlight freshness and availability in their marketing efforts. These fluctuations underscore the importance of agility in food and beverage marketing campaigns.
Imported Products Marketing Statistics #9: Mexico Among Top Import Partners
Mexico continues to be one of the U.S.’s top import partners. Its proximity and trade agreements make it a reliable source for goods. Marketers can leverage this relationship by promoting the benefits of accessible supply chains. Highlighting “Made in Mexico” products may also resonate with consumers seeking regional authenticity. This statistic underscores the importance of tailoring strategies based on country-specific partnerships.
Imported Products Marketing Statistics #10: Slowdown In Consumer Goods Imports
Consumer goods imports showed signs of slowing down compared to previous years. While demand remains high, growth has become more moderate. For marketers, this means focusing on quality and differentiation to maintain consumer interest. Businesses may also need to refine their messaging to emphasize long-term value. This slowdown creates opportunities for brands that can stand out through innovative campaigns.
Imported Products Marketing Statistics #11: E-Commerce Drives Low-Value Imports
E-commerce has significantly increased the volume of low-value international imports. In Spain, for instance, low-value imports jumped from 14% to 54% between 1997 and 2023. This shift demonstrates the power of online marketplaces in shaping trade. Marketers can capitalize on this by emphasizing affordability and accessibility. It also highlights how digital platforms are reshaping consumer behavior worldwide.
Imported Products Marketing Statistics #12: Fuel Imports Down ~10% YoY
Fuel imports fell by roughly 10% year-over-year, indicating changes in global energy demand. This decline reflects the growth of alternative energy sources and domestic production. For marketers, the reduced reliance on fuel imports shifts the spotlight to renewable and green energy sectors. Brands in energy-related industries can adjust campaigns to emphasize sustainability. This trend also highlights the importance of diversification in energy marketing strategies.
Imported Products Marketing Statistics #13: Non-Fuel Goods Up 0.9% YoY
Non-fuel goods recorded a 0.9% year-over-year increase in import value. This steady growth shows that essential goods remain central to trade despite challenges. For marketers, it emphasizes the need to showcase reliability and necessity in campaigns. Businesses can use these insights to reassure consumers about product stability. This statistic points to the long-term resilience of non-fuel imports.
Imported Products Marketing Statistics #14: Industrial Supplies Surge
Imports of industrial supplies surged by $12.5 billion, led by non-monetary gold. This increase reflects strong demand in manufacturing and investment sectors. For marketers, highlighting stability and long-term value is crucial in this category. Businesses may also stress the role of industrial imports in supporting infrastructure. This trend shows that marketing strategies for industrial goods must focus on trust and durability.
Imported Products Marketing Statistics #15: U.S. Deficit Averages $64B Monthly
The three-month average U.S. trade deficit stood at $64 billion. This ongoing imbalance shows the heavy reliance on imports. For marketers, this reflects the consistent demand for international products among American consumers. Businesses can use this data to highlight the global nature of their supply chains. It also provides context for understanding consumer access to imported goods.
Imported Products Marketing Statistics #16: Import Volumes Climb
Import volumes for U.S. goods climbed 12.1% year-over-year in certain sectors. This growth reflects rising demand across multiple industries. Marketers can emphasize the availability and variety of products to attract customers. Businesses may also use this data to highlight international partnerships. The continued growth of imports suggests strong opportunities for cross-border campaigns.
Imported Products Marketing Statistics #17: Consumer Goods Inflation
Consumer goods imports showed moderate inflation, putting pressure on pricing strategies. Marketers must balance rising costs with maintaining consumer loyalty. Transparent communication around value and affordability can help businesses thrive. Brands may also promote product durability and efficiency. This inflation trend highlights the importance of trust in marketing messaging.
Imported Products Marketing Statistics #18: Tariffs Shift Global Supply Chains
U.S. tariffs have redirected Chinese goods toward European markets. These policy-driven shifts change the landscape of international trade. For marketers, it means adapting strategies to address evolving supply chains. Businesses may also highlight their adaptability and sourcing diversity. This statistic emphasizes the importance of agility in international marketing.
Imported Products Marketing Statistics #19: Automotive Imports Expanding
Automotive imports, including vehicles and semiconductors, are on the rise. This growth reflects the increasing demand for high-tech and fuel-efficient cars. Marketers in the automotive sector can emphasize innovation and sustainability. Businesses may also highlight global partnerships to attract eco-conscious buyers. This statistic underscores the importance of forward-looking marketing in the automotive industry.
Imported Products Marketing Statistics #20: EU Imports Surpass China
In 2025, U.S. imports from the European Union surpassed those from China. This shift reflects changing global alliances and trade strategies. For marketers, this creates opportunities to emphasize European quality and craftsmanship. Businesses can position themselves by highlighting EU partnerships. This trend reveals the importance of aligning marketing campaigns with new global trade dynamics.
Why These Insights Matter
Looking at these imported products marketing statistics, it’s clear that numbers do more than measure—they reveal opportunities. Whether it’s recognizing how consumer goods shift across borders or identifying where marketing strategies must adapt, these insights give businesses a roadmap for smarter decisions. For brands navigating international markets, the challenge is not just about importing products but about importing the right strategies to meet consumer demand. With the right guidance, businesses can turn global complexities into clear advantages. As you explore these statistics, think about how they can inspire your own approach to growth and international marketing.
SOURCES
- https://www.reuters.com/world/china/us-import-dependence-eu-rise-outpacing-china-study-finds-2025-09-18/
- https://www.investopedia.com/high-tech-imports-jump-despite-tariffs-11809327
- https://www.bls.gov/news.release/ximpim.htm
- https://www.usimportdata.com/blogs/sme-us-import-data-top-imported-products-small-businesses-2025
- https://www.usitc.gov/research_and_analysis/tradeshifts/2021/electronic
- https://www.bea.gov/news/2025/us-international-trade-goods-and-services-july-2025
- https://www.census.gov/econ/overview/mt0100.html
- https://www.tradeimex.in/blogs/import-export?page=1
- https://www.usimportdata.com/us-import-data
- https://www.census.gov/foreign-trade/
- https://www.wto.org/english/blogs_e/data_blog_e/blog_dta_20nov24_e.htm
- https://tradingeconomics.com/united-states/balance-of-trade
- https://apnews.com/article/eaee6cec8bb3cadc1103ba60f986b76e
- https://www.strikingly.com/blog/posts/import-products-successfully-tips-strategies-streamlining-your-import-process
- https://www.tendata.com/blogs/import/4298.html
- https://www.usitc.gov/research_and_analysis/trade_shifts_2019/electronic.htm
- https://statrys.com/blog/global-trade-trends