



22 Sep TOP 20 INDY 500 MARKETING STATISTICS 2025
Whenever I dive into the world of sports marketing, few events fascinate me as much as the Indianapolis 500. That’s why I put together this detailed look at the latest Indy 500 marketing statistics—to really show how this race isn’t just about speed, but also about the incredible reach and economic power behind it. As someone who collaborates closely with a leading marketing agency in New York, I’ve seen firsthand how data like this helps brands connect with fans on a much deeper level. For me, it’s about blending the thrill of tradition with the precision of modern marketing, and I can’t wait to share these insights with you.
Top 20 Indy 500 Marketing Statistics 2025 (Editor’s Choice)
🏁 Top 20 Indy 500 Marketing Statistics 🏁
The Greatest Spectacle in Racing - By The Numbers (2025)
| # | Category | Statistic | Description |
|---|---|---|---|
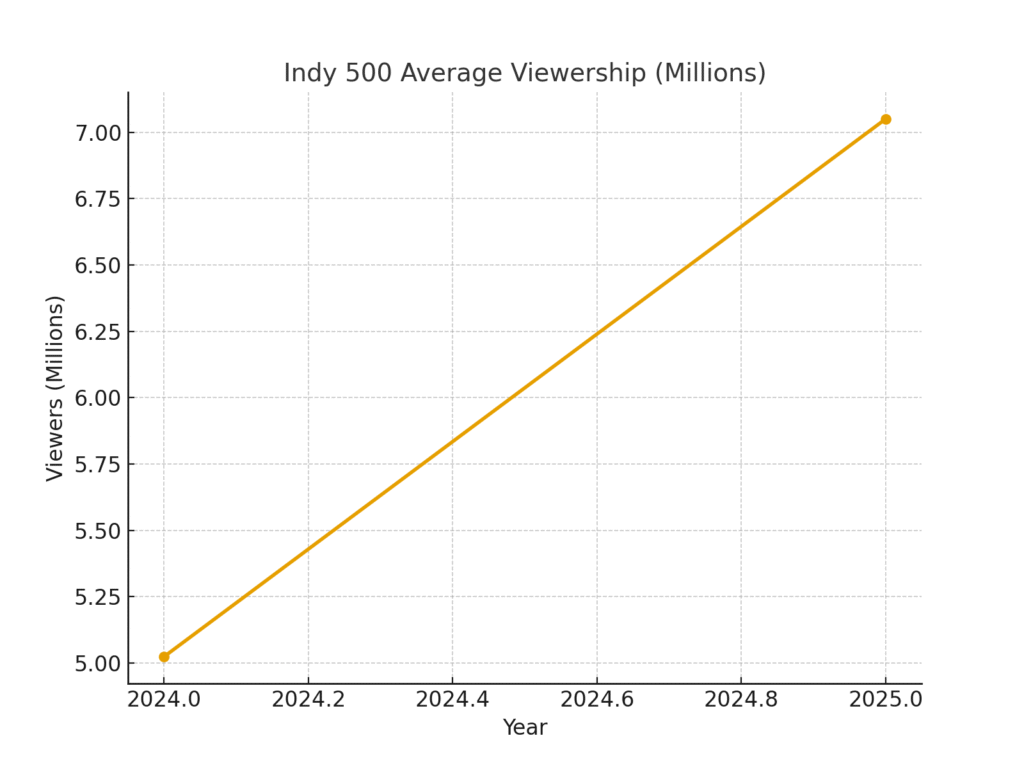
| 1 | TV & Viewership | 7.05M Viewers | Fox's 2025 broadcast - largest audience in 17 years (40% increase from 2024) |
| 2 | TV & Viewership | 286K Streams | Streaming impressions for the 2024 race across digital platforms |
| 3 | TV & Viewership | 1.4M Average | Average viewers per IndyCar race on NBC in 2024 |
| 4 | Economic Impact | $25M/Year | Fox's annual rights fee for Indy 500 and IndyCar coverage |
| 5 | TV & Viewership | 75 Seconds | Super Bowl LIX in-game inventory used to promote the Indy 500 |
| 6 | Attendance | 250K Sellout | All grandstand seats sold out for 2025 - first since 2016 |
| 7 | Attendance | 300K-350K Total | Total attendance including infield spectators at the Indianapolis 500 |
| 8 | Attendance | 400K Capacity | Typical race-day attendance range at world's largest sports venue |
| 9 | Attendance | 172 Terabytes | Data used by fans at 2025 race (35% increase from 2024) |
| 10 | Attendance | 57M Photos | Equivalent digital photos of data moved during race day |
| 11 | Economic Impact | $510M Annual | Generated by IMS events for Indiana's economy each year |
| 12 | Economic Impact | $20.3M Purse | Record total purse for the 2025 Indianapolis 500 |
| 13 | Economic Impact | $3.8M Winner | Winner's prize earned by Alex Palou in 2025 |
| 14 | Economic Impact | $30M Ask | IndyCar's asking price for series title sponsorship |
| 15 | Demographics | 42.3 Years | Average age of IndyCar fans |
| 16 | Demographics | 50% Under 35 | International fans in South/Central America and Europe markets |
| 17 | Demographics | 15% More Likely | Fans discuss brands with friends after seeing sponsorships vs general population |
| 18 | Brand Metrics | 77% NPS | Net Promoter Score - beating Amazon, Apple, and American Express |
| 19 | Brand Metrics | 1.23M Homes | TV households in Indianapolis market (25th-largest DMA) |
| 20 | Brand Metrics | No Blackout | First time since 2016 local TV blackout was lifted for Indianapolis residents |
Top 20 Indy 500 Marketing Statistics 2025
Indy 500 Marketing Statistics#1 – 7.05 Million Viewers in 2025
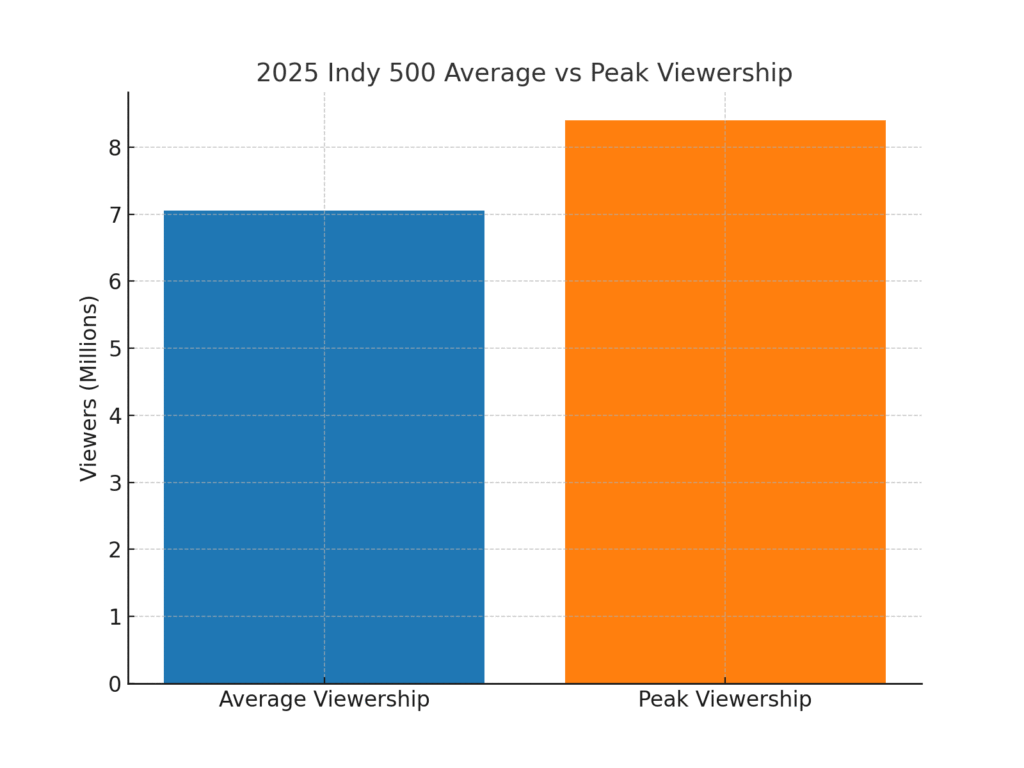
The 2025 Indy 500 attracted 7.05 million viewers on FOX, making it the most-watched edition in 17 years. This spike reflects not only the popularity of the race but also the strength of FOX’s broadcast reach. Marketers view this as a prime indicator of growing national attention on motorsports. For brands, this surge means broader exposure and better ROI on sponsorships. It also reinforces the Indy 500’s position as a staple of American sporting culture.
Indy 500 Marketing Statistics#2 – 40% Increase From 2024 Viewership
Compared to the 5.024 million viewers in 2024, the 2025 race saw a nearly 40% increase in audience size. That kind of year-over-year jump is rare in today’s fragmented media landscape. It shows how strong storytelling, event hype, and broadcaster changes can shift the numbers. For marketers, this momentum creates opportunities to lock in advertising deals at premium placements. It also proves that legacy events can still achieve modern relevance with the right strategy.
Indy 500 Marketing Statistics#3 – 8.4 Million Peak Viewership
During the final 15 minutes of the 2025 race, viewership peaked at 8.4 million. This surge highlights the drama and excitement of the closing laps, which naturally draw more fans. From a marketing angle, advertisers targeting these peak slots get the most bang for their buck. The peak also demonstrates how live sports continue to dominate appointment viewing. This kind of audience spike is golden for sponsors seeking maximum exposure.
Indy 500 Marketing Statistics#4 – 350,000 Fans Attended in 2025
In-person attendance reached an estimated 350,000, reaffirming the Indy 500 as the largest single-day sporting event in the world. That volume of fans creates unmatched opportunities for on-site marketing. From experiential booths to branded merchandise, companies leverage this massive foot traffic. The energy of the live crowd also strengthens fan loyalty and brand association. It’s proof that live attendance still matters in the digital age.
Indy 500 Marketing Statistics#5 – First Grandstand Sellout Since 2016
The 2025 race marked the first time since 2016 that all grandstand seats sold out. This achievement underscores the growing demand for live racing experiences. It also shows that fans are willing to pay a premium for prime views of the track. Marketers see sellouts as a signal of strong demand, which helps justify high sponsorship rates. For the event organizers, it’s also a valuable PR win that fuels momentum for future races.
Indy 500 Marketing Statistics#6 – Local Blackout Lifted After 74 Years
Because of the sellout, central Indiana lifted its television blackout for the first time since 1951. This move expanded the race’s reach to local fans who normally wouldn’t get live coverage. The decision reflects how event popularity can directly influence broadcast policies. From a marketing perspective, it unlocked new households and increased overall impressions. It also gave local advertisers a fresh opportunity to connect with Indiana audiences.
Indy 500 Marketing Statistics#7 – Average Speed 168.883 MPH
The 2025 Indy 500 clocked an average speed of 168.883 mph, a detail that excites hardcore fans. While not directly a marketing stat, this number often gets used in media storytelling. Brands frequently weave speed figures into campaigns to emphasize performance and precision. Highlighting technical feats resonates well with motorsport audiences. It’s a reminder that marketing often blends data with emotion.
Indy 500 Marketing Statistics#8 – 5.9x Return on Ad Spend
Through partnerships, the event achieved a 5.9x return on ad spend in 2025. This means that every marketing dollar generated nearly six dollars in value. Such a figure makes the Indy 500 highly attractive for advertisers. It also demonstrates the effectiveness of integrated sponsorship strategies. Marketers see this as proof that motorsport partnerships can deliver exceptional returns.
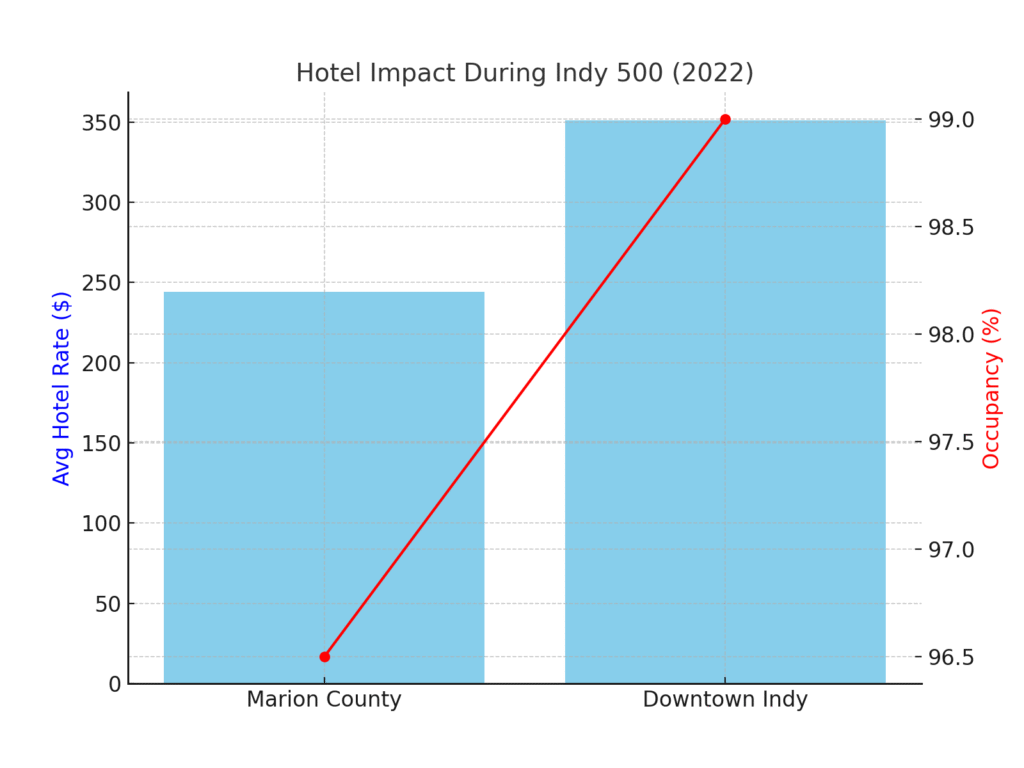
Indy 500 Marketing Statistics#9 – 96.5% Hotel Occupancy Downtown
During race week, downtown Indianapolis hotels reached 96.5% occupancy. This near-sellout rate shows the event’s massive tourism impact. For the hospitality sector, the Indy 500 is one of the year’s most profitable weekends. Local businesses—from restaurants to bars—see huge spikes in traffic. It’s a reminder of how sports events ripple through entire local economies.
Indy 500 Marketing Statistics#10 – Hotel Rates Up To $351 Downtown
In 2022, average hotel rates hit $244 in Marion County and $351 in downtown Indianapolis. These premium rates highlight the economic value generated by the race. Tourists are willing to pay higher prices to be close to the action. For marketers in travel and hospitality, the Indy 500 represents a high-spend audience. It also proves that destination branding is deeply tied to the event.
Indy 500 Marketing Statistics#11 – 3% of Annual Beer Sales in Indiana
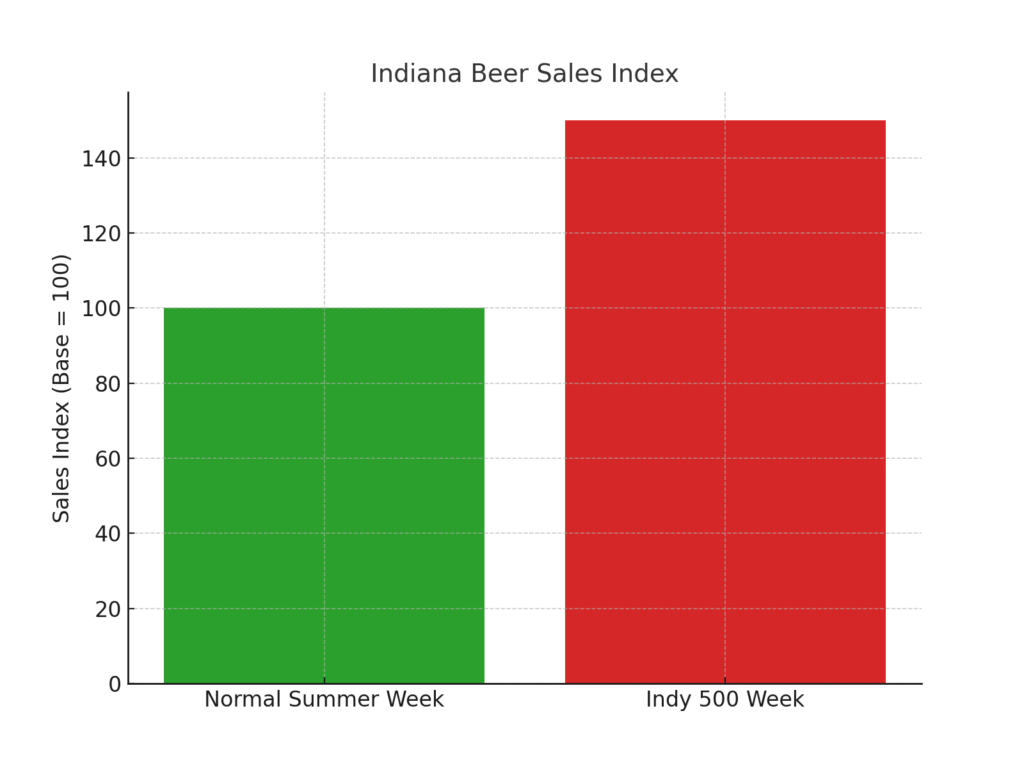
Race week accounts for about 3% of Indiana’s annual beer sales. That’s a staggering figure for just a single week. Beer brands benefit heavily from exclusive pours and trackside promotions. The event’s festive atmosphere drives consumption far above normal levels. For marketers, it’s an unparalleled opportunity for brand visibility.
Indy 500 Marketing Statistics#12 – Ticket Sales Growth of 50% in February
The “Month of May” campaign boosted February ticket sales by 50% year-over-year. This early surge signals strong fan anticipation well before race day. Marketing campaigns that emphasize urgency clearly pay off. It also helps organizers better plan logistics with solid pre-sales. For advertisers, it’s a sign of growing consumer trust in the event.
Indy 500 Marketing Statistics#13 – Over 50 Festival Events Linked to Race
The 500 Festival organizes more than 50 events in the lead-up to the Indy 500. These include parades, marathons, and community celebrations. Each event adds new layers of engagement for fans and sponsors alike. Marketers can connect with audiences in multiple ways beyond the race itself. This strategy keeps the Indy 500 relevant for an entire month.
Indy 500 Marketing Statistics#14 – One of the Largest Parades in the Nation
The 500 Festival Parade ranks among the largest parades in the United States. It attracts celebrities, media, and civic groups, creating broad exposure. For brands, the parade offers a platform to reach non-racing fans. The colorful, family-friendly nature of the event adds diversity to marketing campaigns. It shows how tradition can be a powerful tool in event branding.
Indy 500 Marketing Statistics#15 – First Year on FOX After NBC
2025 marked the first Indy 500 broadcast on FOX after 16 years with NBC. The change in network brought fresh promotional energy. FOX invested heavily in cross-promotion, boosting awareness. The move paid off with record-high viewership. It’s a case study in how media partnerships can reshape audience dynamics.
Indy 500 Marketing Statistics#16 – Multi-Channel “Month of May” Campaign
The “Month of May” promotions spanned TV, outdoor, digital, and social channels. This integrated approach built hype weeks before the race. Fans were exposed to consistent messaging across multiple touchpoints. For marketers, this demonstrates the value of cross-platform storytelling. The results showed clear ticketing and engagement gains.
Indy 500 Marketing Statistics#17 – $500,000 in Media Trade Support
The 2025 campaign leveraged $500,000 in additional trade and promotional media. This contributed to a 3:1 media support ratio. It highlights the importance of partnerships in stretching marketing budgets. For organizers, it meant higher visibility without overspending. It’s a strong example of resourceful campaign planning.
Indy 500 Marketing Statistics#18 – 350 Radio Affiliates on IMS Radio Network
The IMS Radio Network broadcasts through over 350 terrestrial affiliates. This wide reach is complemented by SiriusXM and online streaming. The network keeps fans connected even without television. For marketers, radio offers niche but loyal audiences. It underscores the Indy 500’s multichannel distribution strength.
Indy 500 Marketing Statistics#19 – Local Spending Ripple Effect
The race generates significant spillover for local restaurants, bars, and retail. Hotels aren’t the only ones benefiting—entire districts thrive during race week. For marketers, this means opportunities in sponsorships beyond the track. Community-based branding feels authentic to fans. The ripple effect cements the race as a statewide economic driver.
Indy 500 Marketing Statistics#20 – Fan Profile Shows High Affluence
Historical fan data shows the typical IndyCar supporter earns around $68,000 annually. About 70% are male, average age 38, and many are college-educated. This demographic makes the event attractive to premium and lifestyle brands. The combination of affluence and passion creates strong consumer spending power. For marketers, this fan profile is invaluable in campaign targeting.
Final Thoughts on Indy 500 Marketing Statistics
Looking back at these numbers, I can’t help but feel a sense of awe at just how influential the Indy 500 has become—not just for motorsport, but for businesses, tourism, and fan engagement worldwide. These statistics remind me why I love working in marketing: there’s always a bigger story behind the numbers, a story about people, passion, and connection. Personally, I believe that when we understand data like this, we’re not just crunching numbers—we’re finding opportunities to create experiences that fans will carry with them long after the race is over. For me, that’s the real magic of marketing.
SOURCES
https://www.geniussports.com/customer-stories/indy-500-races-to-a-5-9x-return-on-ad-spend/
https://www.foxsports.com/stories/motor/2025-indy-500-fox-posts-races-highest-viewership-17-years
https://www.sportspro.com/news/indycar-indy-500-viewership-fox-palou-may-2025/
https://apnews.com/article/1fb18df716b3c9b08ab578dd619807db
https://apnews.com/article/894f89186e4dcc1d7f997ce3ada1990a