




17 Sep TOP 20 INVESTOR MARKETING STATISTICS 2025
In today’s fast-paced financial world, staying ahead of trends isn’t just important—it’s essential. That’s why exploring the latest investor marketing statistics gives us a window into how businesses, investors, and financial brands connect with their audiences in 2025. Whether it’s understanding the rise of digital ad spend, the growing impact of mobile searches, or the unmatched ROI of email campaigns, these insights help sharpen strategies and uncover opportunities. As someone who’s watched the industry evolve, I know how valuable it is to align with professionals who truly understand these shifts. That’s why working with a leading marketing agency in New York can make all the difference when it comes to turning data into results.
Top 20 Investor Marketing Statistics 2025 (Editor’s Choice)
📊 TOP 20 INVESTOR MARKETING STATS
Essential Statistics for 2024-2025 | Data-Driven Insights for Modern Investors
| # | Category | Key Statistic & Insight |
|---|---|---|
1 |
Market Size
IR Solutions Growth
|
$2.25B → $4.10B by 2033
Investor Relations Solutions Market growing at 7.1% CAGR, highlighting massive demand for professional IR tools and services.
|
2 |
Market Investment
Data-Driven Marketing
|
$36 Billion Investment
Data-driven marketing investments forecast to exceed $36 billion in 2024, showing commitment to analytics-based strategies.
|
3 |
Total Market
US Ad Spending
|
$570 Billion (+10.7%)
U.S. marketing and advertising spending projected to reach $570 billion with double-digit growth year-over-year.
|
4 |
Digital Growth
Global Digital Marketing
|
$363B → $1,099B by 2032
Digital marketing market experiencing explosive growth from $363.05 billion to over $1 trillion by 2032.
|
5 |
IR Strategy
Investor Targeting
|
76% of IROs Focus
Three-quarters of Investor Relations Officers prioritizing investor targeting and engagement as their top 2024 initiative.
|
6 |
Storytelling
Company Narrative
|
61% Story Crafting
Over 60% of IROs dedicating more time to crafting and perfecting their company's investment story in 2024.
|
7 |
Events
Capital Markets Days
|
20% Event Success
One in five IROs cite facilitating capital markets days or investor events as their biggest 2023 accomplishment.
|
8 |
Tool Investment
IR Technology
|
80%+ Spending Increase
Over 80% of publicly traded companies increasing spending on investor relations tools and resources.
|
9 |
ROI
Marketing Returns
|
$5 Return Per $1 Invested
Digital marketing delivers exceptional ROI with businesses earning $5 for every dollar invested in digital channels.
|
10 |
Search Marketing
Highest ROI Channels
|
50%+ Companies
Over half of companies identify search-related activities (SEO, PPC, content) as their highest ROI marketing investments.
|
11 |
MarTech Impact
Technology Investment
|
18% Greater Sales Lift
Organizations investing more in martech see 18% greater sales lift and 7% better revenue growth than traditional media spenders.
|
12 |
AI Performance
Sales with AI
|
83% vs 66% Growth
Sales teams using AI achieve 83% revenue growth compared to 66% for non-AI teams, showing clear competitive advantage.
|
13 |
Content Creation
AI Adoption
|
42% Daily AI Usage
Nearly half of marketing leaders use AI tools several times per week or daily for content generation in 2024.
|
14 |
Idea Generation
AI for Creativity
|
54% Use AI Ideas
Content marketers increasingly rely on AI for idea generation, up from 43% to 54%, revolutionizing creative processes.
|
15 |
Video Dominance |
29.18% Short-Form Video
Short-form video leads content marketing at 29.18%, followed by images (28.95%) and interviews (21.64%).
|
16 |
LinkedIn Effectiveness |
40% Rate LinkedIn #1
Two-fifths of B2B marketers identify LinkedIn as the most effective channel for driving high-quality leads.
|
17 |
LinkedIn Usage |
89% Use LinkedIn
Nearly 9 in 10 B2B marketers use LinkedIn for lead generation, with 62% reporting effective results.
|
18 |
Revenue Allocation
Marketing Budgets
|
4-10% Revenue Share
Nearly half of companies allocate 4-10% of their total revenue specifically to marketing initiatives and campaigns.
|
19 |
Budget Growth
Increased Investment
|
63% Budget Increases
Nearly two-thirds of businesses have already increased their digital marketing budgets, showing confidence in digital ROI.
|
20 |
YoY Growth
Spending Trends
|
10% Growth Rate
Digital marketing budget spending across all businesses grew by 10% between 2023 and 2024, indicating strong market momentum.
|
Top 20 Investor Marketing Statistics 2025
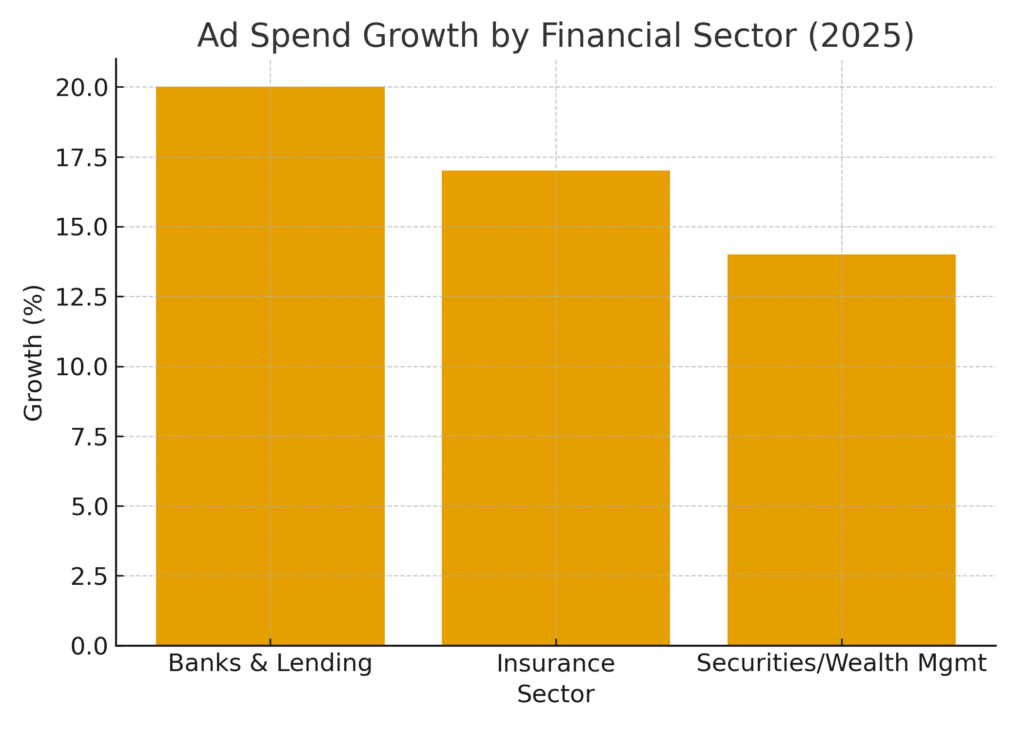
Investor Marketing Statistics #1: Securities, Investment, And Wealth Management Ad-Spend Growth At 14%
The securities, investment, and wealth management sector is projected to increase ad spend by around 14% in 2025. This surge reflects the competitive landscape where financial brands are eager to capture more digital attention. Firms are recognizing that staying visible online is no longer optional but a necessity to attract both retail and institutional investors. This growth also highlights the expanding role of tailored campaigns targeting affluent audiences. Ultimately, the 14% rise underscores how financial marketing budgets are aligning with digital-first strategies.
Investor Marketing Statistics #2: Banks And Lending Sector Ad Spend To Increase By 20%
Banks and lending companies are expected to boost their marketing budgets by 20% in 2025. This reflects growing competition in consumer lending, mortgages, and credit products. With interest rates fluctuating, financial institutions know they must attract and retain borrowers more aggressively. Digital channels, particularly targeted search and display ads, are central to this growth. The increase demonstrates how banks see marketing as a key driver for growth in a crowded field.
Investor Marketing Statistics #3: Insurance Industry Ad Spend To Grow By 17%
The insurance industry is set to raise its marketing spend by 17% in 2025. Rising customer demand for personalized policies is fueling the need for greater outreach. Companies are also focusing on digital transformation, making online engagement a bigger priority than traditional channels. With new players entering the market, competition is heating up and advertising spend reflects that pressure. This trend shows how marketing remains central to growth in the insurance sector.
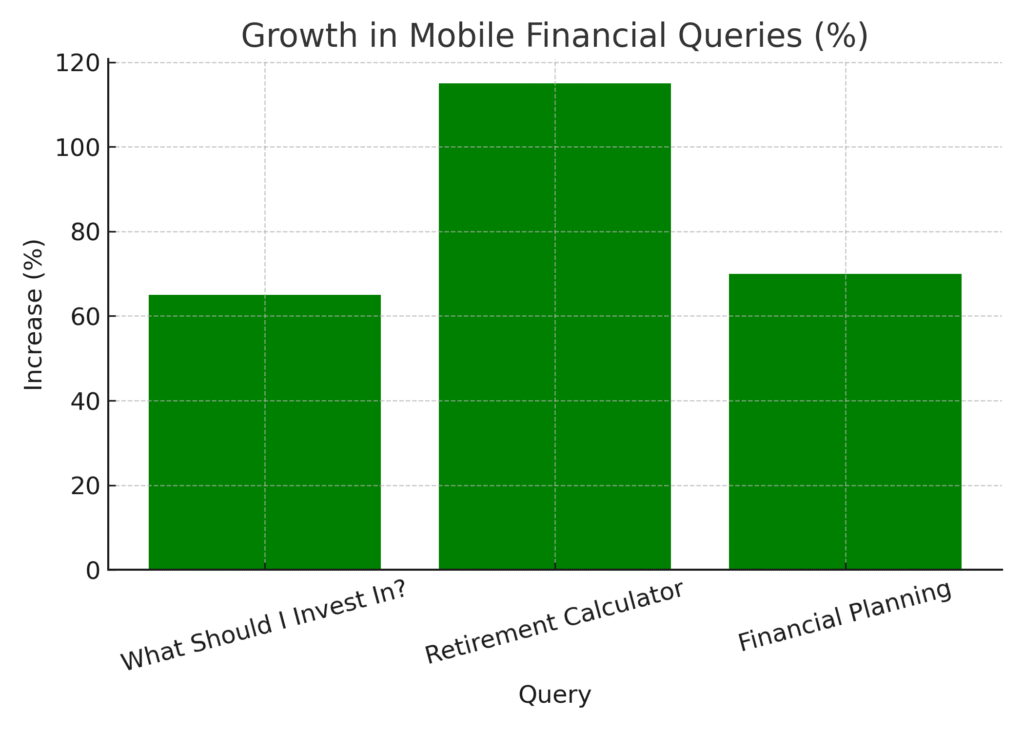
Investor Marketing Statistics #4: Mobile Queries For “What Should I Invest In?” Rose 65%
Mobile searches asking “what should I invest in?” have increased by 65% year-over-year. This growth highlights how more people are relying on their smartphones to guide financial decisions. It also reflects the accessibility of investment information through search engines and financial platforms. For marketers, this presents a chance to capture audiences at the very start of their investment journey. Brands that appear in these searches have a clear advantage in shaping perceptions.
Investor Marketing Statistics #5: Mobile Queries For “Retirement Calculator” Increased 115%
Over the last two years, mobile queries for “retirement calculator” jumped by 115%. This shows that individuals are actively planning for long-term financial security. The surge suggests a wider interest in accessible digital tools that simplify retirement planning. For marketers, providing these tools or optimizing content around them is a way to drive valuable engagement. The trend indicates that financial literacy tools are becoming powerful lead-generation assets.
Investor Marketing Statistics #6: 90% Of Loan And Mortgage Consumers Start Online
A staggering 90% of loan and mortgage consumers now begin their journey online. This demonstrates the critical importance of search engines and digital content in financial marketing. It also shows how traditional in-branch channels are no longer the first point of contact for most. Marketers need to meet customers where they start—on Google and financial comparison platforms. The trend further validates the dominance of digital-first strategies in investor marketing.
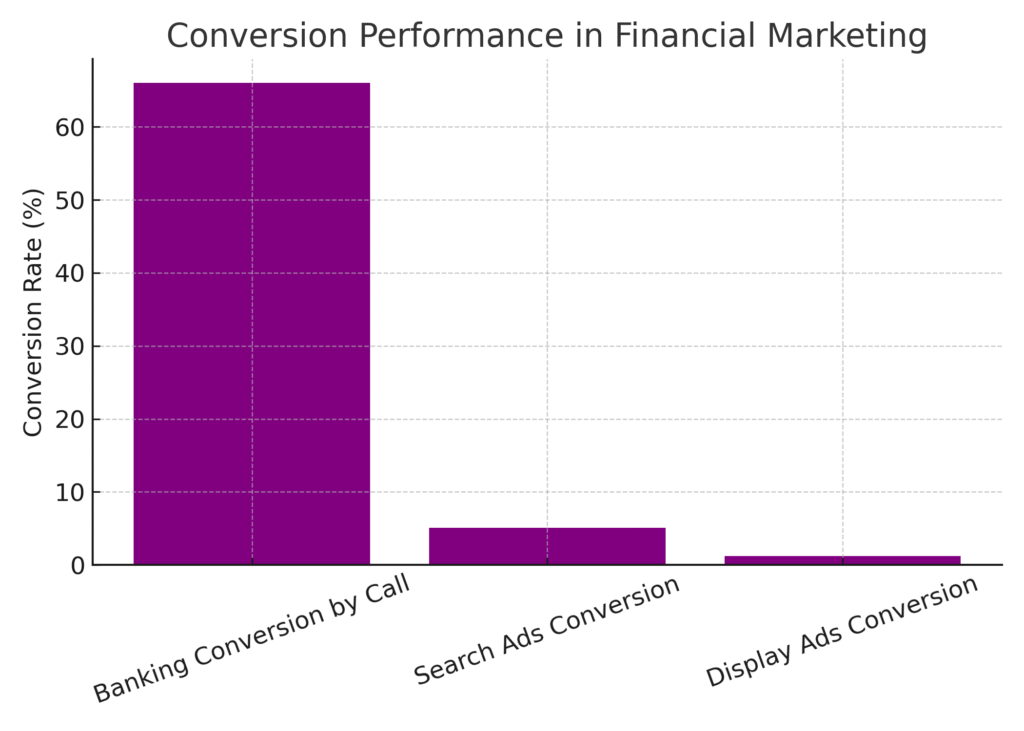
Investor Marketing Statistics #7: 66% Of Banking Consumers Convert By Calling
Two-thirds of banking consumers—66%—complete a purchase or conversion via phone calls. This indicates that while journeys may begin online, human interaction is still crucial for trust. Phone calls offer reassurance and clarity in complex financial decisions. For marketers, tracking call performance is as important as digital lead tracking. This hybrid model emphasizes the need for both online and offline integration.
Investor Marketing Statistics #8: Phone Calls Convert To Higher Revenue Than Web Leads
In financial services, phone calls typically generate more revenue than web-based leads. This reflects the complexity and high value of financial transactions. Customers often prefer speaking directly before committing large sums of money. For marketers, optimizing campaigns to drive call conversions can significantly lift ROI. It shows that blending digital acquisition with traditional communication yields stronger outcomes.
Investor Marketing Statistics #9: Caller Retention Rate 28% Higher Than Web Leads
Retention rates for callers are 28% higher compared to web leads. This underlines the long-term value of phone-based conversions. Customers who call tend to form stronger, trust-based relationships with financial institutions. For marketers, focusing on call-driving campaigns means not just higher revenue, but better retention. It highlights the importance of human connection in sustaining investor confidence.
Investor Marketing Statistics #10: 50% Of Banks Do Not Measure ROI For Marketing
Shockingly, more than 50% of banks either do not measure ROI for their marketing or track it in less than 25% of campaigns. This gap shows a lack of data-driven decision-making in the sector. Without measuring ROI, marketing budgets risk being misallocated. For savvy marketers, this represents an opportunity to outpace competitors with clear tracking. It emphasizes how analytics and performance measurement are essential for sustainable growth.
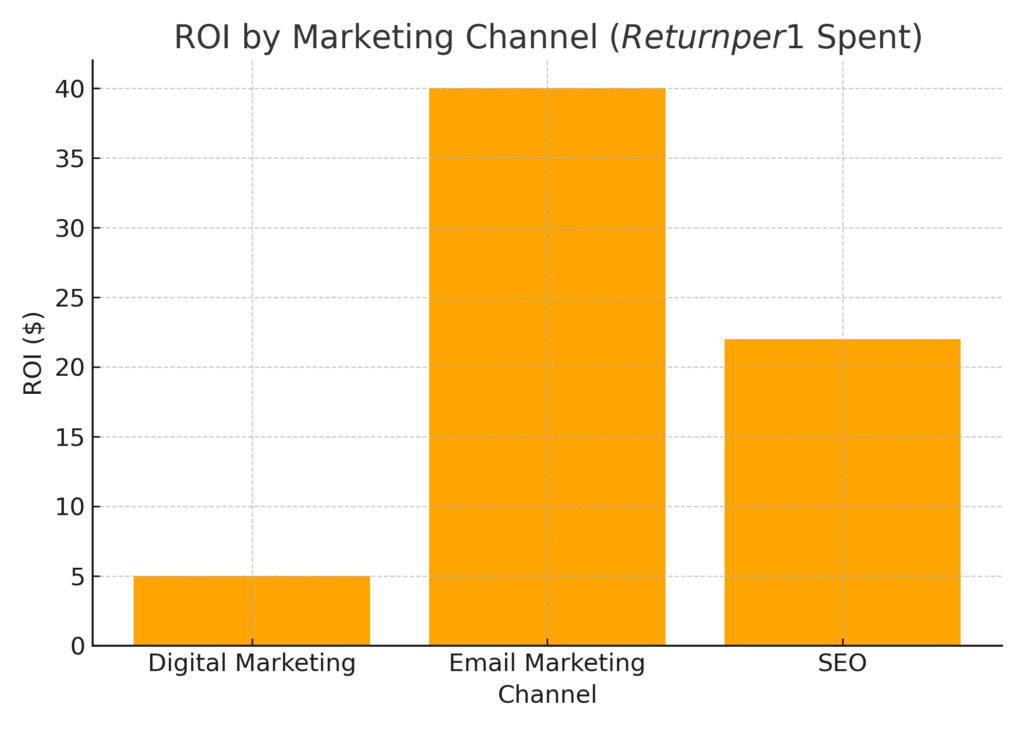
Investor Marketing Statistics #11: Digital Marketing ROI At $5 Per $1 Spent
Across industries, digital marketing delivers an average of $5 for every $1 spent. For financial and investment brands, this highlights the effectiveness of digital channels compared to traditional methods. The high ROI encourages financial institutions to scale up digital campaigns. It also underscores why more firms are allocating bigger budgets to online channels. Ultimately, this metric reaffirms the efficiency of digital-first approaches.
Investor Marketing Statistics #12: Email Marketing ROI At $40 Per $1 Spent
Email marketing continues to lead ROI metrics, delivering $40 to $42 for every $1 invested. This channel’s effectiveness lies in its personalization and direct engagement. Financial brands benefit from segmenting lists and tailoring offers to investor needs. Emails also provide a cost-efficient way to nurture long-term relationships. For marketers, this stat proves why email should remain a cornerstone of investor outreach.
Investor Marketing Statistics #13: SEO ROI At $22 Per $1 Spent
SEO delivers an impressive ROI of around $22 for every $1 spent. For financial services, strong organic visibility can mean capturing high-value investor traffic. The long-term benefits of SEO make it more sustainable than paid ads alone. Firms that invest in SEO build authority, trust, and cost-efficient lead generation. This metric highlights why organic search strategies are indispensable in investor marketing.
Investor Marketing Statistics #14: Content Marketing Market To Reach $2 Trillion By 2032
Content marketing’s global market, valued at $413.2 billion in 2022, is forecast to hit $2 trillion by 2032. Financial institutions are increasingly leveraging blogs, whitepapers, and thought leadership to build trust. Investors seek educational, informative content before making decisions. This trend makes content marketing not just a tactic but a growth driver. The scale of growth signals long-term opportunities for investor-focused storytelling.
Investor Marketing Statistics #15: 71% Of Real Estate Investors Increasing Marketing In 2025
In 2025, 71% of real estate investors plan to increase their marketing efforts. This signals confidence in the property market and the need to stand out among competitors. Digital platforms and targeted campaigns are driving much of this increase. Real estate remains a key sector where marketing strongly influences investment choices. The trend also reflects investors’ growing comfort with marketing as a growth tool.
Investor Marketing Statistics #16: 90% Of Consumers Have No Brand In Mind When Searching
Over 90% of financial service consumers start searches without a brand in mind. This creates huge opportunities for companies to win visibility and capture attention early. It emphasizes the need for strong SEO, SEM, and content strategies. Financial brands that dominate search results gain a critical edge in brand discovery. This statistic reminds us that awareness is often built in the first search interaction.
Investor Marketing Statistics #17: Financial Planning Mobile Searches Grew 70%
Mobile searches related to financial planning and management have grown by about 70% over the past two years. This reflects how consumers increasingly use their phones for critical financial decisions. Marketers must ensure mobile-first strategies to remain relevant. Optimized tools, responsive websites, and mobile apps are vital for engagement. The trend underscores the role of mobile in shaping the investor journey.
Investor Marketing Statistics #18: Search Ad Conversion Rate At 5.1% For Financial Services
Search ads for financial services boast a conversion rate of around 5.10%, compared to just 1.19% for display ads. This demonstrates the effectiveness of intent-driven search advertising. Investors are more likely to act when ads align with specific needs. For marketers, prioritizing search campaigns over broad display ads maximizes ROI. The stat highlights the power of targeting investors at the decision-making stage.
Investor Marketing Statistics #19: Financial Services Leads Cost $653 On Average
The average cost per lead in financial services is about $653. This reflects the high-value nature of financial products and the competition to secure investors. While expensive, these leads often justify the cost due to lifetime customer value. Marketers must balance acquisition costs with long-term returns. The figure underlines why precision targeting and nurturing are so important.
Investor Marketing Statistics #20: 91% Of Companies Boosting Investment In Podcasts And Audio
Around 91% of companies plan to sustain or increase investment in podcasts and audio content in 2025. For financial brands, this reflects the growing role of thought leadership and storytelling. Podcasts help reach investors in more personal, accessible ways. Audio also supports brand authority in a crowded digital space. This stat highlights a trend toward more engaging, content-rich marketing strategies.
Why These Numbers Matter
As we’ve seen, investor marketing statistics highlight more than just percentages and figures—they tell the story of how investors are making decisions and how brands can meet them halfway. From building trust through phone conversations to creating visibility through SEO and digital ads, the strategies that win are the ones backed by data. Personally, I see these numbers as a reminder that behind every stat is a real person making a choice, and the brands that recognize that are the ones who thrive. If there’s one takeaway, it’s that the right mix of insight and action creates growth—and having the right team to guide you along the way ensures you don’t just keep up, but lead.
SOURCES
- https://www.invoca.com/blog/financial-services-marketing-statistics (invoca.com)
- https://www.hubspot.com/marketing-statistics (HubSpot)
- https://www.deloittedigital.com/us/en/insights/research/2025-marketing-investment-trends.html (Deloitte)
- https://blog.hootsuite.com/social-media-benchmarks-for-financial-services/ (Social Media Dashboard)
- https://www.mckinsey.com/industries/private-capital/our-insights/global-private-markets-report (McKinsey & Company)
- https://www.fintelconnect.com/blog/financial-services-marketing-trends-2025/ (Fintel Connect)
- https://www.demandsage.com/digital-marketing-statistics/ (DemandSage)
- https://bloggingwizard.com/content-marketing-statistics-trends/ (Blogging Wizard)
- https://www.emarketer.com/topics/industry/financial-services (EMARKETER)
- https://www.mckinsey.com/industries/financial-services/our-insights (McKinsey & Company)
- https://www.optimizely.com/insights/blog/marketing-statistics/ (Optimizely)
- https://www.ruleranalytics.com/blog/reporting/financial-services-marketing-statistics/ (Ruler Analytics)
- https://www.wordstream.com/blog/ws/2022/04/19/digital-marketing-statistics (WordStream)
- https://www.deloittedigital.com/us/en/insights (Deloitte)https://blog.hootsuite.com (Social Media Dashboard)
- https://www.emarketer.com (EMARKETER)
- https://www.mckinsey.com (McKinsey & Company)