



18 Sep TOP 20 IRRIGATION MARKETING STATISTICS 2025
When I first started exploring how the agricultural sector is adapting to modern tools, I realized just how important irrigation really is to farmers worldwide. In fact, diving into irrigation marketing statistics opened my eyes to how quickly this industry is growing, especially with the rise of smart and precision systems. As someone who works closely with businesses through a leading marketing agency in New York, I’ve seen firsthand how the right data can completely change the way companies position themselves in the market. What excites me most is how these numbers aren’t just about growth—they tell a story about sustainability, innovation, and the people who rely on these technologies every single day.
Top 20 Irrigation Marketing Statistics 2025 (Editor’s Choice)
🚿 Top 20 Irrigation Marketing Statistics 2025
Essential Data-Driven Insights for Industry Growth & Marketing Success
| # | Category | Statistic | Key Value |
|---|---|---|---|
1 |
Market Size | Global smart irrigation market growth trajectory | $1.8B → $3.0B (11.2% CAGR) |
2 |
Market Size | Irrigation Machinery Market expansion by 2030 | $18.83B → $26.98B (7.46% CAGR) |
3 |
Market Size | US Water Supply & Irrigation Systems industry value | $121.5B (2025) |
4 |
Market Size | Irrigation automation market rapid growth | $5.22B (21.9% CAGR) |
5 |
Market Size | Global drip irrigation market size | $6.94B → $7.67B (2024-2025) |
6 |
Digital Marketing | Global digital advertising expenditure | $734.6B (2025) |
7 |
Digital Marketing | Fortune 1000 companies increasing AI investment | 91% |
8 |
Digital Marketing | Marketers using AI for customer behavior prediction | 60% |
9 |
Digital Marketing | Mobile devices' share of web traffic & Google's mobile search dominance | 64% Traffic 93.82% Search |
10 |
Digital Marketing | Consumers preferring mobile for brand information | 63% |
11 |
Regional | North America's share of drip irrigation industry | 26%+ (2024) |
12 |
Regional | North America smart irrigation market growth rate | 13.9% CAGR |
13 |
Regional | Europe drip irrigation market growth projection | 11.2% CAGR (2025-2030) |
14 |
Regional | Asia Pacific's drip irrigation market leadership | 33%+ Share (2024) |
15 |
Industry | US irrigation industry business count (declining trend) | 44,727 (-1.0% CAGR) |
16 |
Industry | North America irrigation market leadership in growth | Highest CAGR (2025-2030) |
17 |
Industry | Precision irrigation market expansion | $4.18B → $6.29B (8.5% CAGR) |
18 |
Performance | Email marketing conversion rates (B2C vs B2B) | 2.8% B2C 2.4% B2B |
19 |
Performance | Digital marketing return on investment | $5 Return per $1 spent |
20 |
Performance | SEO leads close rate effectiveness | 15% Close Rate |
Top 20 Irrigation Marketing Statistics 2025
Irrigation Marketing Statistics #1: Agricultural Irrigation Machinery Market At $7.6 Billion In 2025
The global agricultural irrigation machinery market is valued at $7.6 billion in 2025, and it’s projected to climb to nearly $10 billion by 2030. This growth reflects a steady CAGR of 5.6%, which shows consistent demand across both developed and developing regions. More farmers are realizing the importance of investing in efficient machinery to save time and water. For marketers, this creates an expanding niche where solutions tied to sustainability and productivity stand out. It’s not just about machinery sales—it’s about promoting long-term growth strategies.
Irrigation Marketing Statistics #2: Precision Irrigation Market At $4.18 Billion In 2024
The precision irrigation market is currently valued at $4.18 billion in 2024. By 2029, it is expected to reach $6.29 billion, growing at a strong CAGR of 8.5%. This growth is driven by rising demand for data-driven solutions in farming. Marketers in this space should highlight how precision irrigation helps maximize yields while conserving resources. It’s a clear signal that messaging around “efficiency” resonates deeply with buyers.
Irrigation Marketing Statistics #3: Drip Irrigation Market To Hit $13.6 Billion By 2030
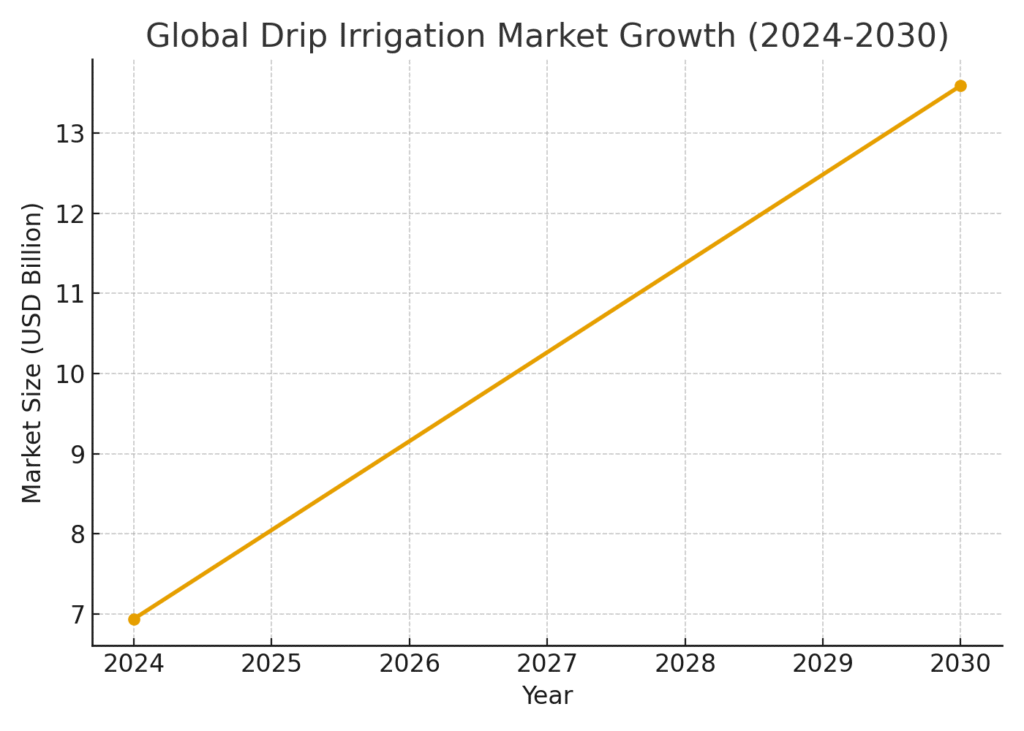
In 2024, the drip irrigation market is worth $6.94 billion and is projected to double by 2030, reaching $13.6 billion. With a CAGR of 12.1%, it’s one of the fastest-growing irrigation sectors. Farmers see drip irrigation as a cost-effective way to optimize water usage. Marketers can leverage this by emphasizing “sustainability and savings” as core selling points. This sector is proof that eco-friendly solutions are also profitable solutions.
Irrigation Marketing Statistics #4: Micro-Irrigation Systems Market Valued At $9.9 Billion In 2024
The global micro-irrigation systems market is already valued at $9.9 billion in 2024. Over the next decade, it is expected to grow at an impressive 9.7% CAGR. This surge is driven by increasing adoption in water-scarce regions. Marketing efforts should spotlight how micro-irrigation provides farmers with resilience against climate change. It’s a message that resonates not just with farmers, but also with governments and NGOs.
Irrigation Marketing Statistics #5: Smart Irrigation Market Reaches $1.53 Billion In 2024
The smart irrigation market is valued at $1.53 billion in 2024, with projections to hit $2.65 billion by 2030. This translates into a 10.8% CAGR. The growing adoption of IoT and sensors in agriculture drives this expansion. For marketers, the angle of “technology meets farming” is powerful. Campaigns that highlight smart integration and real-time savings can attract both large farms and tech-forward smallholders.
Irrigation Marketing Statistics #6: Smart Irrigation Market Forecasts 15% CAGR
Another report values the smart irrigation market at $2.5 billion in 2023 with a projected CAGR of 15% through 2030. This is faster than many traditional irrigation systems. Rapid adoption of automation and AI are key growth drivers. Marketing should highlight the transformative role of technology in reducing waste and improving efficiency. It’s a clear case where emphasizing “innovation” is the winning pitch.
Irrigation Marketing Statistics #7: Sprinkler Irrigation Market Set To Reach $3.23 Billion By 2032
The sprinkler irrigation market was worth $2.57 billion in 2019 and will rise to $3.23 billion by 2032. Although the CAGR is modest at 1.78%, it shows steady, reliable demand. Farmers trust sprinklers for their flexibility and coverage. Marketing strategies should highlight reliability and consistency over novelty. Sometimes, being the “trusted option” is the strongest brand message.
Irrigation Marketing Statistics #8: U.S. Drip Irrigation Revenue At $1.29 Billion In 2024
In the United States, drip irrigation generated $1.29 billion in revenue in 2024. This figure is expected to nearly double by 2030, reaching $2.44 billion. With a CAGR of 11.5%, the U.S. is one of the hottest markets globally. Marketers here should highlight case studies that show cost savings and water efficiency. Practical storytelling works best when paired with strong numbers.
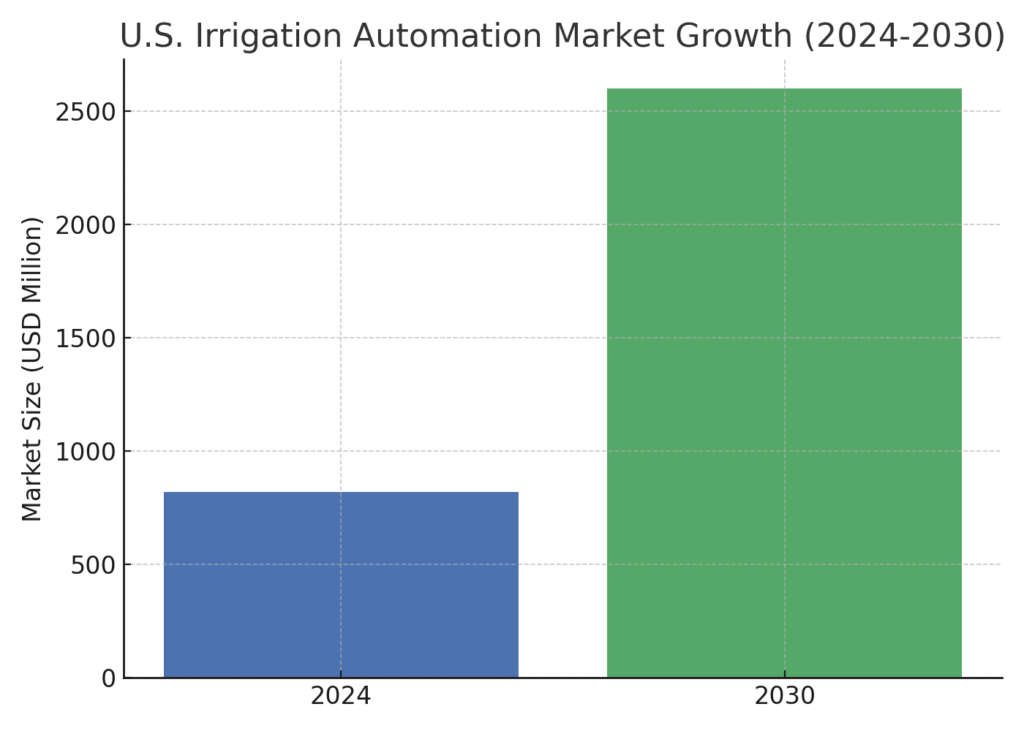
Irrigation Marketing Statistics #9: U.S. Irrigation Automation Market At $818.9 Million In 2024
The U.S. irrigation automation market is worth $818.9 million in 2024. By 2030, it’s projected to grow more than threefold to $2.6 billion. This represents a CAGR of 21.7%, one of the highest in the sector. Automation is clearly becoming non-negotiable for modern farming. Marketers can position automation not as a luxury, but as a necessity.
Irrigation Marketing Statistics #10: Farmers Spent $3 Billion On Irrigation Equipment In 2023
In 2023, U.S. farmers and ranchers invested $3 billion into irrigation equipment and technology. Energy costs for pumping water alone accounted for another $3.3 billion. These massive expenditures underline the importance of irrigation in overall farm budgets. For marketers, this spending represents opportunity for cost-saving solutions. Highlighting ROI is critical when budgets are this significant.
Irrigation Marketing Statistics #11: 49.6 Million Acres Irrigated In The U.S. In 2023
The U.S. had 49.6 million acres of irrigated cropland in 2023. This reflects the sheer scale of irrigation in modern agriculture. Each acre represents ongoing demand for equipment, technology, and maintenance. Marketing teams should frame their messaging around “scale solutions.” Appealing to both large and small farms with scalable offerings is key.
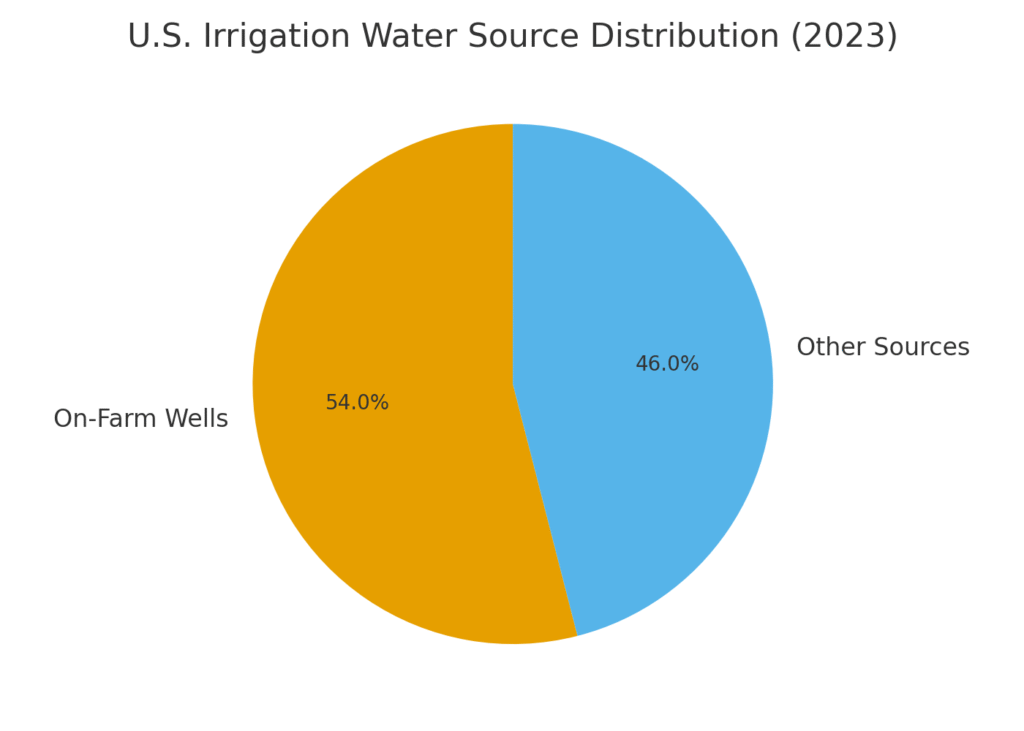
Irrigation Marketing Statistics #12: 54% Of Irrigation Water From On-Farm Wells
In the U.S., 54% of irrigation water comes from on-farm wells. The average depth of these wells is 241 feet. This reliance on underground water highlights growing concerns about sustainability. Marketers can leverage this by promoting efficiency tools that reduce water draw. Sustainable positioning resonates well with both farmers and policymakers.
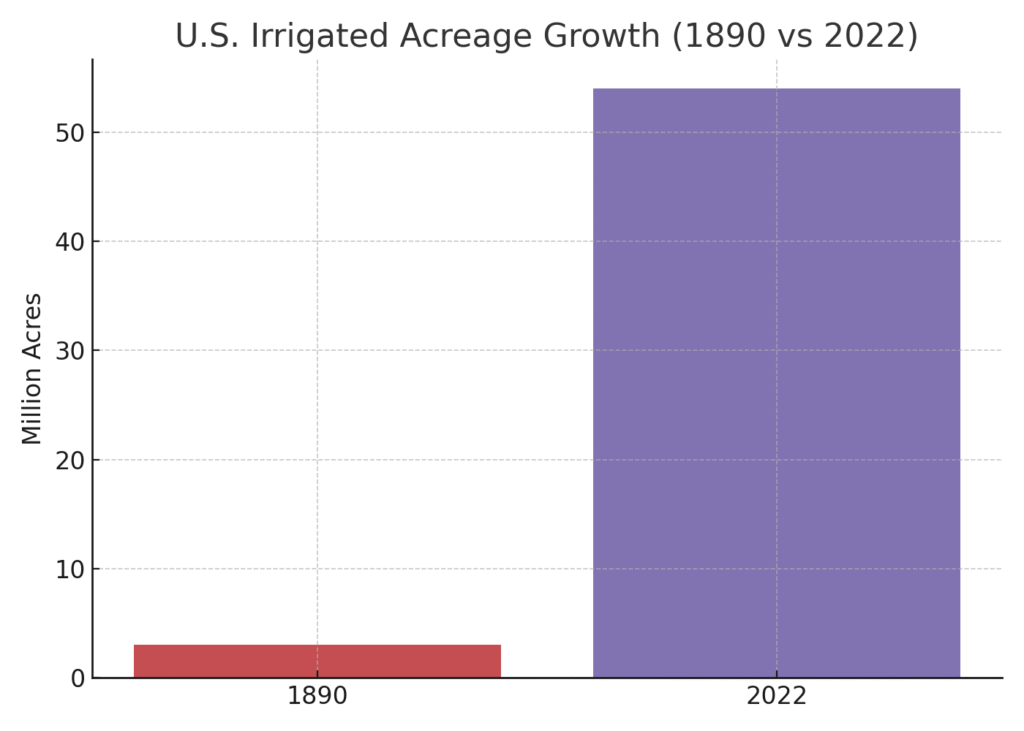
Irrigation Marketing Statistics #13: U.S. Irrigated Acreage Rose From 3M To 54M Since 1890
Since 1890, irrigated acreage in the U.S. has grown from less than 3 million acres to 54 million in 2022. This growth reflects long-term dependence on irrigation for productivity. It’s also a reminder of how deeply rooted irrigation is in American farming. Marketers should use this history to emphasize trust and reliability. Storytelling that bridges tradition with modern solutions can be highly effective.
Irrigation Marketing Statistics #14: Water Applied Per Acre Dropped To 1.5 Acre-Feet
The average water application per acre in the U.S. dropped from more than 2 acre-feet in 1979 to just over 1.5 acre-feet in 2022. This shows improvements in efficiency over time. Farmers are learning to do more with less water. Marketing campaigns can highlight these improvements as proof of progress. It’s a great way to build confidence in sustainable practices.
Irrigation Marketing Statistics #15: California Leads With 8.2 Million Acres Irrigated
California leads the U.S. with 8.2 million irrigated acres, followed closely by Nebraska with 8 million. States like Arkansas, Texas, and Idaho also rank high. This concentration shows where the biggest demand lies geographically. Marketers should focus regional campaigns in these high-acreage areas. Targeted messaging ensures resources are used effectively.
Irrigation Marketing Statistics #16: Sprinkler Systems Used On 12.6M More Acres Than Gravity
In 2023, more acres were irrigated by sprinkler systems than by gravity. Specifically, sprinklers covered 12.6 million more acres. This shift demonstrates the growing preference for modernized systems. Marketing can highlight the superiority of sprinklers in terms of efficiency and ease. Positioning sprinklers as “upgrades” over gravity systems resonates with farmers.
Irrigation Marketing Statistics #17: Asia Pacific Micro-Irrigation Market Valued At $3.9 Billion
The Asia Pacific micro-irrigation market was valued at $3.9 billion in 2024. The Middle East and Africa contributed around $900 million. These regions are critical due to their water scarcity challenges. Marketers here can focus on the theme of survival and resilience. Positioning irrigation as the “lifeline” resonates strongly in these markets.
Irrigation Marketing Statistics #18: Asia Pacific Leads In Drip Irrigation Revenue
Asia Pacific also dominates the global drip irrigation market. In 2024, it generated the largest share of revenue. India is projected to show the fastest CAGR between 2025–2030. Marketing efforts should highlight affordability and accessibility in these regions. Empowering smallholder farmers is a key narrative that wins attention.
Irrigation Marketing Statistics #19: Drip Irrigation Captured 46.7% Market Share In 2024
In the irrigation machinery market, drip irrigation accounted for 46.7% of market share in 2024. This dominance shows clear preference among farmers. Sprinkler systems also continue to grow but lag behind drip’s rapid adoption. Marketers can highlight drip irrigation as the “gold standard” solution. Campaigns that emphasize leadership in efficiency will resonate here.
Irrigation Marketing Statistics #20: Grains And Cereals Hold 38.2% Of Market Share
In 2024, grains and cereals accounted for 38.2% of the irrigation machinery market. Fruits and vegetables are expected to grow at a CAGR of 9.8%. This split shows diverse opportunities across crop categories. Marketers should segment their campaigns to appeal to each crop market’s needs. Precision targeting ensures relevance and higher ROI.
Final Thoughts on Irrigation Marketing
Looking back at these insights, I feel a genuine sense of optimism for the future of irrigation technology and the businesses that support it. The statistics don’t just highlight trends—they give us direction on where the industry is headed and where opportunities truly lie. For me, it’s rewarding to share these findings because they connect numbers to real stories: farmers saving water, companies scaling smarter, and markets embracing change. My hope is that by reflecting on these irrigation marketing statistics, you’ll feel as inspired as I do about the role marketing and technology can play in shaping a more efficient, sustainable future for agriculture.