



28 Sep TOP 20 LIVER HEALTH MARKETING STATISTICS 2025
When I began exploring the latest liver health marketing statistics, I realized how vital this area has become for both healthcare professionals and wellness brands. Liver diseases and supplements are no longer niche—they’re part of a growing conversation about preventative health, wellness, and nutrition. As someone who is passionate about understanding how health trends shape markets, I found it inspiring to see how much this space has expanded. By collaborating with a leading marketing agency in New York, I’ve gained a better understanding of how these numbers can be used to craft effective campaigns that truly connect with audiences. In this article, I’ll share the top 20 statistics that reveal how fast the market is growing and how consumer behaviors are changing in 2025.
Top 20 Liver Health Marketing Statistics 2025 (Editor’s Choice)
| Stat # | Headline | Key Figure | Insight |
|---|---|---|---|
| 1 | Global Market Value 2024 | USD 879.6 Million | Strong consumer demand for liver health supplements. |
| 2 | Market Projection 2030 | USD 1.32 Billion | Growing demand linked to lifestyle-related issues. |
| 3 | Market Size 2024 Estimate | USD 1.51 Billion | Expected to hit USD 2.41 Billion by 2032. |
| 4 | U.S. Market Projection | USD 351.4 Million by 2030 | Driven by awareness of fatty liver conditions. |
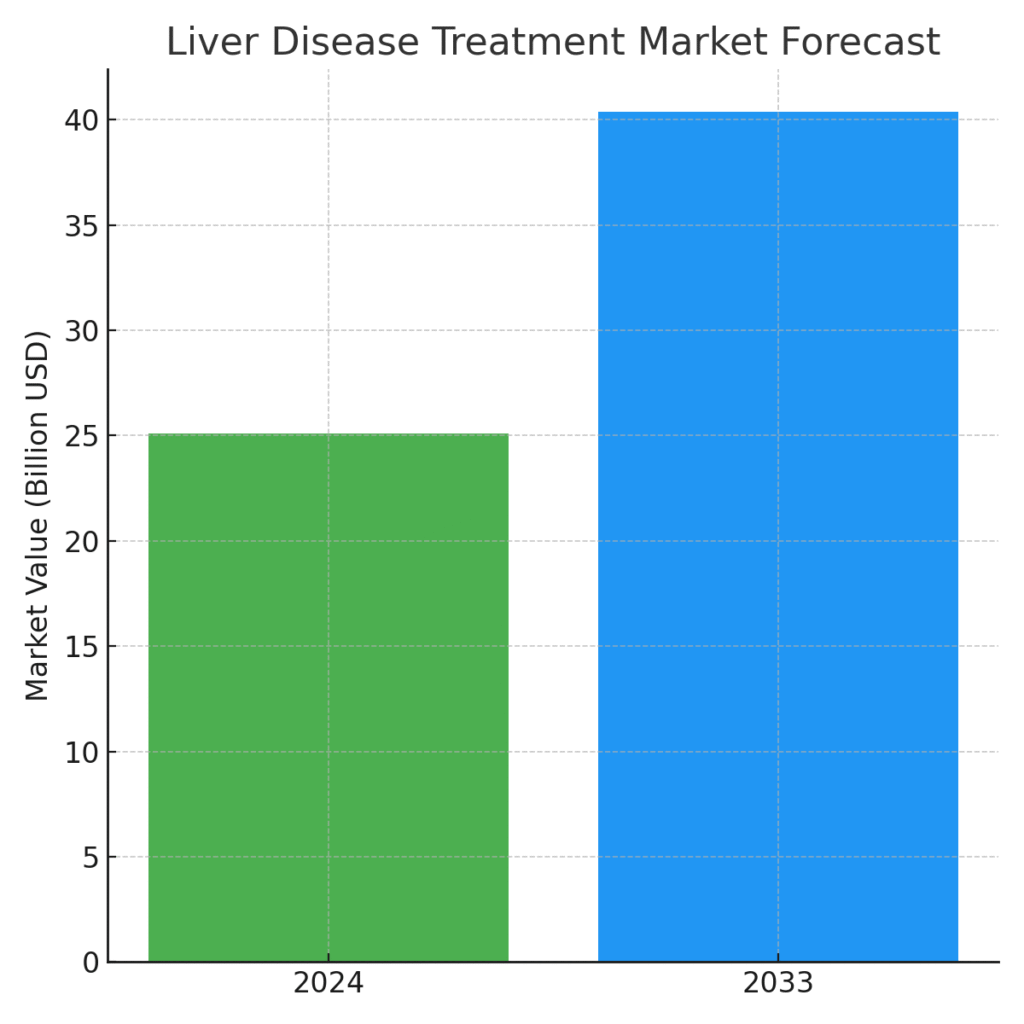
| 5 | Liver Disease Treatment Market | USD 25.1 Billion (2024) | Set to surpass USD 40 Billion by 2033. |
| 6 | Liver Therapeutics 2025 | USD 23.42 Billion | Expected to grow to USD 33.84 Billion by 2030. |
| 7 | Therapeutics Forecast 2033 | USD 40.29 Billion | Pipeline growth fueling pharma competition. |
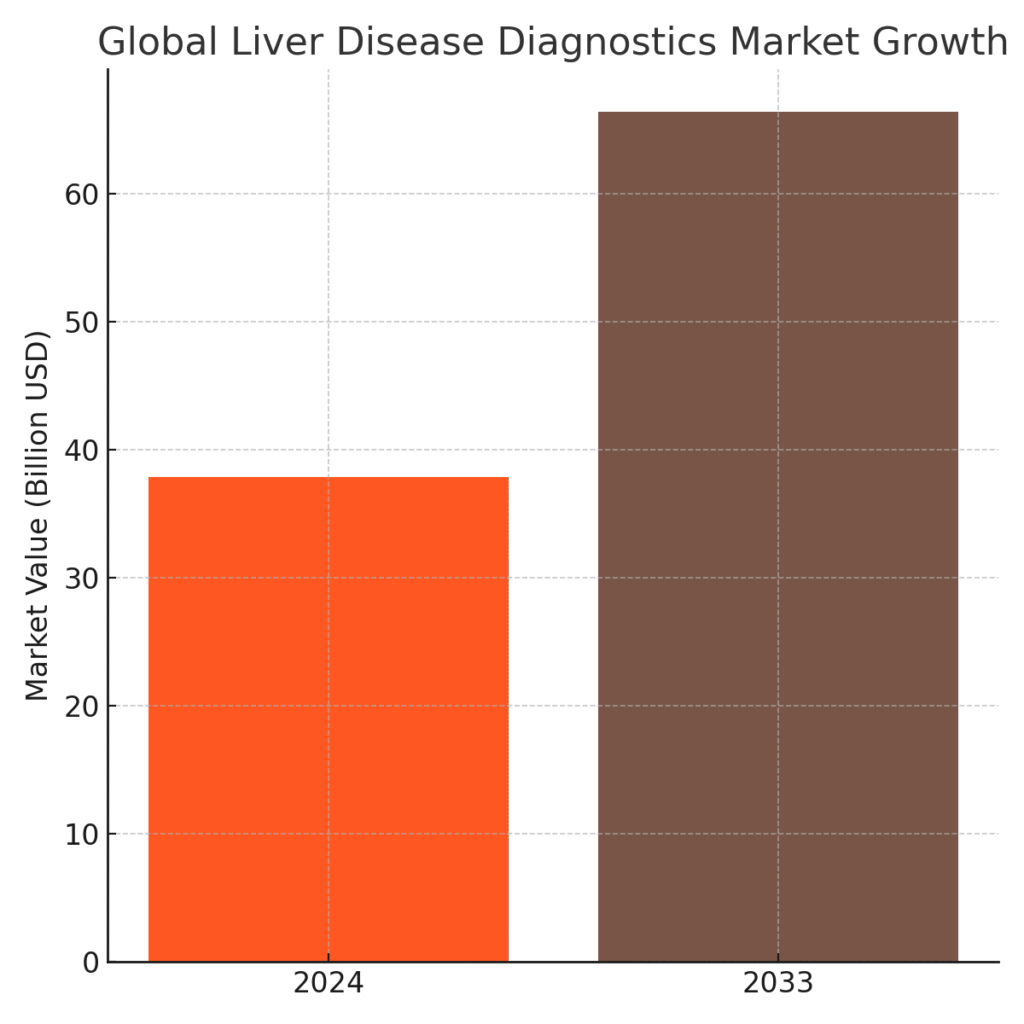
| 8 | Diagnostics Market 2033 | USD 66.4 Billion | Early detection demand driving strong growth. |
| 9 | Supplements Market 2023 | USD 9.5 Billion | Herbal and natural products dominate share. |
| 10 | Capsules Market Share | 35%+ | Convenience and dosage accuracy attract consumers. |
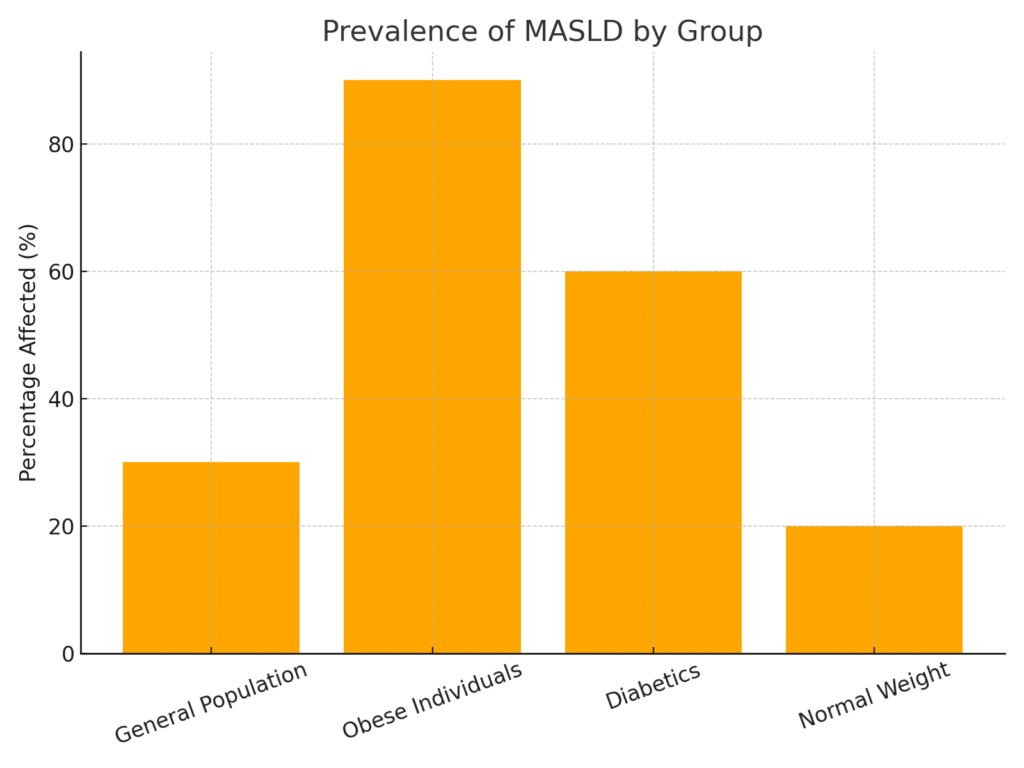
| 11 | MASLD Global Prevalence | 25–38% | One of the most widespread liver conditions. |
| 12 | U.S. Adult Prevalence | 30–40% | A major mainstream health issue in the U.S. |
| 13 | MASLD in Obese Adults | 90%+ | Obesity is a strong predictor of liver disease. |
| 14 | MASLD in Diabetics | 60% | Metabolic health is tightly linked to liver health. |
| 15 | Economic Burden in U.S. | USD 103 Billion annually | MASLD costs weigh heavily on healthcare systems. |
| 16 | Chronic HBV Cases | 350–400 Million | A massive global patient population needs solutions. |
| 17 | HBV Severe Outcomes | 25% of cases | Risk of liver cancer and cirrhosis without treatment. |
| 18 | HBV and Liver Cancer | 80% of cases | Vaccination and treatment are crucial interventions. |
| 19 | Risky Supplement Use | 15 Million Americans | Potentially harmful supplements highlight trust issues. |
| 20 | Herbal Supplements Lead | Largest Category | Herbal products dominate liver health supplements. |
Top 20 Liver Health Marketing Statistics 2025
Liver Health Marketing Statistics #1 – Global Market Valued At USD 879.6 Million In 2024
The global liver health supplements market reached USD 879.6 million in 2024, a sign of strong demand. This number shows that more people are turning to wellness products as preventative health tools. Brands are positioning themselves in a growing market where liver function is tied to broader lifestyle changes. With a projected CAGR of nearly 7%, businesses see a clear opportunity for expansion. This growth reflects consumers’ rising trust in supplements for long-term wellbeing.
Liver Health Marketing Statistics #2 – Market Projected To Reach USD 1.32 Billion By 2030
Forecasts show the liver health supplements market will hit USD 1.32 billion by 2030. The expansion is largely driven by lifestyle-related liver conditions. Companies are expected to invest heavily in product innovation to capture market share. Demand for capsules and herbal supplements will continue to lead growth. This trend is a golden opportunity for marketers to highlight natural and science-backed solutions.
Liver Health Marketing Statistics #3 – Market Worth USD 1.51 Billion In 2024 With Growth Ahead
Another report puts the market size at USD 1.51 billion in 2024, showing consistency across studies. By 2032, it is projected to reach USD 2.41 billion. This creates room for both established brands and new entrants to thrive. Consumers want transparency, clean ingredients, and proven results. Marketing campaigns must emphasize trust and credibility to stand out.
Liver Health Marketing Statistics #4 – U.S. Market To Hit USD 351.4 Million By 2030
The U.S. alone is projected to reach USD 351.4 million in liver health supplement sales by 2030. A 7% CAGR highlights the strong appetite for preventative health products. This is being driven by high awareness of fatty liver and lifestyle-related issues. U.S. consumers are investing more in supplements as part of their daily health routines. Marketers can leverage this by tapping into wellness-focused messaging.
Liver Health Marketing Statistics #5 – Liver Disease Treatment Market At USD 25.1 Billion In 2024
In 2024, the liver disease treatment market was valued at USD 25.1 billion globally. This demonstrates how costly liver-related conditions are for healthcare systems. The projection to surpass USD 40 billion in less than a decade is staggering. Pharmaceutical companies are expanding their pipelines in response. Marketers in this space must stress both innovation and accessibility.
Liver Health Marketing Statistics #6 – Liver Therapeutics Market Projected At USD 23.42 Billion In 2025
The liver disease therapeutics segment will hit USD 23.42 billion by 2025. By 2030, this will grow to USD 33.84 billion. This reflects how medication demand parallels rising diagnosis rates. For marketers, this creates an opportunity to highlight treatment accessibility. Messaging should also incorporate education about early detection.
Liver Health Marketing Statistics #7 – Market Growth To USD 40.29 Billion By 2033
Some projections are even higher, putting the therapeutic market at USD 40.29 billion by 2033. This means brands in pharma must scale innovation pipelines. The competitive landscape will intensify as new entrants arrive. Marketing strategies will increasingly rely on data and patient-centric approaches. Education about liver health will become a central pillar of campaigns.
Liver Health Marketing Statistics #8 – Diagnostics Market To Reach USD 66.4 Billion By 2033
The liver disease diagnostics market was USD 37.8 billion in 2024. By 2033, it will likely reach USD 66.4 billion. This jump underscores the emphasis on early detection. Diagnostics companies must highlight speed, accuracy, and accessibility. Marketing here benefits from building trust in new technologies.
Liver Health Marketing Statistics #9 – Supplements Market At USD 9.5 Billion In 2023
The global supplements market reached USD 9.5 billion in 2023. Liver-specific supplements form a significant and rising share. The segment is powered by herbal and natural products. Marketers should stress organic, plant-based, and clean formulations. These themes strongly resonate with health-conscious buyers.
Liver Health Marketing Statistics #10 – Capsules Hold Over 35% Market Share
Capsules dominate with more than 35% of sales by form. Their convenience and dosage accuracy make them attractive to consumers. Companies are innovating with easy-to-swallow formats. Marketing teams can emphasize convenience as a key selling point. This is particularly effective in Western markets where supplement usage is high.
Liver Health Marketing Statistics #11 – MASLD Affects Up To 38% Globally
Metabolic dysfunction–associated steatotic liver disease (MASLD) impacts 25–38% of the world’s population. This staggering prevalence shows why the market is booming. With obesity and diabetes rising, awareness campaigns are critical. Marketers have a duty to link products with education. Prevention-focused campaigns will resonate globally.
Liver Health Marketing Statistics #12 – 30–40% Of U.S. Adults Affected
In the U.S., 30–40% of adults have MASLD. This makes it a mainstream health issue, not a rare condition. Campaigns must be relatable and accessible to everyday people. Marketers can use these figures to stress urgency in prevention. This also creates opportunities for collaborations with healthcare providers.
Liver Health Marketing Statistics #13 – Over 90% Of Obese Individuals Have MASLD
Obesity correlates strongly with liver disease. Over 90% of obese individuals develop MASLD. Marketers can use this as a powerful education tool. Campaigns must focus on prevention and lifestyle changes. Partnering with weight management programs can strengthen positioning.
Liver Health Marketing Statistics #14 – 60% Of Diabetics Develop MASLD
About 60% of people with diabetes also develop MASLD. This highlights the link between metabolic and liver health. It’s an opportunity for integrated wellness messaging. Companies can stress the importance of managing multiple risk factors. Cross-sector partnerships will resonate with consumers.
Liver Health Marketing Statistics #15 – U.S. Economic Burden At USD 103 Billion
The annual cost of MASLD in the U.S. has been estimated at USD 103 billion. This figure shows the financial urgency of addressing liver health. Policymakers and healthcare leaders must act. Marketers can spotlight this burden to gain attention from stakeholders. Campaigns that tie costs to prevention will be especially effective.
Liver Health Marketing Statistics #16 – 350–400 Million People With Chronic HBV
Worldwide, 350–400 million people live with chronic hepatitis B infection. This creates a massive patient population in need of solutions. Marketers must highlight treatment and management advances. Awareness campaigns should focus on breaking stigma. Education-driven campaigns will gain global traction.
Liver Health Marketing Statistics #17 – 25% Of HBV Cases May Lead To Severe Outcomes
One in four people with chronic HBV may die of liver cancer or cirrhosis. This makes treatment and awareness campaigns urgent. Messaging must stress life-saving interventions. Companies can showcase innovation in patient care. Emotional storytelling is powerful for engagement here.
Liver Health Marketing Statistics #18 – 80% Of Liver Cancer Cases Linked To HBV
Up to 80% of primary liver cancers are caused by HBV. This statistic reinforces the urgency of vaccination and treatment. Campaigns can highlight prevention through vaccination. Awareness partnerships with public health groups are key. Marketers must balance education and empathy.
Liver Health Marketing Statistics #19 – 15 Million Americans Use Potentially Harmful Supplements
Fifteen million Americans take supplements that may harm the liver. This creates both a challenge and opportunity. Trust-building is vital in supplement marketing. Brands must showcase rigorous testing and certifications. Transparency campaigns can convert skeptical consumers.
Liver Health Marketing Statistics #20 – Herbal Supplements Dominate Market Share
Herbal supplements lead sales in the liver health supplement category. Consumers equate herbal products with safety and natural wellness. Marketing campaigns must highlight heritage, purity, and authenticity. Storytelling around plant origins resonates with buyers. This segment shows the future of supplement marketing.
Why These Numbers Matter For Marketing
Looking at these liver health marketing statistics, I feel both encouraged and challenged. The numbers reveal a growing market with billions at stake, but also highlight the health crises driving demand. As someone who writes with a personal lens, I see this as more than business—it’s about shaping messages that can actually improve lives. By working with a leading marketing agency in New York, I’ve seen firsthand how data-driven campaigns can change perceptions and inspire healthier decisions. My hope is that these insights help brands, healthcare professionals, and advocates create campaigns that are not only profitable but also genuinely impactful.
SOURCES
- https://www.michiganmedicine.org/health-lab/15-million-americans-take-supplements-may-be-toxic-liver