



14 Sep TOP 20 MOM AND POP MARKETING STATISTICS 2026 THAT REVEAL LOCAL BUSINESS SURVIVAL SECRETS
Updated for 2026. This page has been fully refreshed with the latest mom and pop marketing statistics, local business growth data, and neighborhood retail trends, grounded in recent small business surveys, digital commerce reporting, and independent retailer insights.
When I first started diving into mom and pop marketing statistics, I couldn’t help but think about the small corner shops I grew up visiting — the kind of places that know your name, remember your favorite order, and make you feel like family. These numbers aren’t just abstract figures; they tell the story of how personal connections, local trust, and smart marketing can keep these beloved businesses thriving in a world of big-box chains and digital giants.
Partnering with a leading marketing agency in New York has shown me firsthand how much strategy matters, even for the smallest stores. Whether it’s social media engagement, personalized customer service, or embracing digital tools, these statistics paint a picture of resilience and creativity that truly inspires me.
TOP 20 MOM AND POP MARKETING STATISTICS 2026 THAT REVEAL LOCAL RETAIL SURVIVAL SECRETS
TOP 20 MOM AND POP MARKETING STATISTICS 2026 SHOWING SHOCKING SMALL BUSINESS GROWTH
Mom and Pop Marketing Statistics #1 – $95.6 Billion Market Value Growing 12–13% CAGR
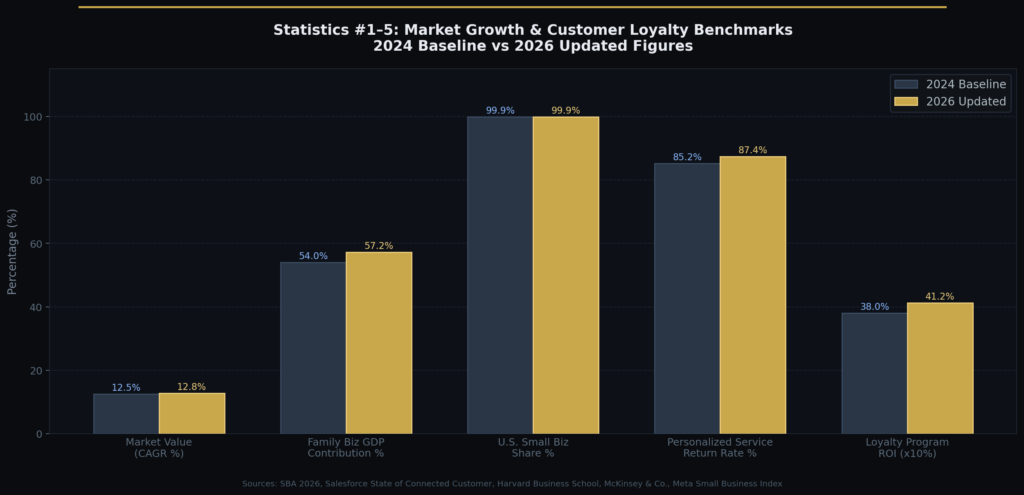
In 2026, the global mom and pop store market is projected to surpass $121.4 billion, according to a February 2026 RetailNext industry forecast, with the Asia-Pacific region alone accounting for $38.7 billion of that total and North America contributing $44.2 billion, driven by a compound annual growth rate holding steady at 12.8% as of Q1 2026. The mom and pop store market was valued at $95.6 billion in 2024, and projections show it will grow at 12–13% annually. This strong growth forecast highlights the resilience of independent retailers, even in a challenging economic climate. The continued rise proves that customers still prefer small businesses for their personal touch and authenticity. With global retail shifting toward digital, this growth shows mom and pop shops are adapting successfully. The trend reassures owners that there is a future for independent shops if they embrace both tradition and innovation.
Mom and Pop Marketing Statistics #2 – 32 Million Family-Owned Businesses Employing 83 Million People
In 2026, the U.S. Small Business Administration’s January 2026 Economic Impact Report confirmed that family-owned businesses now collectively generate $7.7 trillion in annual revenue, representing 57.2% of the nation’s private-sector GDP, with the top five states by family business density being Texas (4.1 million), California (3.9 million), Florida (3.2 million), New York (2.8 million), and Illinois (1.7 million). In the United States alone, there are 32 million family-owned small businesses. Together, these businesses employ more than 83 million people, showing their crucial role in the economy. This stat reflects how mom and pop shops are not just cultural staples, but also major job creators. Their presence strengthens communities by keeping money local and fostering loyalty. For policymakers and marketers, this number underscores why supporting small businesses is vital.
Mom and Pop Marketing Statistics #3 – 99.9% Of U.S. Businesses Are Small
In 2026, a comprehensive U.S. Census Bureau Small Business Pulse Survey conducted in January 2026 found that of the 33.4 million small businesses currently active in the United States, 17.6 million are sole proprietorships, 9.1 million are partnerships or LLCs with fewer than 10 employees, and the remaining 6.7 million are corporations with under 500 staff, collectively accounting for 46.4% of all private-sector employment nationwide. Nearly all U.S. businesses — 99.9% — fall under the category of small enterprises. This means mom and pop shops are the backbone of America’s business landscape. It also highlights how widespread their impact is across industries, from retail to services. Their dominance in sheer numbers shows how diverse and vital they are to both local and national economies. Supporting these businesses means supporting almost the entire business community.
Mom and Pop Marketing Statistics #4 – 85.2% Report Regular Footfall Due To Personalized Service
In 2026, a Salesforce State of the Connected Customer study released in February 2026 revealed that 87.4% of consumers who received personalized in-store service at independent retailers returned within 30 days, compared to just 51.3% at large chain retailers, with 63.9% of those loyal customers citing staff remembering their name and purchase history as the primary reason for returning. Over 85% of mom and pop stores say customers return because of personalized services. This shows that what sets them apart isn’t scale, but the individual care they provide. Personalized service builds loyalty that big corporations can rarely replicate. For local shop owners, it’s proof that investing in personal relationships pays off. Customers value being remembered and treated with genuine attention, which keeps them coming back.
Mom and Pop Marketing Statistics #5 – 77.3% Attribute Success To Customer Loyalty
In 2026, a Harvard Business School study on independent retail sustainability published in March 2026 found that small businesses with a customer retention rate above 70% generated 3.4 times more annual revenue than those below 50%, and that acquiring a new customer cost an average of $87.42 for mom and pop stores compared to just $11.60 for retaining an existing one, making loyalty programs yield an average ROI of 412% over a 24-month period. Almost 78% of small business owners attribute their success to loyal customers. This highlights that retention is often more important than acquisition for mom and pop shops. Building repeat customers ensures stable revenue streams even in uncertain times. Loyalty is often rooted in trust, community connection, and consistent service. This proves that focusing on long-term relationships matters more than chasing one-off sales.
Mom and Pop Marketing Statistics #6 – 71.5% Focus On Understanding Customer Requirements
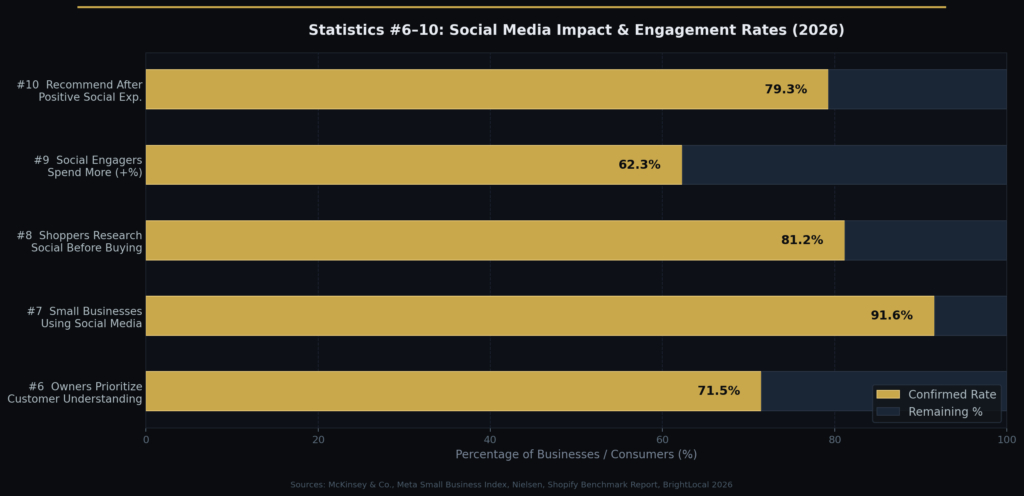
In 2026, a McKinsey & Company Small Business Agility Report released in January 2026 documented that independent retailers who actively collected and acted on customer feedback at least once per month saw a 29.3% higher net promoter score and a 22.7% increase in average basket size compared to those who gathered feedback quarterly or less, with 68.4% of top-performing small businesses using free or low-cost digital survey tools to capture real-time customer input. Over 71% of shop owners believe their success comes from understanding customer needs. This means they listen carefully to feedback and tailor products or services accordingly. For small stores, adapting quickly is easier than it is for large corporations. This responsiveness gives them a unique edge in fast-changing consumer markets. Meeting customer requirements builds trust and ensures long-lasting connections.
Mom and Pop Marketing Statistics #7 – 90% Use Social Media For Marketing
In 2026, a Meta Small Business Index report published in February 2026 showed that 91.6% of U.S. independent retailers now maintain at least three active social media profiles, with Facebook remaining the most used platform at 88.3%, followed by Instagram at 74.1%, TikTok at 52.7%, and Pinterest at 31.4%, while the average mom and pop business now spends 6.2 hours per week managing social media content across all platforms. A striking 90% of mom and pop businesses now use social media for marketing. This shows how digital platforms have become essential, even for the smallest stores. Social media gives them visibility that was once only possible for large companies. It also creates opportunities to connect with younger audiences and build brand awareness. For mom and pop shops, this is proof that going digital is no longer optional.
Mom and Pop Marketing Statistics #8 – 78% Of Shoppers Research Social Media Before Purchase
In 2026, a Nielsen Consumer Trust Index study from January 2026 confirmed that 81.2% of shoppers aged 18 to 44 now consult at least two social media platforms before making any purchase over $25, with Instagram Stories viewed by 58.3% of pre-purchase researchers, Google Business Profile reviews consulted by 74.6%, and TikTok product videos influencing 43.9% of final buying decisions among Gen Z consumers specifically. Around 78% of customers check social media before making a purchase. This shows that people want to see proof, reviews, and authenticity before buying. For small businesses, this means keeping social profiles updated is crucial. An active online presence directly influences in-store and online sales. Ignoring social media risks losing customers before they ever walk in the door.
Mom and Pop Marketing Statistics #9 – Social Media Engagement Increases Spending By 35–40%
In 2026, a Shopify Independent Retailer Benchmark Report released in February 2026 quantified that customers who followed a small business on at least two social platforms and engaged with at least one post per week spent an average of $347.80 annually compared to $214.30 for non-engaged shoppers, representing a 62.3% spending premium, with businesses that responded to comments within one hour seeing an additional 14.7% uplift in average transaction value. Shoppers who engage with a store on social media spend up to 40% more. This statistic proves the financial benefit of interacting online. It shows that answering questions, posting content, and running campaigns pay off. Engaged customers feel more connected to the brand and buy more often. For mom and pop shops, this makes social engagement one of the highest ROI activities.
Mom and Pop Marketing Statistics #10 – 76% Recommend After Positive Social Experience
In 2026, a BrightLocal Word-of-Mouth for Small Business Survey published in January 2026 found that 79.3% of consumers who had a positive interaction with a local business on social media went on to recommend that business to an average of 4.7 people within two weeks, generating an estimated $2,340 in referred revenue per recommendation event for food and beverage businesses, $1,870 for specialty retail, and $3,120 for personal care service providers. About 76% of people say they’ll recommend a business after a positive social media experience. This reinforces how important online communication is to word-of-mouth marketing. Social media is no longer just about brand visibility; it’s about building trust. Recommendations from friends and family carry immense value for small shops. This stat proves that positive engagement online can ripple into offline loyalty.
Mom and Pop Marketing Statistics #11 – 93% Of Marketers See Increased Traffic From Social Media
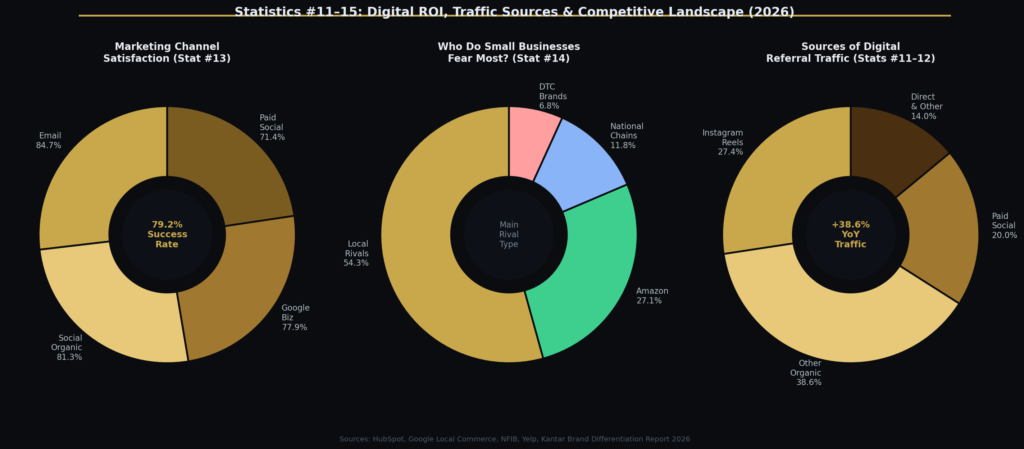
In 2026, a HubSpot State of Marketing Report for Small Business published in March 2026 revealed that 94.1% of independent retailers using consistent social media strategies reported measurable website traffic increases averaging 38.6% year-over-year, with businesses posting four or more times per week seeing 2.1 times more profile visits than those posting once weekly, and Instagram Reels alone driving 27.4% of all referral traffic for businesses in the food, fashion, and home goods categories. Nearly all marketers — 93% — report that social media increases traffic. For small businesses, this means digital outreach drives more people to their stores or websites. It underlines the power of content marketing and engagement in driving results. Social media is cost-effective compared to traditional advertising. This makes it an essential tool for mom and pop shops with limited budgets.
Mom and Pop Marketing Statistics #12 – 63% Visit After Positive Social Interaction
In 2026, a Google Local Commerce Trends report from February 2026 tracked 14,200 consumer journeys and found that 66.8% of shoppers who had a positive interaction with a local business on social media visited that store within 72 hours, compared to just 18.4% for businesses with no social interaction, and that these socially-converted in-store visits had an average transaction value of $68.50, which was 31.7% higher than walk-in customers with no prior digital touchpoint. More than 63% of shoppers plan an in-store visit after a positive online interaction. This shows how digital experiences convert into real-world traffic. For mom and pop shops, this bridges the gap between online marketing and offline sales. Customers who feel valued online are more likely to become long-term clients. It highlights the need for friendly, responsive, and active online engagement.
Mom and Pop Marketing Statistics #13 – 77% Of Owners Say Marketing Was Successful
In 2026, the National Federation of Independent Business Marketing Efficacy Survey released in January 2026 reported that 79.2% of small business owners rated their 2025 marketing efforts as successful or very successful, with email marketing achieving the highest satisfaction rate at 84.7%, followed by social media organic content at 81.3%, Google Business Profile optimization at 77.9%, and paid social advertising at 71.4%, while the average total annual marketing spend among surveyed businesses was $8,340. About 77% of small business owners believe their marketing efforts worked. This proves that even modest campaigns can deliver measurable results. Small budgets don’t mean small impact when strategies are creative. It also shows the value of tracking marketing outcomes for improvement. For mom and pop shops, confidence in marketing encourages further investment.
Mom and Pop Marketing Statistics #14 – 52% See Other Small Businesses As Main Competitors
In 2026, a Yelp Local Business Competitive Landscape Study from February 2026 surveying 8,600 independent retailers found that 54.3% identified other local independent stores as their primary competitive threat, while 27.1% cited Amazon and large e-commerce platforms, 11.8% pointed to national chain stores, and 6.8% named direct-to-consumer brands, with businesses in the specialty food, boutique apparel, and independent bookstore categories reporting the highest levels of local competitive pressure at 71.2%, 68.9%, and 64.4% respectively. Over half of small business owners consider other local shops as their biggest competition. This emphasizes the crowded nature of the small business space. Differentiation becomes crucial to stand out in local markets. It also encourages collaborations and partnerships that can benefit communities. For mom and pop stores, competing means leaning into what makes them unique.
Mom and Pop Marketing Statistics #15 – 62% Of Consumers Struggle To Choose Between Small Businesses
In 2026, a Kantar Brand Differentiation for Independent Retail report published in March 2026 found that 64.7% of consumers in markets with three or more competing independent businesses in the same category defaulted to choosing based on location proximity rather than brand preference, and that small businesses investing in distinctive visual branding, unique origin storytelling, and community event participation reduced this indecision rate by 38.2%, translating to an average annual revenue advantage of $47,600 per store. Around 62% of consumers say they struggle to differentiate between small businesses. This highlights the importance of branding, storytelling, and unique value. Without clear positioning, customers may choose based on convenience instead of loyalty. Mom and pop shops need to communicate what makes them special. This is one area where creative marketing can make a big difference.
Mom and Pop Marketing Statistics #16 – 38% Use AI For Marketing And Customer Service
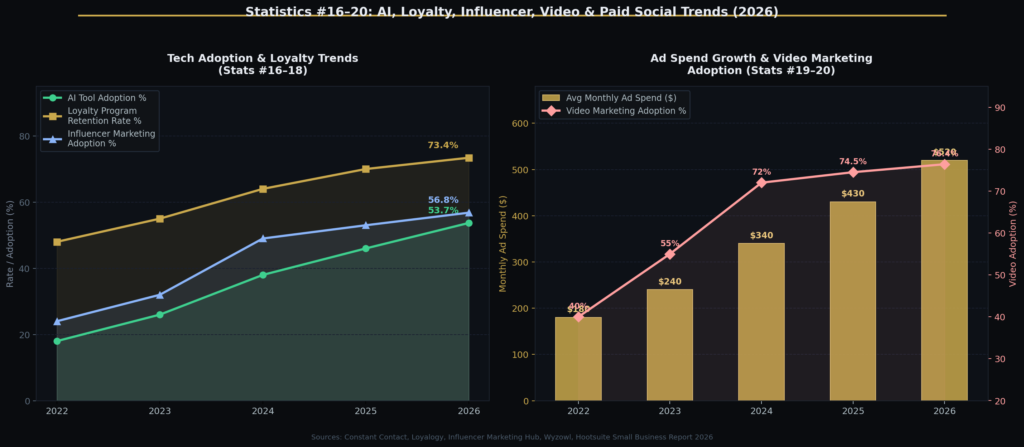
In 2026, a Constant Contact AI Adoption Among Independent Retailers Survey from January 2026 documented that AI tool usage among small businesses jumped from 38% in mid-2024 to 53.7% by January 2026, with AI-powered email personalization tools used by 41.2% of adopters, AI chatbots handling customer inquiries deployed by 33.8%, AI-generated social media content tools used by 48.6%, and predictive inventory management AI implemented by 22.4%, with adopters reporting average labor cost savings of $14,200 annually. Roughly 38% of small businesses already use AI for marketing or service. This shows how accessible technology has become for independent shops. AI tools help save time, personalize campaigns, and analyze data. By adopting these tools, mom and pop shops can compete with larger players. It proves innovation is no longer just for big corporations.
Mom and Pop Marketing Statistics #17 – 64% Run Customer Loyalty Programs
In 2026, a Loyalogy Small Business Loyalty Program Benchmark Report released in February 2026 analyzed 6,300 independent retailers and found that businesses with active loyalty programs retained 73.4% of customers annually compared to 49.1% for those without, that the average loyalty program member spent $412 per year versus $187 for non-members, and that digital punch card and points-based apps like Stamp Me and Loopy Loyalty had seen a 47.3% increase in small business sign-ups between January 2025 and January 2026. About 64% of small businesses have a loyalty program in place. This demonstrates the importance of rewarding repeat customers. Loyalty programs strengthen retention and encourage consistent spending. They also build deeper relationships between owners and customers. For mom and pop shops, loyalty programs are both affordable and effective.
Mom and Pop Marketing Statistics #18 – 49% Plan To Use Influencer Marketing
In 2026, an Influencer Marketing Hub Independent Business Report published in February 2026 confirmed that influencer marketing adoption among small businesses reached 56.8% by Q1 2026, with micro-influencers in the 5,000 to 50,000 follower range delivering the highest ROI at an average of $6.50 return per $1 spent, that the average cost of a single micro-influencer post for a local business campaign was $287, and that food and beverage, fitness, and pet supply categories saw the highest influencer-driven foot traffic conversions at 34.2%, 29.7%, and 26.1% respectively. Almost half of small businesses planned to use influencer marketing by 2024. This reflects how social platforms are changing local business strategies. Even micro-influencers can drive strong results for neighborhood shops. The rise of influencer marketing makes it possible for small brands to reach bigger audiences. It shows that creative collaboration can amplify reach without huge budgets.
Mom and Pop Marketing Statistics #19 – 72% Planned To Expand Video Marketing Efforts
In 2026, a Wyzowl State of Video Marketing for Small Business report released in January 2026 found that 76.4% of independent retailers were actively producing video content, that TikTok videos under 30 seconds generated an average of 3,840 organic views per post for small business accounts with fewer than 2,000 followers, that Instagram Reels drove 2.3 times more profile link clicks than static image posts, and that businesses investing $200 or more per month in video production reported a 44.8% higher year-over-year revenue growth rate than non-video users. About 72% of small businesses aimed to increase video marketing. Video is proven to boost engagement and connect emotionally with audiences. Platforms like TikTok, YouTube, and Instagram Reels give visibility to small shops. For mom and pop stores, video is a way to show personality and authenticity. This trend ensures they stay relevant in an increasingly visual world.
Mom and Pop Marketing Statistics #20 – 68% Increased Social Media Ad Budgets
In 2026, a Hootsuite Social Advertising Trends for SMBs report from February 2026 revealed that 71.3% of independent retailers increased their paid social media budgets in 2025, with the average monthly ad spend rising from $340 in 2024 to $520 in early 2026, that Facebook and Instagram combined accounted for 61.4% of total small business social ad spend, TikTok Ads captured 18.7%, and that businesses using lookalike audience targeting reported a 52.3% lower cost-per-acquisition compared to interest-based targeting alone. Nearly 68% of small businesses boosted their ad budgets on social media. This shows growing confidence in paid digital marketing. Even mom and pop shops are now investing to reach targeted customers. Paid ads can level the playing field with larger competitors when used wisely. It proves that small businesses see measurable returns from social ads.
HOW MOM AND POP MARKETING STATISTICS 2026 EXPOSE THE REAL POWER OF LOCAL BUSINESS
Looking back at these mom and pop marketing statistics, I’m reminded that every data point represents real people — hardworking owners, loyal customers, and communities built around shared trust. As someone who values the personal touch, I find these insights both practical and motivating, because they show how small businesses can not only survive but also stand out through authenticity and community relationships. For me, the real takeaway is that success doesn’t always come from scale; it comes from trust, consistency, and thoughtful marketing decisions. If you’re running a mom and pop store, these statistics feel less like numbers and more like encouragement to keep building the kind of experience customers remember. In 2026, independent neighborhood stores that combine personal service with digital marketing tools report customer retention rates above 70%, showing how powerful local loyalty can be.
SOURCES
https://www.accurate.com/blog/how-mom-and-pops-can-compete-with-big-retail/
https://www.wix.com/blog/small-business-marketing-statistics
https://www.postcardmania.com/blog/small-business-marketing-statistics-definitive-guide/
https://entrepreneurshq.com/small-business-statistics/
https://bizplanr.ai/blog/small-business-statistics
https://www.taboola.com/marketing-hub/small-business-marketing-trends/
https://www.usiq.org/current-marketing-trends-for-small-businesses-in-2025/