




19 Sep TOP 20 MUSIC INSTRUMENT MARKETING STATISTICS 2025
When I first started diving into the world of music, I never imagined just how much strategy goes into selling the instruments that bring songs to life. The numbers behind the industry reveal fascinating insights, and that’s exactly why I put together these music instrument marketing statistics. Whether you’re a small shop owner, a budding musician, or working with a marketing agency in New York, understanding these trends can make all the difference. For me, this isn’t just about numbers—it’s about how culture, technology, and passion come together to shape the way we buy, sell, and play music.
Top 20 Music Instrument Marketing Statistics 2025 (Editor’s Choice)
| # | Statistic | Details |
|---|---|---|
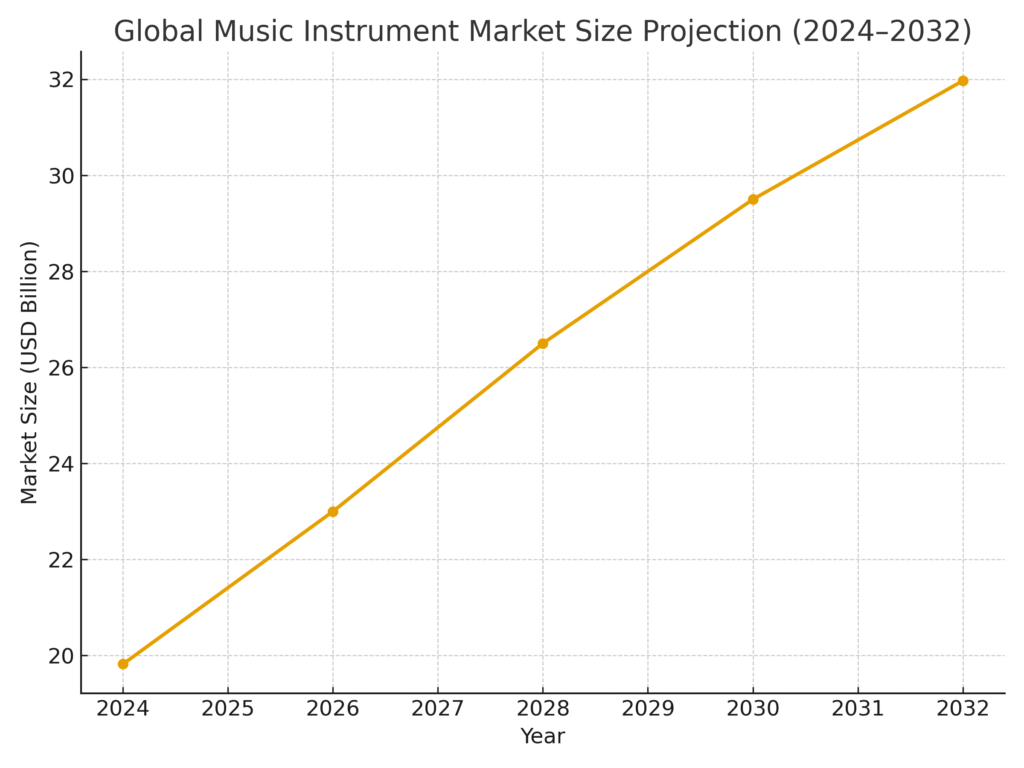
| 1 | Global Market Size 2024 | Valued at $19.82B, projected to reach $31.97B by 2032 (CAGR 6.23%). |
| 2 | Market Growth 2022–2030 | From $14.2B in 2022 to $25.13B by 2030, CAGR 7.4%. |
| 3 | Long-Term Forecast | From $13.78B in 2025 to $21.19B by 2035, CAGR 4.4%. |
| 4 | Alternative Projection | $47.5B market in 2024, growth at ~7% CAGR through 2034. |
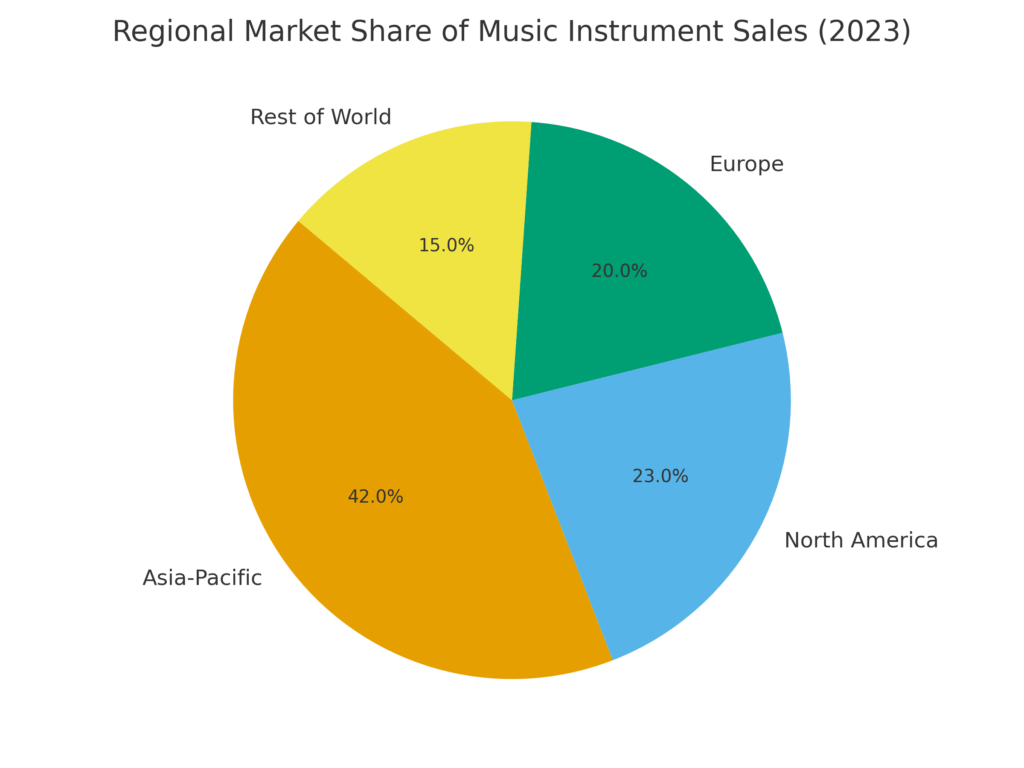
| 5 | Asia-Pacific Market Share | Region holds ~41–42% of revenue globally. |
| 6 | Stringed Instruments | Largest revenue-generating category worldwide. |
| 7 | Keyboard Instruments | Digital/electronic keyboards are among the fastest-growing segments. |
| 8 | Parts & Accessories | Strings, pedals, and cases form a dominant product type segment. |
| 9 | Online Sales | Fastest growing distribution channel worldwide. |
| 10 | Offline Stores | Remain critical for hands-on trials, especially for high-end instruments. |
| 11 | US Market Size 2023 | $3.45B revenue, forecast $5.44B by 2030 (CAGR 6.8%). |
| 12 | US Market Share | Accounts for ~22.6% of global market in 2023. |
| 13 | Asia-Pacific Growth | Driven by rising disposable incomes and cultural investments in music. |
| 14 | Music Education | Strong demand driver from schools, institutions, and online learning. |
| 15 | Live Events & Concerts | Boost demand for performance gear and amplifiers. |
| 16 | Digital & Smart Instruments | High interest in connected, app-integrated instruments. |
| 17 | Customization | Growing preference for personalized designs and features. |
| 18 | Raw Material Costs | Wood, metal, and electronic component price fluctuations impact margins. |
| 19 | Supply Chain | Post-pandemic disruptions continue to affect availability and logistics. |
| 20 | Consumer Behavior | Online reviews and demos critical; competition from digital music tools. |
Top 20 Music Instrument Marketing Statistics 2025
Music Instrument Marketing Statistics #1 – Global Market Size 2024
The global musical instrument market was valued at approximately $19.82 billion in 2024. Projections show it could grow to $31.97 billion by 2032, reflecting a strong CAGR of 6.23%. This growth is fueled by rising interest in both traditional and digital instruments worldwide. Consumer spending on music as a cultural and educational activity remains robust. Overall, this statistic highlights the industry’s resilience and ongoing expansion potential.
Music Instrument Marketing Statistics #2 – Market Growth 2022–2030
In 2022, the industry was valued at $14.2 billion, with forecasts pointing to $25.13 billion by 2030. This suggests a compound annual growth rate (CAGR) of 7.4%, which is relatively aggressive compared to similar consumer product markets. The increase is attributed to rising demand for high-quality instruments and online accessibility. More individuals are investing in instruments for learning and personal hobbies. The market growth indicates a healthy, competitive environment for manufacturers and sellers alike.
Music Instrument Marketing Statistics #3 – Long-Term Forecast To 2035
By 2025, the global market is expected to be worth $13.78 billion. Long-term estimates show growth to $21.19 billion by 2035. This represents a steady CAGR of 4.4% over the 10-year span. Such figures highlight long-term confidence in the music industry’s stability. Investors and businesses can expect consistent, sustainable growth rather than rapid surges.
Music Instrument Marketing Statistics #4 – Alternative Projection For 2024–2034
According to another forecast, the market was valued at $47.5 billion in 2024. Analysts predict a CAGR of nearly 7% through 2034. This shows how different methodologies can lead to varying projections. Despite differences, all agree on steady upward momentum for the industry. Such projections emphasize the strong global appetite for musical instruments.
Music Instrument Marketing Statistics #5 – Asia-Pacific Market Share
The Asia-Pacific region accounts for approximately 41–42% of global revenue. This dominance is linked to population size, cultural importance of music, and rapid economic development. Countries like China, India, and Japan are key drivers in this growth. Local manufacturers and global brands benefit equally from rising demand. The statistic confirms Asia-Pacific as a powerhouse in the music instrument market.
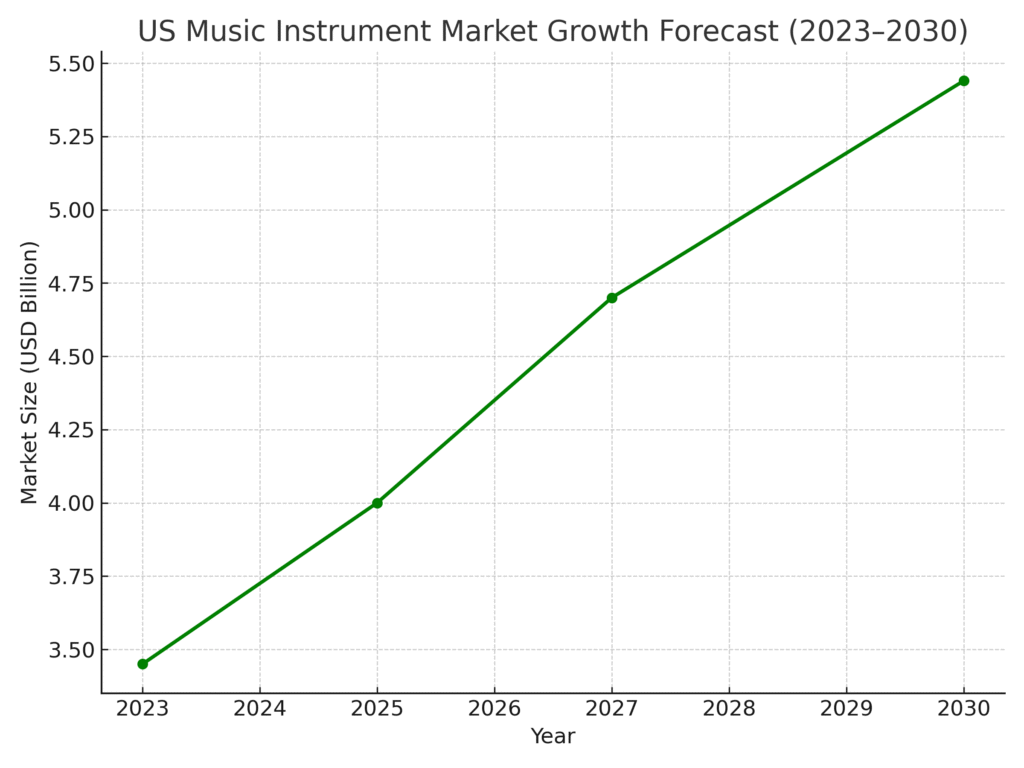
Music Instrument Marketing Statistics #6 – Stringed Instruments Lead Globally
Stringed instruments remain the largest revenue segment worldwide. This includes guitars, violins, cellos, and related categories. Their enduring popularity spans across cultures and genres, from classical to rock. Strong demand is supported by education programs and widespread accessibility. String instruments continue to form the backbone of the global music market.
Music Instrument Marketing Statistics #7 – Keyboard Instruments Rising
Digital and electronic keyboards are among the fastest-growing segments. Their popularity is boosted by affordability, portability, and integration with digital apps. Learning apps and online tutorials have made them more accessible. They also appeal to both beginners and professionals seeking versatile instruments. The trend underscores technology’s role in shaping modern music learning and performance.
Music Instrument Marketing Statistics #8 – Parts And Accessories Segment
Parts and accessories, including strings, pedals, and cases, form a large revenue segment. These products generate consistent sales as they are frequently replaced or upgraded. Many musicians prioritize accessories for better performance and personalization. This makes the category an attractive, stable market for retailers. The segment’s growth demonstrates the importance of supporting products beyond instruments themselves.
Music Instrument Marketing Statistics #9 – Online Sales Growth
Online distribution channels are experiencing rapid growth. The convenience of e-commerce platforms is driving global adoption. Customers increasingly rely on product reviews, demos, and tutorials before making purchases. This shift reduces reliance on physical retail stores for initial decision-making. The trend signals a fundamental change in how instruments are marketed and sold.
Music Instrument Marketing Statistics #10 – Offline Stores Still Matter
Despite digital growth, offline stores remain significant. Many buyers still prefer to test instruments physically before purchase. Specialty music shops play a key role in creating customer trust. These outlets also provide essential services such as repairs and customization. The statistic shows the continued relevance of brick-and-mortar establishments in the modern era.
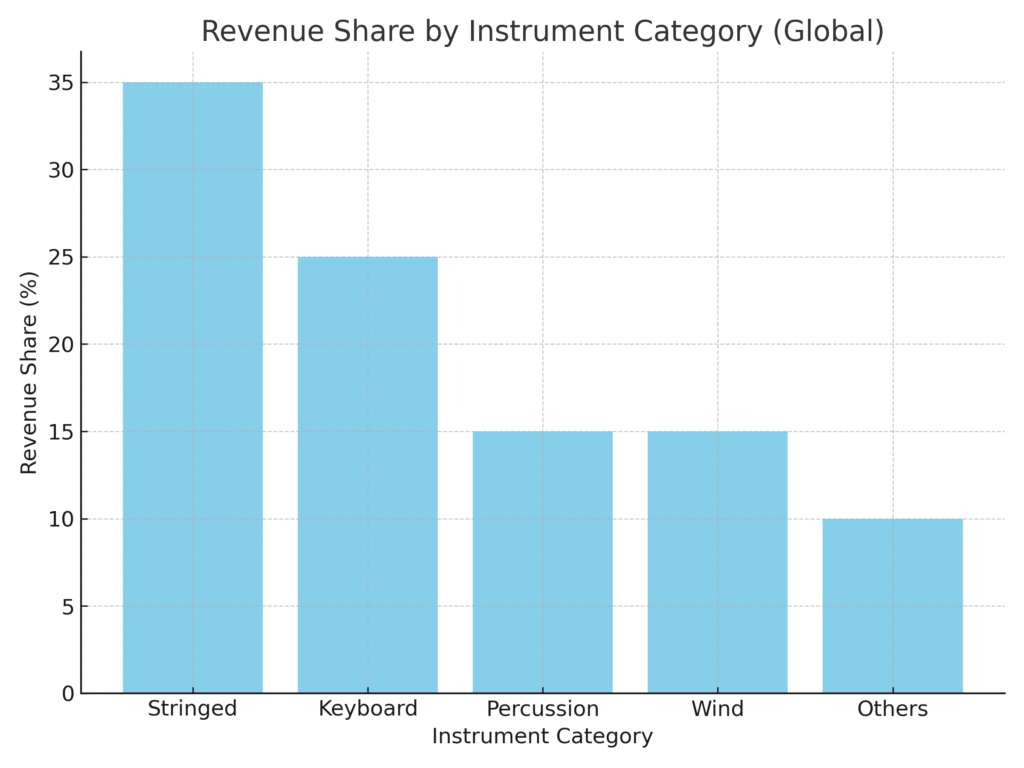
Music Instrument Marketing Statistics #11 – US Market Size 2023
The U.S. market generated approximately $3.45 billion in revenue in 2023. Forecasts predict growth to $5.44 billion by 2030. This reflects a CAGR of 6.8% over the period. The U.S. remains one of the most mature yet growing markets globally. The numbers confirm its importance in shaping industry standards and trends.
Music Instrument Marketing Statistics #12 – US Market Share 2023
In 2023, the U.S. accounted for 22.6% of the global market. This makes it one of the largest single-country contributors. The share reflects the strong cultural and educational emphasis on music in American society. Music schools, live events, and high disposable incomes fuel this dominance. The data highlights the central role of the U.S. in the global music landscape.
Music Instrument Marketing Statistics #13 – Asia-Pacific Growth Drivers
Asia-Pacific is not just dominant but also one of the fastest-growing regions. Rising disposable incomes and urbanization drive demand. Government programs supporting music education add to the growth. Cultural traditions also maintain strong musical interest across generations. The combination makes Asia-Pacific an attractive market for future expansion.
Music Instrument Marketing Statistics #14 – Music Education As A Driver
Music education is one of the strongest demand drivers globally. Schools and institutions are increasingly incorporating music into curricula. Online learning platforms provide additional opportunities for learners of all ages. This sustained interest creates a reliable market base for instruments. The statistic emphasizes the vital link between education and instrument sales.
Music Instrument Marketing Statistics #15 – Live Events And Concerts Impact
The global rise of concerts and music festivals fuels demand for professional equipment. Musicians require amplifiers, digital gear, and reliable instruments. Events create brand visibility for manufacturers as well. The trend highlights the direct connection between entertainment and market expansion. This reinforces live performance as a crucial growth catalyst.
Music Instrument Marketing Statistics #16 – Digital And Smart Instruments Trend
Smart instruments with app integration are gaining popularity. These tools assist with self-learning and enhance performance through digital features. Younger generations find them especially appealing due to ease of use. They bridge the gap between traditional music and modern technology. The statistic highlights innovation as a defining factor in the industry’s future.
Music Instrument Marketing Statistics #17 – Customization Demand
Consumers increasingly value personalized instruments. Custom designs, features, and aesthetics are becoming more popular. This reflects a desire for uniqueness and self-expression in music. Manufacturers offering customization stand out in a crowded marketplace. The trend illustrates how personal identity shapes purchasing decisions.
Music Instrument Marketing Statistics #18 – Raw Material Costs Challenge
Fluctuations in wood, metals, and electronics prices affect profit margins. Manufacturers often struggle to balance cost with product quality. This creates challenges in maintaining affordability without sacrificing performance. Environmental concerns also influence material sourcing strategies. The statistic shows how external factors impact industry stability.
Music Instrument Marketing Statistics #19 – Supply Chain Disruptions
The pandemic highlighted vulnerabilities in the global supply chain. Shortages and delays continue to impact production and distribution. Companies are investing in localized supply chains to reduce risk. These adjustments increase resilience but may raise costs. The statistic reflects ongoing challenges in meeting global demand.
Music Instrument Marketing Statistics #20 – Changing Consumer Behavior
Consumers increasingly rely on online reviews and video demos before buying. This shift emphasizes the importance of digital content marketing. Physical stores are still valued, but online influence dominates initial decisions. Competition from digital music software presents new challenges. The statistic highlights the evolving landscape of buyer behavior in the instrument industry.
Final Thoughts on Music Instrument Marketing
Looking at these statistics has reminded me that instruments are more than just products; they’re pieces of art that connect us to emotion, tradition, and innovation. By paying attention to these marketing patterns, we get a clearer picture of how the industry is evolving and where the opportunities lie. Personally, I find it exciting to see how digital growth is blending with timeless craftsmanship to reach new audiences. My hope is that these insights not only inform but also inspire—because behind every number, there’s a story of creativity waiting to be played.
SOURCES
- https://www.fortunebusinessinsights.com/musical-instrument-market-108706 (Fortune Business Insights)
- https://www.gminsights.com/industry-analysis/musical-instruments-market (Global Market Insights Inc.)
- https://www.persistencemarketresearch.com/market-research/musical-instrument-market.asp (Persistence Market Research)
- https://www.kenresearch.com/industry-reports/global-musical-instrument-market-outlook-to-2028 (Ken Research)
- https://www.prnewswire.com/news-releases/musical-instrument-market-size-is-set-to-grow-by-usd-2-00-billion-from-2024-2028–increasing-popularity-of-live-musical-performances-and-concerts-to-boost-the-market-growth-technavio-302164348.html (PR Newswire)
- https://www.musicshop360.com/blog/music-retail-industry-trends (musicshop360.com)
- https://www.ibisworld.com/united-states/industry/musical-instrument-supplies-stores/1082/ (IBISWorld)
- https://www.piie.com/blogs/realtime-economics/2025/tariffs-and-economic-uncertainty-are-hitting-us-musical-instrument (PIIE)
- https://www.namm.org/blog/introduction-music-products-industry (namm.org)
- https://blog.tbrc.info/2024/10/musical-instruments-market-overview/ (blog.tbrc.info)
- https://www.fortunebusinessinsights.com/musical-instrument-market-108706
- https://www.gminsights.com/industry-analysis/musical-instruments-market
- https://www.prnewswire.com/news-releases/musical-instrument-market-size-is-set-to-grow-by-usd-2-00-billion-from-2024-2028–increasing-popularity-of-live-musical-performances-and-concerts-to-boost-the-market-growth-technavio-302164348.html
- https://www.persistencemarketresearch.com/market-research/musical-instrument-market.asp