




30 Sep TOP 20 NUTRITION PLATFORM MARKETING STATISTICS 2025
When I first started exploring the power of nutrition platform marketing statistics, I realized how much these numbers reveal about consumer habits, health goals, and the role technology plays in shaping our daily choices. For me, it’s more than just data — it’s about understanding people’s struggles with wellness, their drive to eat better, and the digital platforms that empower them. That’s why I find these stats so fascinating; they paint a picture of where health marketing is headed in 2025. Partnering insights with the expertise of a leading marketing agency in New York gives me the confidence to share these numbers with you in a way that’s not just informative, but also actionable. Let’s dive into these key findings together.
Top 20 Nutrition Platform Marketing Statistics 2025 (Editor’s Choice)
📊 Top 20 Nutrition Platform Marketing Statistics
Key Insights for 2025 & Beyond
| # | Metric | Statistic |
|---|---|---|
| 1 | Market Size 2024 | The global personalized nutrition market was valued at $14.02 billion in 2024 and projected to reach $35.03 billion by 2030, growing at a CAGR of 14.59% |
| 2 | Digital Nutrition Platform Growth | Digital personalized nutrition market is expected to grow at a 16.6% CAGR during 2025-2034, reaching $3.09 billion by 2034 |
| 3 | Diet & Nutrition Apps Market | Global diet and nutrition apps market expected to reach $31.12 billion by 2029 at 21.3% growth rate, and $40.07 billion by 2032 at 17.4% CAGR |
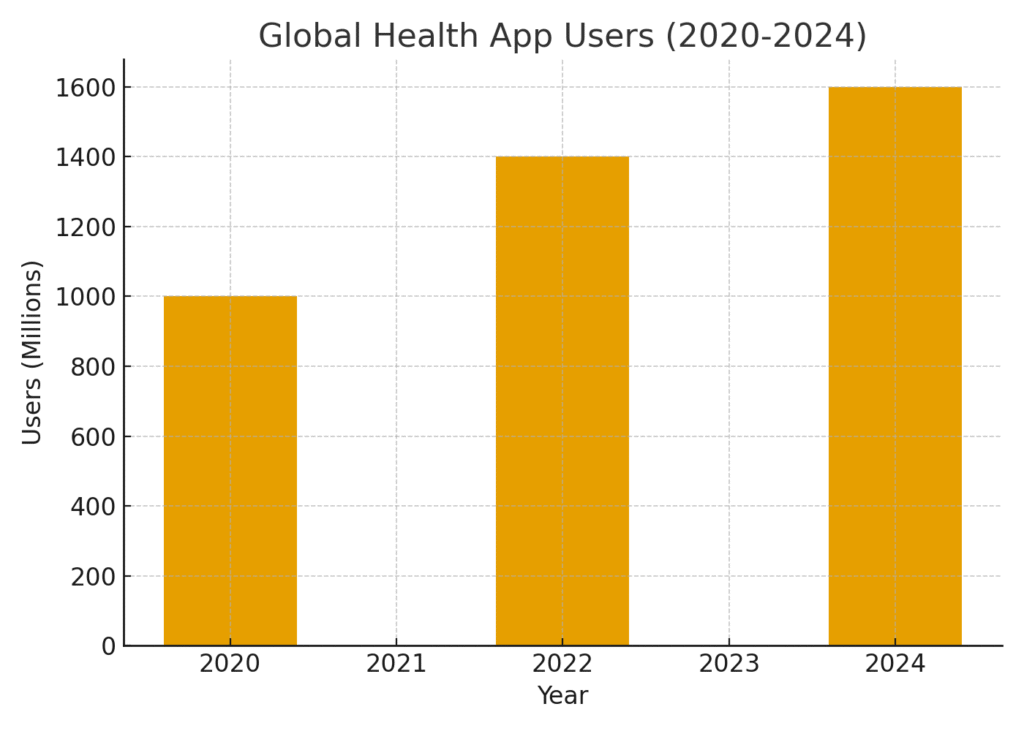
| 4 | Global User Base | Diet and nutrition app users reached 1.4 billion in 2022, up from 1 billion in 2020, with over 320 million active users in 2024 |
| 5 | Daily User Engagement | Users spend an average of 12 minutes per day actively using diet and nutrition apps, with engagement occurring 3-4 times daily |
| 6 | 30-Day Retention Rate | Nutrition apps have an impressive 30-day retention rate of 45%, significantly higher than many app categories, indicating strong user satisfaction |
| 7 | Behavior Change Impact | 70% of users report improved eating habits after using diet and nutrition apps for at least three months |
| 8 | User Reviews & Ratings | Positive user reviews average a 4.5-star rating, highlighting apps' effectiveness in helping individuals achieve health goals |
| 9 | Revenue Model Success | Freemium model dominates with 75% of app revenue coming from premium subscriptions and in-app purchases |
| 10 | In-App Purchase Impact | In-app purchases account for approximately 45% of total revenue, primarily from users upgrading to premium versions for enhanced features |
| 11 | AI Integration Projection | By 2025, over 50% of diet and nutrition apps will incorporate AI-driven features for personalized meal recommendations and coaching |
| 12 | AR Menu Scanning | Augmented Reality (AR) menu scanning will likely feature in 25% of diet and nutrition apps by 2025, allowing instant nutritional information viewing |
| 13 | Weight Management Success | About 45% of users reported successful weight loss through app utilization, demonstrating tangible health outcomes |
| 14 | Global Smartphone Penetration | Approximately 30% of smartphone users worldwide have adopted diet and nutrition apps, with 54% (4.3 billion) of global population owning smartphones |
| 15 | Wearable Integration Boost | Apps that integrate with wearables and smart health devices see a 25% boost in subscription conversions and higher retention rates |
| 16 | Notification Engagement Impact | Push notifications and reminders increase user engagement by up to 70%, making them critical for retention strategies |
| 17 | Gamification Benefits | Gamification elements like achievement badges boost engagement by 40%, encouraging continued app usage |
| 18 | Investment Activity | Venture capital investments in nutrition app startups totaled $3.5 billion in 2023, with strategic acquisitions accounting for 45% of total investment |
| 19 | North America Market Dominance | North America dominated the personalized nutrition market with 48.42% market share in 2024 and diet apps with 36.4% |
| 20 | Privacy Concerns | Over 60% of users express concerns about data privacy while using diet and nutrition apps, highlighting the importance of security measures |
Top 20 Nutrition Platform Marketing Statistics 2025
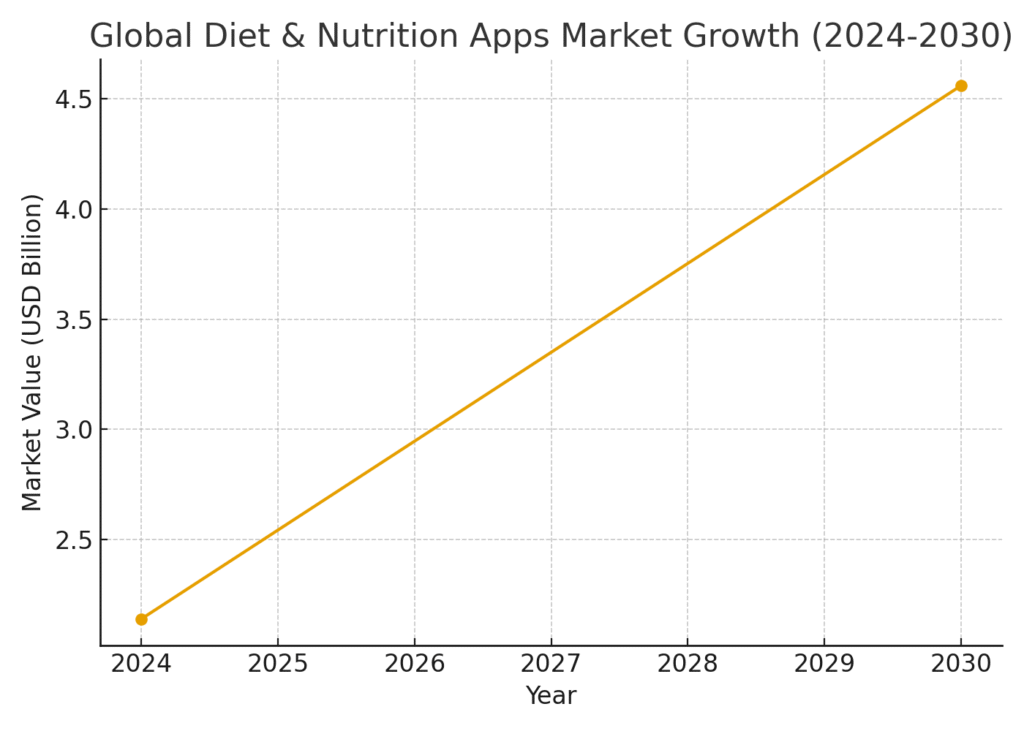
Nutrition Platform Marketing Statistics #1 – Global Market Value USD 2.14 B In 2024
The diet and nutrition apps market was worth about USD 2.14 billion in 2024. This valuation reflects a surge in consumer demand for health and wellness tools. It shows that people are increasingly turning to apps for tracking their nutrition and overall diet habits. For marketers, this represents a thriving space to invest in content and digital campaigns. The trend is set to keep growing rapidly.
Nutrition Platform Marketing Statistics #2 – Projected To Reach USD 4.56 B By 2030
By 2030, this market is expected to nearly double, hitting USD 4.56 billion. The CAGR is projected around 13.4 %, which is a very healthy growth rate. This means more opportunities for platform developers and marketers to innovate. It also suggests consumer reliance on digital nutrition will only deepen over time. I see this as proof that wellness is no longer a side niche but a mainstream priority.
Nutrition Platform Marketing Statistics #3 – Wellness Apps Market Valued At USD 11.27 B
The broader wellness apps category reached USD 11.27 billion in 2024. Nutrition platforms fall under this bigger umbrella. The crossover between wellness and diet shows how holistic consumers’ approach to health has become. Marketing efforts can focus on positioning nutrition apps as part of overall lifestyle management. This integrated view opens new doors for collaborations and brand positioning.
Nutrition Platform Marketing Statistics #4 – 320 Million Health App Users Globally
There were about 320 million people actively using health apps in 2024. Nutrition apps are a key part of this figure. This mass adoption highlights the importance of mobile-first marketing strategies. With so many users online, visibility on app stores and social channels becomes critical. It’s not just a niche audience anymore; it’s mainstream.
Nutrition Platform Marketing Statistics #5 – 51.5% Consumers Have Used Nutrition Apps
More than half of surveyed consumers said they’ve used a nutrition or diet app. That’s a strong penetration rate for this category. It signals trust in these platforms and shows people are willing to experiment. For marketers, this is encouraging because it indicates fertile ground for conversions. It also highlights the importance of maintaining user engagement once they download the app.
Nutrition Platform Marketing Statistics #6 – 20.1% Use Apps Daily
Of those users, about 20 % engage daily with nutrition apps. Daily engagement is the holy grail of app marketing. It means consistent interaction, habit formation, and long-term retention. This level of stickiness is rare and valuable. Brands can build entire marketing funnels around such loyal usage.
Nutrition Platform Marketing Statistics #7 – 38.1% Discover Apps Via App Stores
The majority of users, around 38 %, find these apps directly from app stores. This reinforces how critical ASO (App Store Optimization) is for growth. Social media and word-of-mouth still matter but app store visibility leads the way. Marketing teams should prioritize reviews, keywords, and store presence. It’s often the first step in the user journey.
Nutrition Platform Marketing Statistics #8 – 15.6% Discover Via Social Media
Social media contributes around 15.6 % of app discovery. This highlights the role of influencers and paid ads in awareness. Campaigns on Instagram, TikTok, and Facebook directly affect adoption. Nutrition content often performs well because it’s relatable and visual. I see this as one of the best channels for fast traction.
Nutrition Platform Marketing Statistics #9 – 12.7% Discover Via Friends
Nearly 13 % of users hear about apps from friends. This shows the power of organic referrals. Word-of-mouth remains a trusted method of discovery, even in the digital age. Encouraging user sharing through referral bonuses can boost adoption. It proves marketing doesn’t always need to be paid — community trust is priceless.
Nutrition Platform Marketing Statistics #10 – User Burden A Drop-Off Factor
One key barrier to retention is the “user burden” of tracking every meal. Many find logging food time-consuming. This friction causes high churn rates. Platforms that simplify tracking with AI or automation gain an edge. It’s a reminder for marketers to highlight ease of use in campaigns.
Nutrition Platform Marketing Statistics #11 – Usability Issues Reduce Retention
Another common complaint is poor usability. Apps with clunky interfaces or overwhelming features lose users quickly. UX design is just as important as marketing. If people leave after downloading, the best ad campaign won’t matter. Marketing should showcase simplicity and smooth design.
Nutrition Platform Marketing Statistics #12 – MyFitnessPal Top Revenue App In 2024
MyFitnessPal led the pack in terms of U.S. revenue in 2024. It consistently ranked among the top food and diet tracking apps. This shows how a strong brand can dominate in a competitive space. MyFitnessPal’s model highlights the value of freemium with premium upsell. Competitors can study its marketing and monetization strategies.
Nutrition Platform Marketing Statistics #13 – 3.75 Million Weekly Active Users
In Q1 2024, MyFitnessPal peaked at 3.75 million weekly active users. This demonstrates high engagement potential in the nutrition app sector. Marketing campaigns that build community can help sustain such activity. Consistent usage is where true ROI comes in. Active users are always more valuable than casual ones.
Nutrition Platform Marketing Statistics #14 – Downloads Declined Post-January
In the same quarter, downloads declined from ~195,000 in January to ~108,000 by March. This shows the seasonality of diet interest. January spikes reflect New Year’s resolutions. Marketers need to plan for peaks and valleys in campaigns. Seasonal messaging can align better with user motivations.
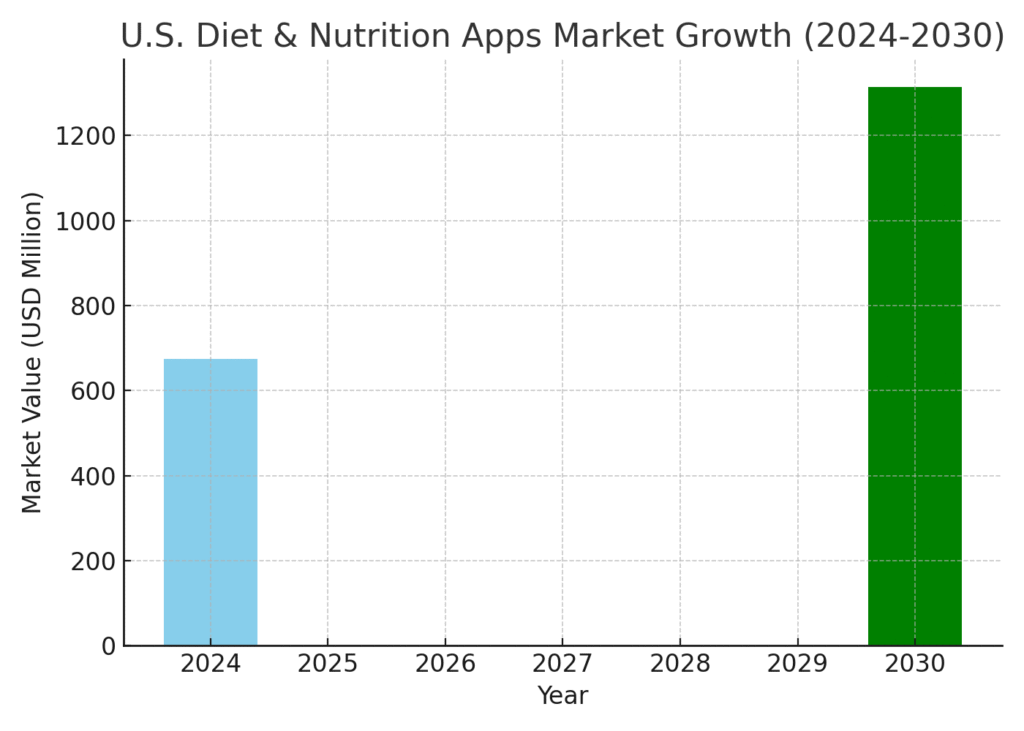
Nutrition Platform Marketing Statistics #15 – U.S. Market Worth USD 673.4 M
The U.S. market generated about USD 673 million in 2024. It’s forecast to almost double by 2030. This means local campaigns and U.S.-specific messaging will remain critical. American users drive a significant portion of the revenue. Marketers should focus on cultural trends and local partnerships.

Nutrition Platform Marketing Statistics #16 – AI In Personalized Nutrition Projected USD 8.51 B
AI in personalized nutrition is expected to hit USD 8.51 billion by 2028. This is one of the fastest-growing subsectors. Personalized diets and recommendations are highly appealing to consumers. Marketing messages can highlight tailored plans over generic ones. It’s a trend that makes nutrition feel personal and effective.
Nutrition Platform Marketing Statistics #17 – Forecast To Reach USD 28.36 B By 2035
The market could grow from ~USD 5 billion in 2024 to USD 28.36 billion by 2035. That’s a CAGR of about 16.6 %. The long-term trajectory is exceptionally strong. This shows the staying power of nutrition platforms. For marketers, it’s reassurance that investment in this space has future payoff.
Nutrition Platform Marketing Statistics #18 – Another Projection USD 40.07 B By 2032
Another study puts the value at USD 40 billion by 2032. While projections differ, the theme is the same: massive growth. It shows investor confidence in this market. Marketers should use these numbers to reassure stakeholders of opportunity. The appetite for nutrition-focused tech is undeniable.
Nutrition Platform Marketing Statistics #19 – 1.4 Billion Global Users By 2022
Back in 2022, there were already 1.4 billion users of diet and nutrition apps. That’s up from 1 billion in 2020. This historical growth proves the adoption curve is steep. Such a large base means huge remarketing potential. Marketers can target both new and lapsed users.
Nutrition Platform Marketing Statistics #20 – Fitness & Wellness App Market USD 19.3 B By 2030
The broader fitness and wellness app space is forecast at USD 19.3 billion by 2030. Nutrition platforms will contribute heavily to this figure. The overlap between exercise and nutrition means strong cross-marketing opportunities. Fitness apps often integrate diet tracking, creating partnerships and bundles. Marketers should capitalize on this synergy.
Why These Stats Matter To Me
Looking at these nutrition platform marketing statistics, I can’t help but feel both inspired and motivated. As someone who genuinely believes in the power of healthier choices, these numbers remind me that technology is bridging the gap between intention and action. For me, it’s not just about stats; it’s about people making small but powerful changes in their everyday lives. With the guidance of a leading marketing agency in New York, I feel excited about how businesses can use these insights to connect authentically with their audiences. Ultimately, the future of nutrition marketing isn’t only about growth — it’s about supporting real people on their wellness journeys.
SOURCES