



29 Sep TOP 20 OCEAN ENERGY MARKETING STATISTICS 2025
As someone who has always been fascinated by the intersection of sustainability and innovation, I’m excited to share some of the most important ocean energy marketing statistics shaping 2025. This sector is not only about harnessing the power of the sea but also about communicating its potential to investors, governments, and communities in a way that drives meaningful growth. While researching, I turned to trusted insights and collaborated with a marketing agency in New York, known as a leading marketing agency in New York, to better understand how these statistics can be leveraged to create real-world impact. For me, it’s about more than just numbers—it’s about how we tell the story of ocean energy to inspire both adoption and investment.
Top 20 Ocean Energy Marketing Statistics 2025 (Editor’s Choice)
| # | Statistic | Details |
|---|---|---|
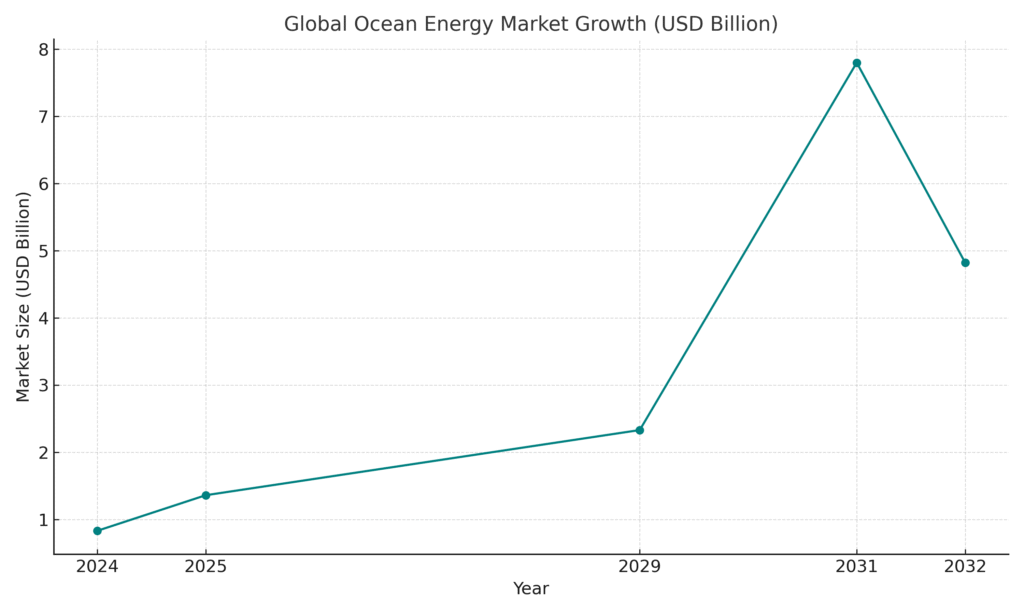
| 1 | Global Market Size (2024) | Valued at USD 0.83 billion in 2024. |
| 2 | Forecast Growth to 2029 | Projected to reach USD 2.33 billion, CAGR ~23.1%. |
| 3 | Extended Growth Forecast (2031) | Expected to hit USD 7.8 billion by 2031 (CAGR ~35.4%). |
| 4 | Ocean Power Market | Growing from USD 1.36B in 2025 to USD 4.82B in 2032. |
| 5 | Marine Energy Market | USD 2.1B in 2024, projected CAGR ~8.1% through 2034. |
| 6 | Wave & Tidal Segment | USD 970M in 2023 → USD 6.5B by 2030 (CAGR ~32.9%). |
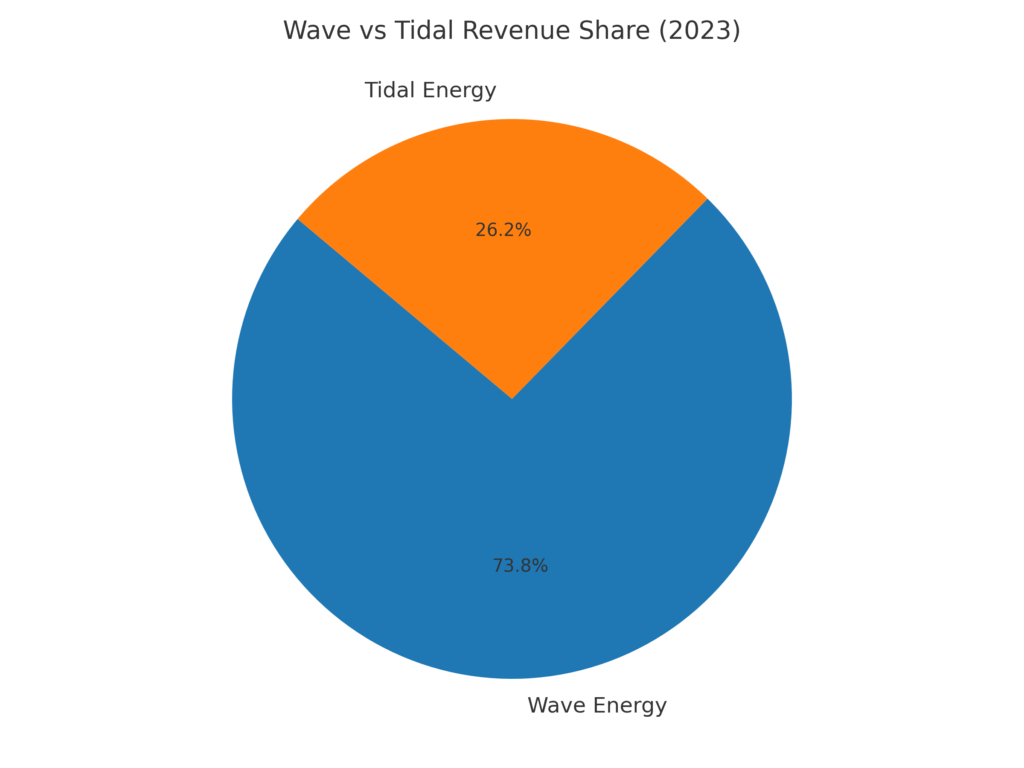
| 7 | Dominance of Wave Energy | 73.8% revenue share in 2023 wave+tide market. |
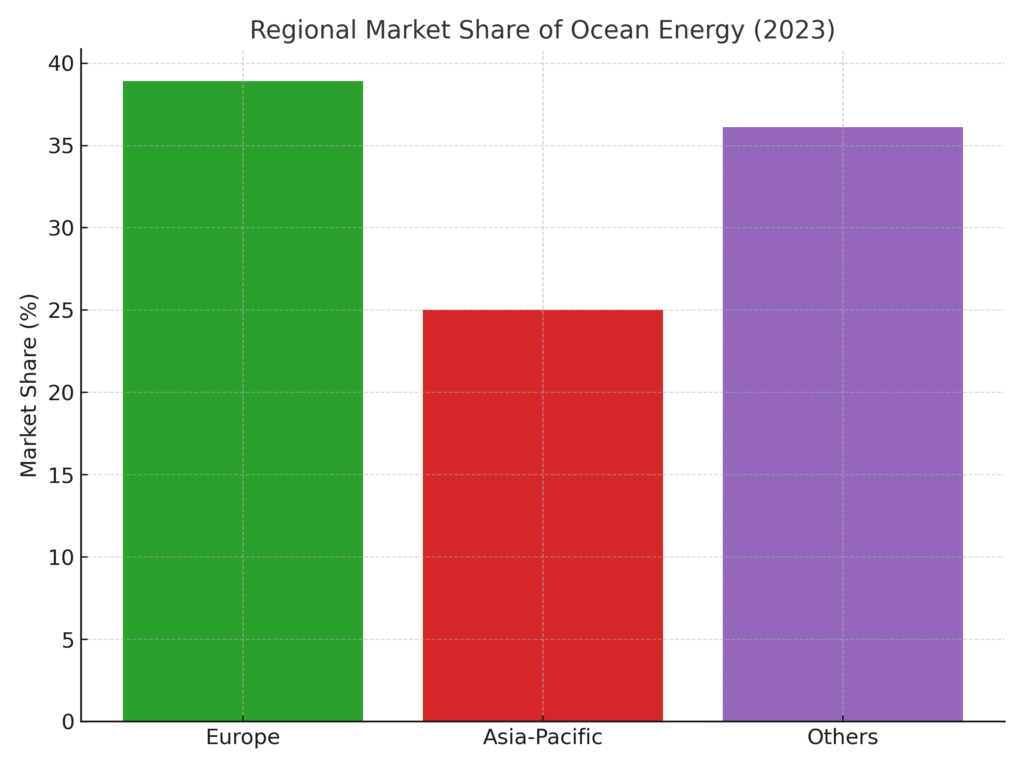
| 8 | Regional Leadership | Europe ~38.9% in 2023; Asia-Pacific fastest growing. |
| 9 | Investments in Europe | €60M in private funding since 2023. |
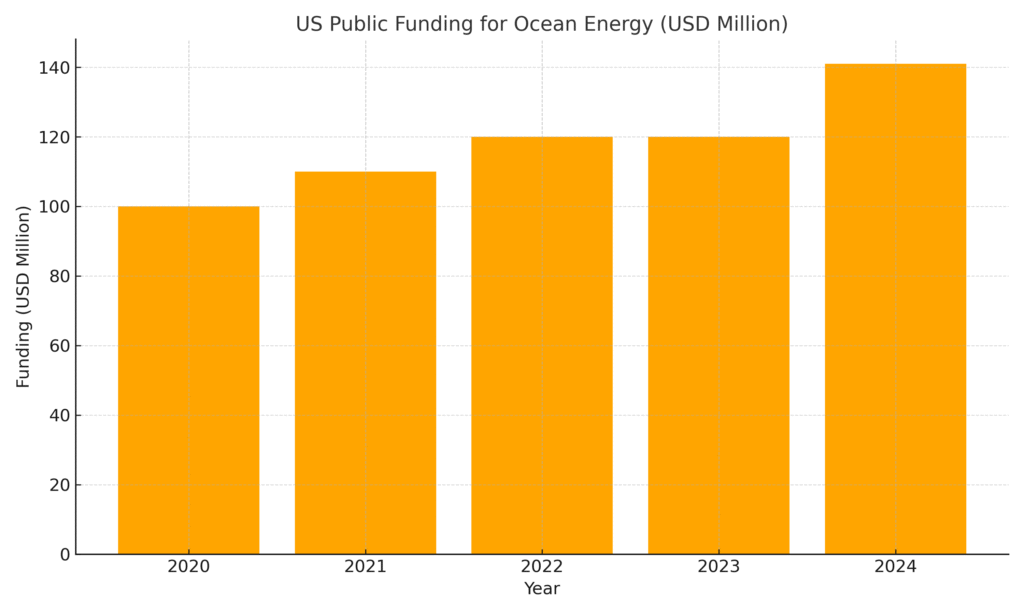
| 10 | US Public Support (2024) | USD 141M allocated, highest annual funding ever. |
| 11 | 5-Year US Support | USD 591M in public funding over past 5 years. |
| 12 | Europe Project Pipeline | 165 MW pipeline across 15 farms for next 5 years. |
| 13 | Electricity Production (Europe) | 106 GWh generated in 2024 from ocean energy. |
| 14 | Tidal Installations (2024) | 1.418 kW of new tidal capacity installed in Europe. |
| 15 | MeyGen Tidal Farm | Largest tidal project with 4×1.5MW turbines in Phase 1A. |
| 16 | Morlais Tidal Zone | Wales project approved for up to 240 MW capacity. |
| 17 | Global Current Potential | Theoretical total power ~5,000 GW worldwide. |
| 18 | Florida Gulf Stream | 1/1000 capture could meet ~35% of Florida’s demand. |
| 19 | Technology Innovation | New tidal kites & smart monitoring improve efficiency. |
| 20 | End-Use Applications | Power generation, desalination, water pumping, utilities. |
Top 20 Ocean Energy Marketing Statistics 2025
Ocean Energy Marketing Statistics #1: Global Market Size (2024)
The global ocean energy market reached a value of USD 0.83 billion in 2024. This number highlights the industry’s emerging role in renewable energy while still being at an early growth stage. It reflects both the potential of ocean power and the cautious pace of large-scale adoption. Investors are watching this figure closely to determine the pace of commercial viability. For marketers, it serves as a baseline for positioning ocean energy as a rapidly growing renewable solution.
Ocean Energy Marketing Statistics #2: Forecast Growth To 2029
By 2029, the market is projected to hit USD 2.33 billion, growing at a CAGR of 23.1%. This impressive growth indicates strong confidence in ocean energy’s long-term role in the global energy mix. Such projections are essential for drawing both public and private sector investments. They also provide momentum for policymakers to include ocean energy in sustainability plans. Marketers can use this forecast to emphasize growth-driven opportunities in renewable branding campaigns.
Ocean Energy Marketing Statistics #3: Extended Growth Forecast (2031)
Analysts expect the market to surge to USD 7.8 billion by 2031, with a CAGR of nearly 35.4%. This aggressive growth forecast shows the scalability of ocean energy once infrastructure matures. It also indicates that early adopters could reap significant benefits as the industry takes off. By framing ocean energy as a futuristic investment, marketers can target innovation-focused stakeholders. This data point reflects how ocean power could transform from niche to mainstream in less than a decade.
Ocean Energy Marketing Statistics #4: Ocean Power Market Growth
The ocean power market alone is expected to grow from USD 1.36 billion in 2025 to USD 4.82 billion by 2032. This segment growth underlines the diversity of technologies within the ocean energy umbrella. It includes wave, tidal, and current-based energy solutions, each with unique benefits. Such rapid expansion makes it appealing for global partnerships and R&D investment. Marketing professionals can leverage these projections to showcase the future potential of diversified ocean energy solutions.
Ocean Energy Marketing Statistics #5: Marine Energy Market Expansion
The marine energy market was valued at USD 2.1 billion in 2024 and is set to grow at 8.1% CAGR through 2034. This demonstrates steady growth that appeals to long-term investors and policymakers. The market represents opportunities for sustainable energy transitions across coastal regions. For brands, positioning ocean energy as reliable and steadily expanding enhances credibility. Such consistent growth forecasts reassure stakeholders about long-term viability and investment safety.
Ocean Energy Marketing Statistics #6: Wave & Tidal Segment Growth
The wave and tidal energy segment was valued at USD 970 million in 2023 and is forecast to reach USD 6.5 billion by 2030. This growth rate of nearly 33% annually emphasizes the untapped potential in marine energy. It highlights the commercial promise of wave and tidal projects compared to other renewables. These projections encourage governments and investors to accelerate pilot projects and scaling. Marketers can highlight these figures as proof that wave and tidal systems are quickly gaining traction.
Ocean Energy Marketing Statistics #7: Dominance Of Wave Energy
Wave energy accounted for 73.8% of the combined wave and tidal energy market in 2023. This dominance reflects the current preference for wave-based systems among developers. It suggests that wave energy has reached greater maturity compared to tidal. This market distribution provides direction for R&D funding and resource allocation. Marketers can stress the proven dominance of wave energy to build confidence in ocean technologies.
Ocean Energy Marketing Statistics #8: Regional Leadership
Europe accounted for 38.9% of the wave and tidal market in 2023, making it the global leader. Asia-Pacific, however, is emerging as the fastest-growing region for future deployments. This dual trend shows both regional dominance and untapped global growth potential. Europe benefits from policy support and innovation hubs, while Asia-Pacific relies on resource-rich coastlines. Marketers can use these regional statistics to showcase international opportunities and policy success stories.
Ocean Energy Marketing Statistics #9: Investments In Europe
Since 2023, private investors have poured €60 million into European ocean energy. This shows growing confidence in the region’s innovation pipeline. Such investments boost credibility for ocean energy developers and startups. They also highlight Europe’s role as a testing ground for commercialization. Marketers can frame these numbers as evidence of rising private interest, signaling momentum for the sector.
Ocean Energy Marketing Statistics #10: US Public Support (2024)
In 2024, the United States allocated USD 141 million in public funding for ocean energy. This was the highest single-year investment ever made in the sector. It demonstrates the government’s recognition of ocean energy as part of the clean energy transition. Such public support often catalyzes private sector interest and partnerships. Marketers can highlight this milestone as a turning point in U.S. renewable policy.
Ocean Energy Marketing Statistics #11: Five-Year US Support
Over the past five years, the U.S. has committed USD 591 million to ocean energy. This consistent funding strengthens developer confidence in long-term policy backing. It allows projects to move from concept to demonstration stage. Such investment levels also promote job creation in coastal economies. For marketers, these numbers can be used to show long-term stability and government commitment.
Ocean Energy Marketing Statistics #12: Europe Project Pipeline
Europe has 165 MW of ocean energy projects in the pipeline across 15 farms, set to deploy in the next five years. This signals strong growth in upcoming infrastructure development. The pipeline reflects concrete progress rather than just projections. It also validates the impact of policy incentives in stimulating large-scale projects. Marketers can present these figures to show the scale and readiness of Europe’s ocean energy rollout.
Ocean Energy Marketing Statistics #13: Electricity Production In Europe
In 2024, Europe generated 106 GWh of electricity from ocean energy. This output represents a growing contribution to renewable energy supply. It also shows the transition from experimental to operational phase in the sector. The figure proves that ocean energy is not just theoretical but actively powering grids. Marketers can highlight this as tangible proof of the technology’s effectiveness.
Ocean Energy Marketing Statistics #14: Tidal Installations (2024)
Europe added 1.418 kW of new tidal energy capacity in 2024. While modest, these installations demonstrate progress in device testing and scaling. Every new capacity milestone adds to the sector’s learning curve. Such incremental growth reflects resilience in overcoming technical barriers. Marketers can frame these developments as stepping stones toward larger tidal deployments.
Ocean Energy Marketing Statistics #15: MeyGen Tidal Farm
The UK’s MeyGen tidal farm is the largest operational project of its kind, with four 1.5 MW turbines in Phase 1A. This flagship project showcases the feasibility of large-scale tidal energy. It has become a symbol of innovation and leadership in ocean renewables. Projects like MeyGen inspire global replication and investor confidence. For marketers, it represents a success story that validates the sector’s potential.
Ocean Energy Marketing Statistics #16: Morlais Tidal Zone
The Morlais tidal project in Wales has approval for up to 240 MW capacity. This large-scale consent demonstrates confidence in tidal’s future contribution to energy grids. It signals a shift from small-scale trials to utility-level projects. Such approvals create ripple effects in policy, funding, and public trust. Marketers can emphasize these figures to portray tidal energy as ready for mainstream adoption.
Ocean Energy Marketing Statistics #17: Global Current Potential
Ocean currents worldwide carry an estimated 5,000 GW of theoretical energy potential. This staggering number highlights the vast untapped renewable source in the seas. Only a fraction of this potential is needed to transform global energy mixes. It provides a strong narrative for the scalability of marine technologies. Marketers can use this statistic to stress the limitless potential of ocean energy.
Ocean Energy Marketing Statistics #18: Florida Gulf Stream
If just 1/1000 of the Gulf Stream’s power was harnessed, it could provide 35% of Florida’s electricity needs. This example underscores the practical potential of regional ocean currents. It also demonstrates how localized solutions can meet large-scale demand. Such statistics make the concept of ocean energy more relatable to everyday needs. Marketers can leverage this to create compelling, region-specific narratives.
Ocean Energy Marketing Statistics #19: Technology Innovation
Innovations like tidal kites and smart monitoring systems are improving performance. These technologies expand deployment opportunities in lower-flow waters. They also reduce maintenance costs by increasing efficiency. Innovation is central to making ocean energy competitive with mature renewables. Marketers can emphasize these advancements to present the sector as forward-thinking and future-ready.
Ocean Energy Marketing Statistics #20: End-Use Applications
Ocean energy is applied in power generation, desalination, and water pumping. Such versatility makes it valuable for both grid-scale and community-level projects. Coastal and island communities stand to benefit the most from these solutions. By addressing water and energy challenges simultaneously, ocean energy proves its adaptability. Marketers can highlight this multi-use potential as a key advantage over other renewables.
Why These Ocean Energy Marketing Statistics Matter
Looking over these ocean energy marketing statistics, I can’t help but feel hopeful about the future of renewable power. The data highlights incredible opportunities for growth, but also reminds me of the importance of framing the narrative in ways that resonate with businesses and communities. By understanding and applying these insights, marketers and innovators alike can help accelerate ocean energy into the mainstream. Personally, I see these stats as both a roadmap and an inspiration—they show us where the industry is headed and how we can contribute to its momentum. And with the guidance of a trusted partner like a leading marketing agency in New York, I believe we can turn these possibilities into lasting achievements.
SOURCES
- https://blog.sintef.com/energy/ocean-grid-development-energy-market-analysis-perspectives/
- https://www.ren21.net/gsr-2024/modules/energy_supply/02_market_and_industry_trends/06_oceanpower/
- https://patentpc.com/blog/tidal-wave-energy-growth-how-viable-is-it-market-expansion-stats
- https://www.emec.org.uk/blog-ocean-energy-reports-focus-on-unprecedented-generation-increasing-the-need-for-revenue-support/
- https://www.offshore-energy.biz/marineenergy/
- https://oceanconservancy.org/blog/2024/09/20/effects-wave-tidal-energy/
- https://www.pmec.us/news-blog/tag/Marine%2BEnergy
- https://blog.sintef.com/ocean/an-ocean-of-opportunities-norway-as-a-driver-of-wave-energy-development/
- https://www.orbitalmarine.com/news/
- https://www.bluespring.blue/blogs
- https://freefutures.org/exploring-marine-energy/
- https://gobulk.com.au/ocean-energy/
- https://www.energy.gov/eere/water/articles/eight-things-know-about-marine-energy-hint-its-not-just-ocean-energy
- https://www.pnnl.gov/marine-energy
- https://oceanconservancy.org/climate/clean-ocean-energy/
- https://understand-energy.stanford.edu/energy-resources/renewable-energy/ocean-energy
- https://www.energy.gov/eere/water/articles/marine-energy-united-states-overview-opportunities