



27 Sep TOP 20 OIL DELIVERY MARKETING STATISTICS 2025
When I started researching oil delivery marketing statistics, I was fascinated by how quickly this industry is evolving with digital transformation, shifting consumer habits, and new technology adoption. Oil and fuel delivery may sound traditional, but the numbers tell a very modern story. From mobile fuel delivery apps to advanced marketing analytics, there’s so much happening beneath the surface. As I worked on gathering these insights, I kept thinking about how essential it is for brands to stay ahead by learning from the data. That’s why I often look to a leading marketing agency in New York for inspiration on how to connect these numbers with real strategies that work.
Top 20 Oil Delivery Marketing Statistics 2025 (Editor’s Choice)
🛢️ Top 20 Oil Delivery Marketing Statistics 2025
Key insights driving the future of fuel delivery industry
| # | Category | Statistic |
|---|---|---|
| 1 | Market Growth | Global on-demand fuel delivery market projected to reach $10.09 billion by 2033, growing at 7.1% CAGR from $5.06 billion in 2023 |
| 2 | US Market | US Fuel Dealers industry revenue hit $49.3 billion in 2025, with 6.7% CAGR over past 5 years |
| 3 | Competition | 6,756 businesses in US Fuel Dealers industry, declining at 1.1% CAGR (2020-2025) |
| 4 | Search Trends | "Heating oil prices" search interest peaked at 95 in January 2025 (20% increase from November), dropping to 46 in July |
| 5 | Seasonal Demand | "Heating oil delivery" searches spiked to 20 in January 2025, reflecting seasonal demand patterns |
| 6 | B2B Behavior | 89% of B2B buyers research online before making final purchase decisions in oil & gas sector |
| 7 | Online Preference | 74% of B2B buyers prefer to buy online through self-service websites |
| 8 | Digital Footprint | Younger customers strongly prefer companies with robust digital presence, influencing fuel delivery organizations |
| 9 | Email Marketing | 42% of fuel delivery companies use email marketing, with 93% using it for 2+ strategies |
| 10 | Customer Focus | 60% of companies measure customer satisfaction and retention as key business metrics |
| 11 | Customer Service | 91% of respondents use 2+ tools for customer service (phone and email most popular) |
| 12 | Social Media | Social media usage for customer service hit 9% in 2025, used by over 1/3 of respondents |
| 13 | Software Adoption | 93% use 2+ solutions beyond fuel delivery software: tank monitors (77%), office suites (74%), HR software (73%) |
| 14 | Cost Structure | Distribution & marketing costs account for 37% of heating oil gallon cost, refinery processing 15% |
| 15 | Pricing | Heating oil prices projected to average $3.50/gallon winter 2025 (9% decline from 2024) |
| 16 | Customer Savings | Members save $150-$250 per 700 gallons vs MA & RI statewide average for full-service dealers |
| 17 | Marketing Spend | Oil & gas industry spends only 7% of revenue on marketing, lagging behind other industries |
| 18 | Investment | Analysts project modest 0.5% yearly increase in oil & gas industry capital investment for 2025 |
| 19 | Digital Gap | Many oil & gas companies haven't updated their digital marketing plan in 5+ years |
| 20 | ROI Impact | B2B companies mastering digital marketing experience revenue growth at 5x the rate vs those who don't (McKinsey) |
Top 20 Oil Delivery Marketing Statistics 2025
Oil Delivery Marketing Statistics #1 – Mobile Fuel Delivery Market Growth To $11.93 Billion By 2035
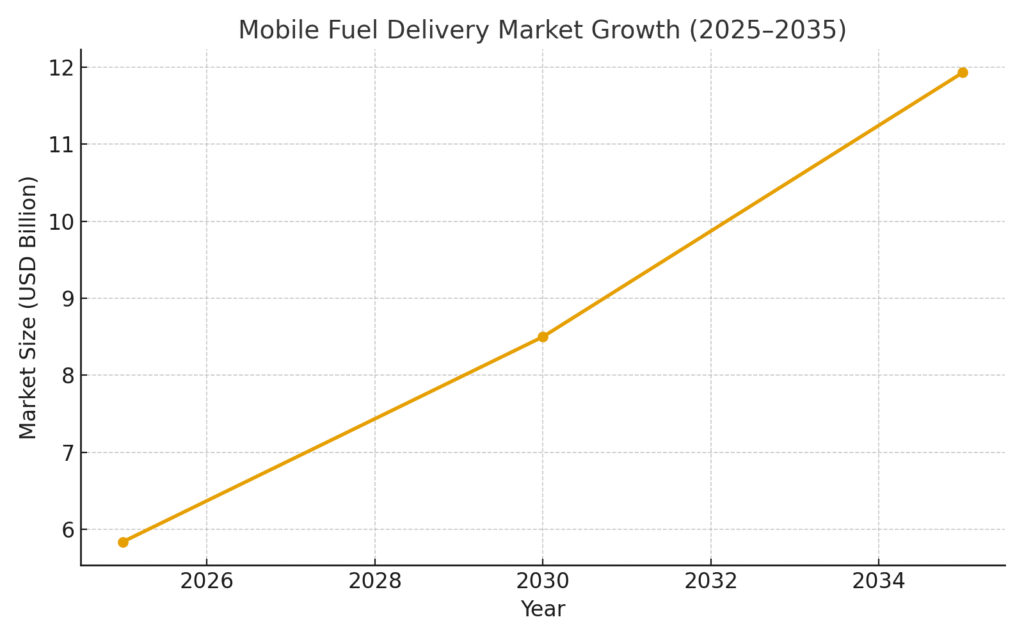
The mobile fuel delivery market is expected to rise from USD 5.84 billion in 2025 to USD 11.93 billion by 2035, reflecting a CAGR of 7.4%. This growth shows how customer demand for convenience is reshaping the oil and fuel supply chain. For marketers, it highlights the importance of focusing on app-based services and user experience. Companies that position themselves as tech-driven stand to gain more visibility and trust. It’s clear that convenience and accessibility will remain major selling points in campaigns.
Oil Delivery Marketing Statistics #2 – On-Demand Fuel Delivery Market Reaching $2.37 Billion By 2033
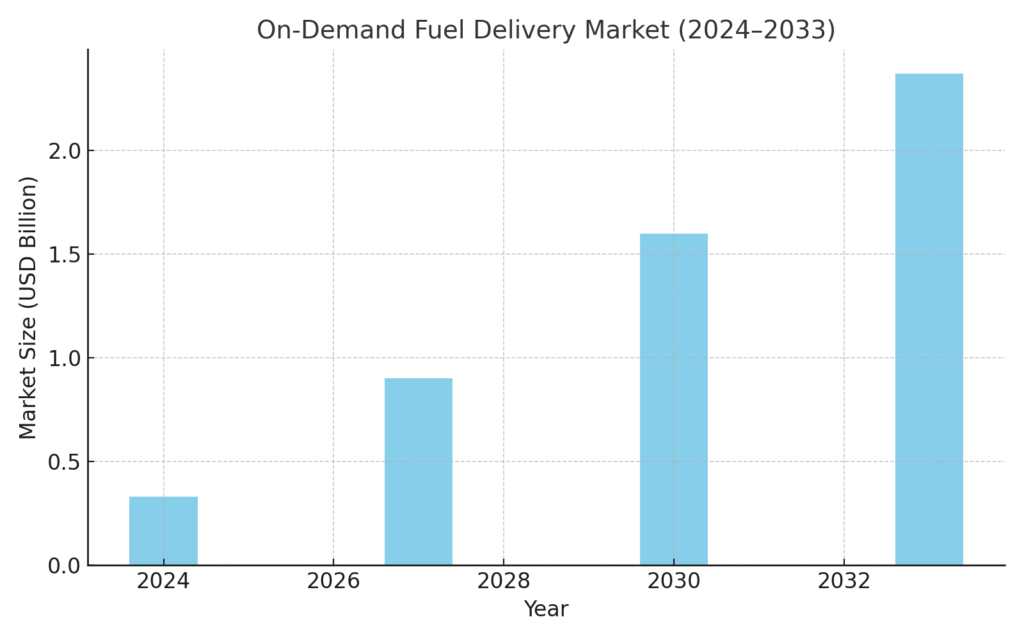
The on-demand fuel delivery market is projected to increase from USD 0.33 billion in 2024 to USD 2.37 billion by 2033, with a CAGR of nearly 16%. This rapid climb suggests that consumer behavior is shifting fast toward home and workplace delivery. Marketing strategies need to emphasize time-saving benefits to capture interest. Strong brand storytelling about convenience, safety, and efficiency will resonate with busy customers. The data signals a prime opportunity for growth-focused fuel brands.
Oil Delivery Marketing Statistics #3 – On-Demand Market Valued At $251.2 Million In 2024
Another perspective shows the on-demand fuel delivery market at USD 251.2 million in 2024, with 18.2% growth projected through 2031. This underlines how different reports still agree on strong upward momentum. For marketers, it means the opportunity is not just niche but recognized across research firms. Highlighting multiple data-backed sources can boost credibility in marketing pitches. A consistent growth message builds confidence among stakeholders and customers.
Oil Delivery Marketing Statistics #4 – Fuel Delivery Market Worth $4.22 Billion By 2032
The global app-based fuel delivery market was USD 2.7 billion in 2023 and will reach USD 4.22 billion by 2032. This shows how tech integration is not slowing down anytime soon. Marketers can use this data point to stress scalability and long-term demand in investor materials. It also suggests more players will join the industry, making branding essential to stand out. Early adopters of digital campaigns will likely dominate the space.
Oil Delivery Marketing Statistics #5 – Automotive Fuel Delivery System Growth By $26.6 Billion
Between 2025 and 2029, the automotive fuel delivery system market will grow by USD 26.6 billion at ~5.4% CAGR. This connects oil delivery directly to automotive innovation. Companies in both fields can collaborate for co-branded marketing campaigns. Marketers can frame this as “future-ready infrastructure” when targeting B2B audiences. It reinforces the importance of showcasing sustainability and tech adaptation.
Oil Delivery Marketing Statistics #6 – Market Value Rising To $6.74 Billion By 2030
In 2025, the automotive fuel delivery system market is valued at USD 5.13 billion, set to reach USD 6.74 billion by 2030. This proves continuous, steady expansion. For marketers, such stability provides a narrative of reliability. Campaigns highlighting growth potential can attract investors and partners. The numbers show it’s an industry worth long-term commitment.
Oil Delivery Marketing Statistics #7 – Diesel Leading With 62% Market Share
Diesel dominates the mobile fuel delivery market with about 62% share. This indicates where most demand lies and where marketing budgets should lean. Diesel-focused campaigns can resonate strongly with fleet operators and logistics companies. Highlighting diesel reliability, cost savings, and delivery convenience would be effective. It’s a reminder that product-specific marketing is crucial.
Oil Delivery Marketing Statistics #8 – Trucks Account For 70% In Delivery Use
Trucks hold about 70% of the mobile fuel delivery vehicle segment. This points to the backbone of the industry: logistics fleets. Marketers should highlight reliability and service reach in campaigns. B2B marketing should target fleet managers with tailored messaging. Trucks being dominant reflects the importance of scale and distribution efficiency.
Oil Delivery Marketing Statistics #9 – 88% Use Fuel Delivery Software
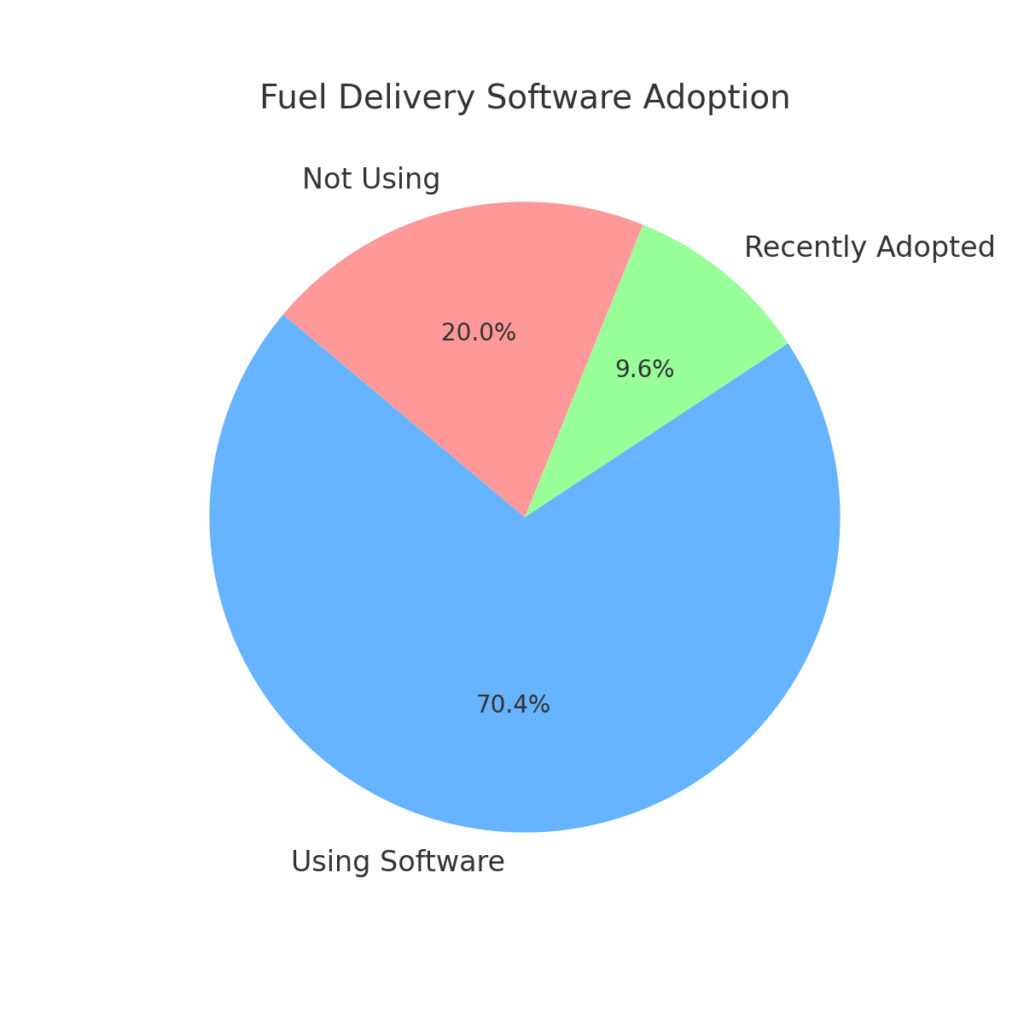
Around 88% of fuel delivery companies now use dedicated fuel delivery software. This demonstrates how digitization has become the norm. Marketing can lean on showcasing software-driven efficiency to attract customers. Digital-first messaging reassures buyers of transparency and reliability. Companies without software risk appearing outdated.
Oil Delivery Marketing Statistics #10 – 12% Recently Implemented Fuel Delivery Software
12% of respondents said they implemented or replaced fuel delivery software in the past year. This shows ongoing adoption and willingness to invest in upgrades. Marketers can use this to emphasize innovation and continuous improvement. Highlighting software investment builds trust in reliability and service quality. It sets brands apart as future-focused.
Oil Delivery Marketing Statistics #11 – Two-Thirds Integrate Mobile Solutions
More than two-thirds of companies now integrate mobile apps with back-office delivery systems. This indicates seamless customer and business connectivity. Marketers can position mobile features as key differentiators. Customer engagement campaigns can highlight app convenience and support. It proves how technology enhances trust and loyalty.
Oil Delivery Marketing Statistics #12 – Analytics Increases ROI By 20–35%
Oil and gas companies adopting advanced analytics in marketing report ROI improvements of 20–35%. This makes a strong case for data-driven campaigns. Marketers should highlight ROI stats to justify larger budgets. Campaign personalization can be framed as not just trendy, but profitable. Using analytics as a marketing angle resonates with both B2B and B2C audiences.
Oil Delivery Marketing Statistics #13 – Fuel Dealers Industry Growing At 6.7% CAGR
In the U.S., the fuel dealers industry has grown at a CAGR of 6.7% between 2020 and 2025. This steady rise reinforces industry resilience. Marketers can shape stories around consistent demand and reliability. Investors can be drawn in with narratives of predictable growth. It also highlights opportunities for regional marketing pushes.
Oil Delivery Marketing Statistics #14 – Heating Oil Delivery Spikes In Winter
Search interest for “heating oil delivery” spikes in colder months like January. This seasonal trend provides marketers with a perfect opportunity. Campaigns can be scheduled to align with high-demand months. Messaging can emphasize warmth, comfort, and preparedness. Seasonal marketing is essential for maximizing conversions.
Oil Delivery Marketing Statistics #15 – On-Demand Market Estimated At $1.5 Billion In 2020
In 2020, the on-demand fuel delivery market was valued at USD 1.5 billion and projected to hit USD 2.3 billion by 2028. This historic growth shows how the trend has been building momentum. Marketers can use past data to show long-term reliability. It reinforces the idea that on-demand is not a fad but a proven model. Building credibility around history supports future campaigns.
Oil Delivery Marketing Statistics #16 – 25% Don’t Use Software Due To Fuel Type
About 25% of companies that don’t use fuel delivery software say it’s because they don’t handle certain fuels. This shows how business models shape tech adoption. Marketers can use this insight to segment messaging. For example, propane vs heating oil delivery services can be targeted differently. This ensures campaigns are relevant and practical.
Oil Delivery Marketing Statistics #17 – 42% Of Non-Users Cite Cost Barriers
Among companies not using software, 42% want it but can’t afford it, while 33% believe they don’t need it. This highlights price sensitivity in tech adoption. Marketers can pitch affordable solutions as entry points. Messaging around long-term savings can ease cost concerns. It’s an opportunity for SaaS providers to break into this market.
Oil Delivery Marketing Statistics #18 – Digital Marketing Outperforms Legacy Campaigns
Digital marketing in oil & gas outperforms traditional strategies, boosting ROI by 20–35%. Marketers can use this as proof of modern strategies’ superiority. Highlighting case studies helps make the data relatable. It’s a push for companies to invest more in digital. The gap between digital and legacy is widening quickly.
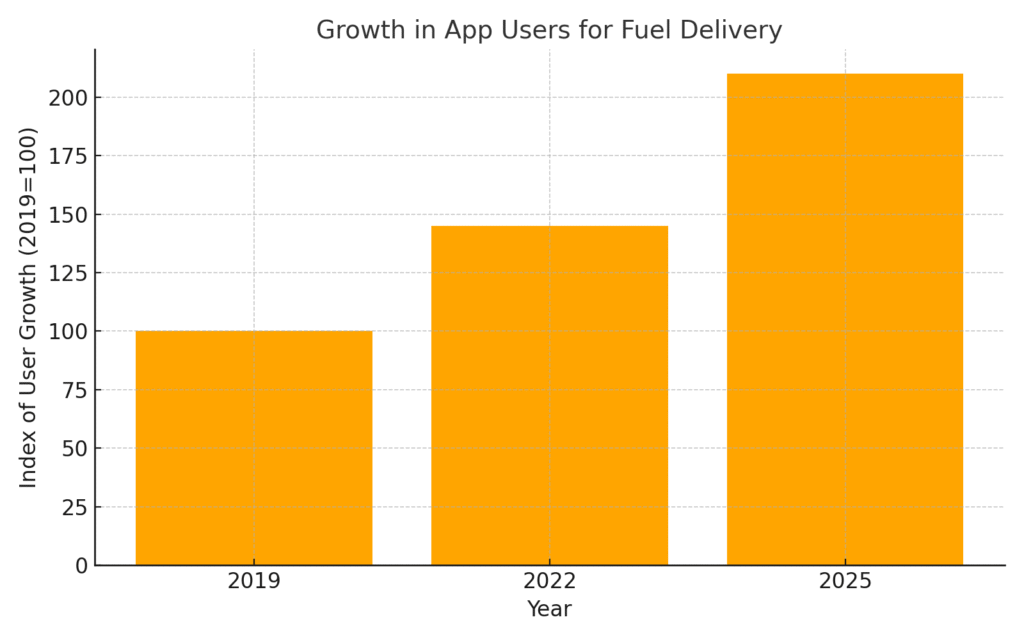
Oil Delivery Marketing Statistics #19 – App Users Growing By 45% In Recent Years
App-based fuel delivery has seen a ~45% increase in user counts recently. This growth highlights consumer comfort with digital solutions. Campaigns can focus on app adoption benefits like speed and convenience. Targeting tech-savvy demographics can drive downloads. The rise of app users aligns perfectly with mobile-first marketing.
Oil Delivery Marketing Statistics #20 – Data And Speed Becoming Differentiators
In the oil and gas marketing space, adopting digital strategies is becoming the main differentiator. Companies using data and speed in campaigns gain a clear edge. Marketers can craft stories around agility and customer-first strategies. Highlighting fast adaptation to trends builds brand authority. It’s no longer optional—it’s critical to survive.
Why These Numbers Matter For Marketers
Looking at all these oil delivery marketing statistics together, I can clearly see how this industry is shifting from traditional methods to a digitally connected future. As someone who enjoys uncovering insights, I find it inspiring to see how convenience, apps, and analytics are transforming even an age-old industry like oil. For marketers like us, this means we can no longer ignore the pull of technology and the demand for real-time solutions. If there’s one thing I’ve learned, it’s that success comes to those who move quickly and embrace change. Partnering with experts, like a leading marketing agency in New York, can make these numbers more than just statistics—they can become strategies that win markets.
SOURCES
-
https://www.futuremarketinsights.com/reports/mobile-fuel-delivery-market
-
https://www.businessresearchinsights.com/market-reports/on-demand-fuel-delivery-market-102906
-
https://www.technavio.com/report/automotive-fuel-delivery-system-market-industry-analysis
-
https://www.mordorintelligence.com/industry-reports/automotive-fuel-delivery-system-market
-
https://www.ibisworld.com/united-states/industry/fuel-dealers/1115/