



17 Sep TOP 20 OPERATING SYSTEM MARKETING STATISTICS 2025
When I first started digging into operating system marketing statistics, I honestly didn’t expect to uncover such a fascinating mix of numbers, trends, and insights. From the rise of Android’s dominance to the shifting balance between Windows 10 and Windows 11, these stats reveal more than just market share—they show us how people live, work, and connect every day. As someone who works closely with businesses and creative teams, I know how valuable it is to translate these figures into meaningful strategies. That’s why I teamed up with a leading marketing agency in New York to explore what these numbers really mean for brands and digital storytellers like us. Together, we can see the bigger picture and make smarter moves in a fast-changing world.
Top 20 Operating System Marketing Statistics 2025 (Editor’s Choice)
📊 Top 20 Operating System Marketing Statistics
Comprehensive Market Data & Insights for 2025
| Rank | Category | Key Statistic & Insights |
|---|---|---|
| 1 | 🌍 Global Market | Android leads globally with 44.51% market share across all devices, followed by Windows (27.39%), iOS (15.94%), macOS (5.29%) |
| 2 | 📱 Mobile Dominance | Android commands 72% of mobile market with 3.6 billion users worldwide, while iOS holds 28% |
| 3 | 💻 Desktop Leadership | Windows controls 71.68% of desktop market globally (macOS 15.7%, Linux 4.20%, ChromeOS 1.86%) |
| 4 | 🇺🇸 US Market | US desktop share: Windows 54.38%, macOS 28.53%, Linux 6.42%, ChromeOS 8.44% |
| 5 | 🪟 Windows Versions | Windows 10 leads with 66.47% of Windows market, while Windows 11 reached 31.63% adoption by August 2024 |
| 6 | 💰 Market Value | OS market valued at $53.5B in 2024, growing to $57.25B in 2025 and $96.3B by 2033 (7% CAGR) |
| 7 | 📈 Mobile Growth | Mobile OS market projected to grow from $54.51B in 2025 to $74.72B by 2030 |
| 8 | 💵 Company Revenue | Microsoft Windows generated $15B from licensing in 2023, Apple earned $8B from macOS hardware |
| 9 | ⭐ Windows Satisfaction | 95% of reviewers rate Windows 11 4-5 stars, running on 1.6 billion active devices globally |
| 10 | 🍎 Mac Demographics | 66% of Mac users are women, with US accounting for 40% of global Mac revenue |
| 11 | 📲 iOS Excellence | 97% of reviewers rate iOS 4-5 stars, 90% believe iOS is headed in the right direction |
| 12 | 🌟 iPhone Users | Over 1 billion people use iOS on iPhones, with 65% US smartphone sales share |
| 13 | 🏢 Enterprise Growth | Enterprise Chromebook adoption growing at 8.2% CAGR, fastest among all segments, market reaching $14.7B in 2025 |
| 14 | 💼 Cost Savings | Enterprise Chromebooks reduce total cost of ownership by 40% vs traditional Windows/macOS deployments |
| 15 | 🔄 Legacy Migration | Windows 7 usage dropped to just 2.48% by May 2025, down from 22% in 2021, showing successful enterprise migration |
| 16 | 🌏 Regional Patterns | Android dominates in APAC, LATAM, and Africa, while iOS maintains stronger presence in developed markets |
| 17 | 🇨🇳 China Innovation | Huawei with HarmonyOS NEXT became best-selling smartphone brand in China Q1 2025 with 19% market share |
| 18 | 📊 Hardware Growth | Desktop shipments projected: 55M units in 2025 (1.0% increase), reaching 57.1M by 2028 |
| 19 | ⚡ Linux Power | Almost all supercomputers run Linux, while 41.2% of global population used Android by 2023 |
| 20 | 🔧 Enterprise Efficiency | Enterprise Chromebooks show 90% fewer hardware service calls vs legacy systems, significantly reducing security vulnerabilities |
Top 20 Operating System Marketing Statistics 2025
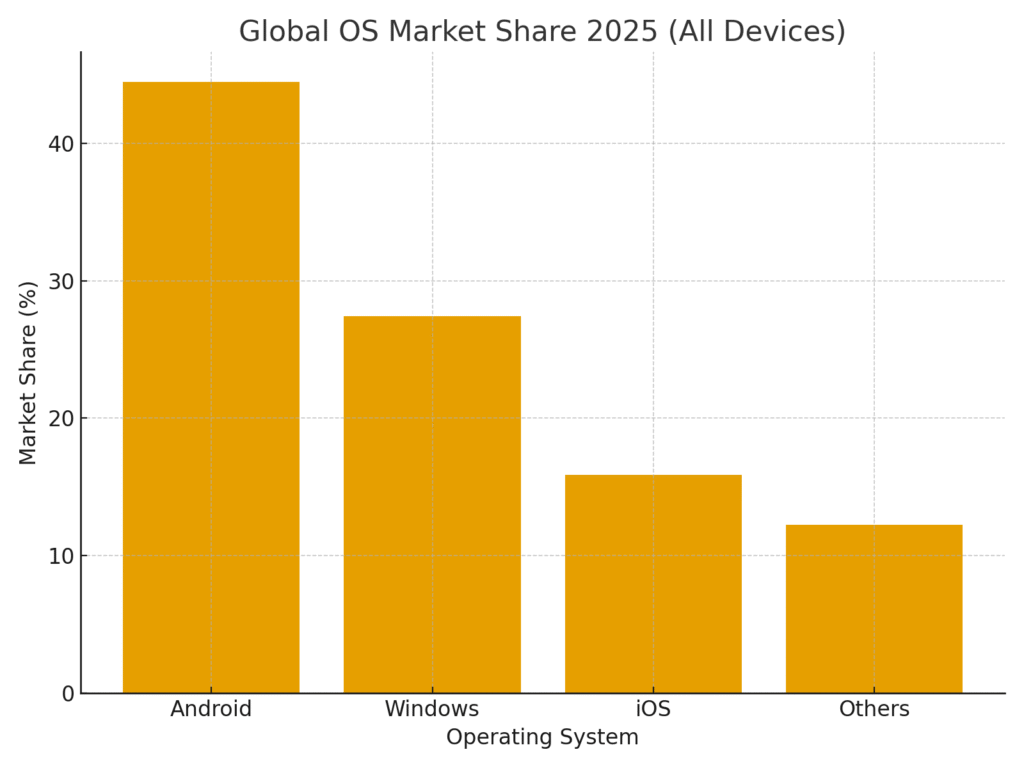
Operating System Marketing Statistics #1: Android’s Global Share at 44.44%
Android continues to lead globally with a market share of 44.44% across all device types, including desktop, mobile, and tablets. This dominance shows the widespread adoption of Android devices in both developed and emerging markets. Marketers targeting Android users must recognize the variety of screen sizes and device capabilities in this ecosystem. The OS’s large global footprint means it’s crucial for brands to optimize digital campaigns for Android compatibility. Its dominance also positions Android as a key platform for app development and mobile-first marketing strategies.
Operating System Marketing Statistics #2: Windows Holds 27.4% Share Globally
Windows maintains a 27.4% share across devices, solidifying its place as a critical operating system for productivity and enterprise environments. This significant share shows how deeply integrated Windows remains in professional and personal computing. For marketers, Windows remains an important platform for software distribution and B2B marketing strategies. Its enduring presence reflects the trust businesses place in Microsoft’s infrastructure. The consistent market presence makes Windows an essential OS to consider in long-term marketing roadmaps.
Operating System Marketing Statistics #3: iOS at 15.9% Globally
iOS accounts for nearly 15.9% of the global OS market, representing Apple’s stronghold in the premium device segment. While smaller in share compared to Android, iOS users often show higher engagement and purchasing power. This makes iOS a valuable platform for marketers targeting high-value customers. Apple’s ecosystem integration also strengthens brand loyalty, further boosting marketing opportunities. For advertisers, iOS provides a direct channel to an affluent and brand-conscious audience.
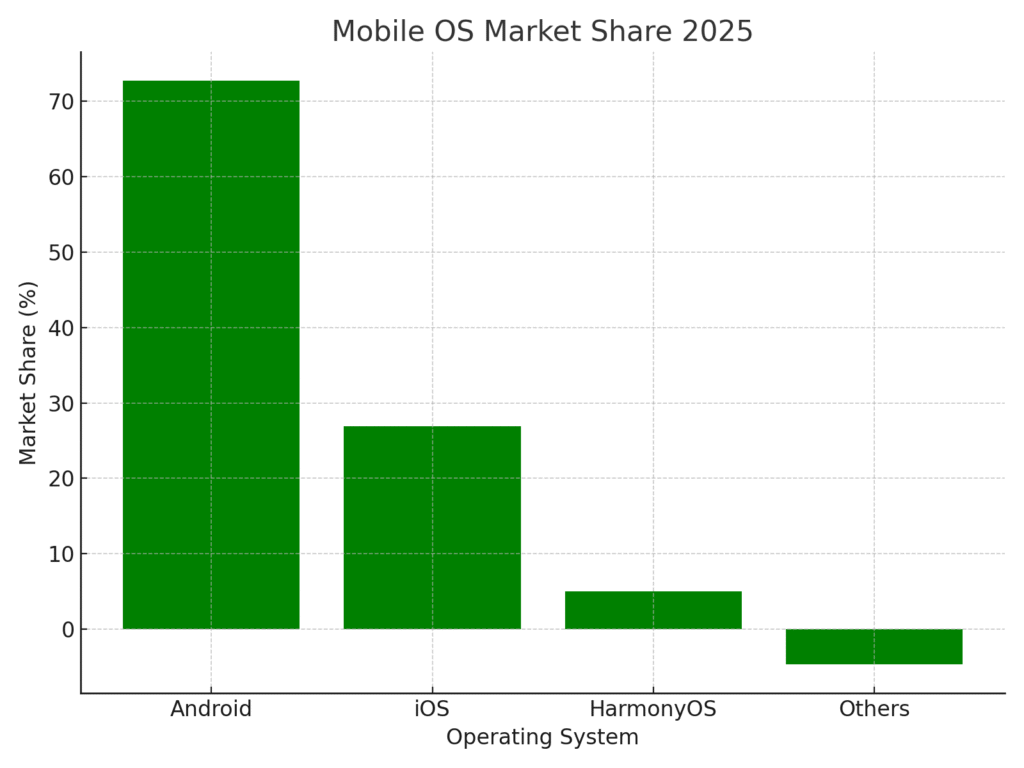
Operating System Marketing Statistics #4: Android Leads Mobile OS at 72.72%
When focusing specifically on mobile, Android dominates with 72.72% of the global share. This overwhelming presence highlights its reach in countries where affordable smartphones fuel internet access. Marketers need to prioritize Android app compatibility and mobile-first campaigns to connect effectively with this user base. The accessibility of Android also creates opportunities for localized and budget-friendly marketing strategies. Its large share underlines why Android must be at the forefront of mobile marketing initiatives.
Operating System Marketing Statistics #5: iOS Mobile Share at 26.92%
iOS follows Android with 26.92% of the mobile operating system market. Despite being second in volume, iOS users typically have higher purchasing power, making them attractive targets for premium products. Brands often find higher conversion rates among iOS audiences due to this demographic’s willingness to spend. The strength of iOS also lies in its integration with other Apple services like iCloud and Apple Pay. For marketers, these connections create seamless opportunities to drive user engagement.
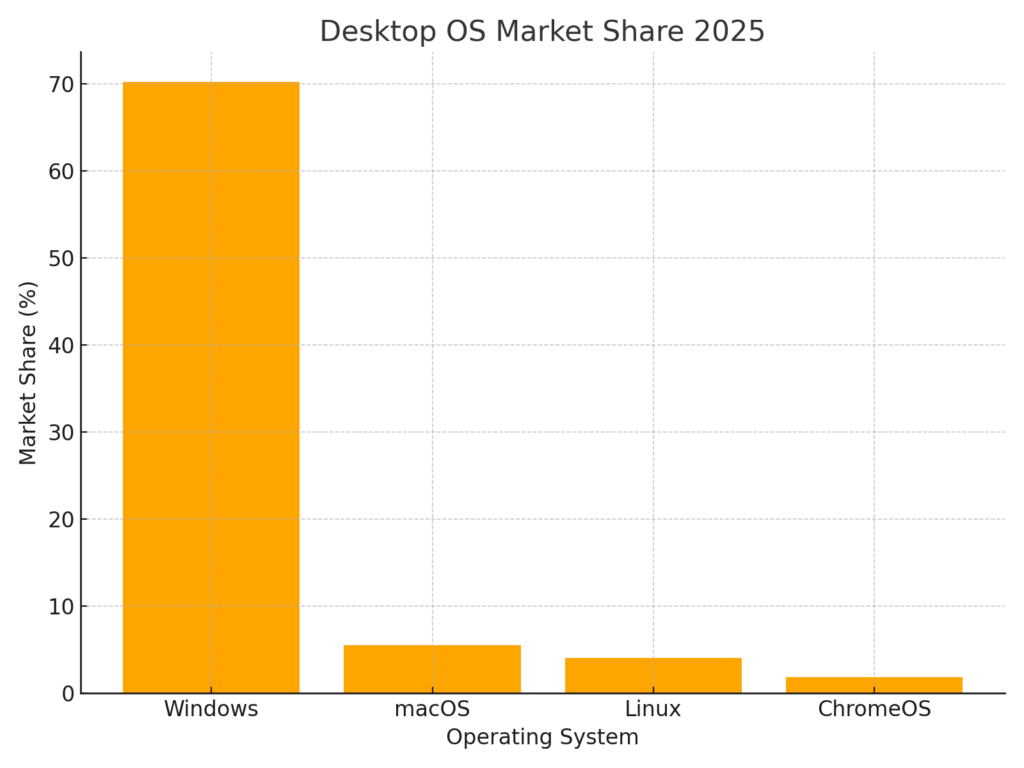
Operating System Marketing Statistics #6: Windows Holds 70.21% of Desktop Market
On desktops, Windows controls 70.21% of the market, making it the dominant platform for traditional computing. This high share underscores its importance for enterprise software, productivity tools, and B2B marketing campaigns. Many organizations remain tied to Windows environments, providing a stable base for targeting professional users. Windows’ dominance ensures compatibility remains essential for developers and marketers alike. Its leadership reflects Microsoft’s continued relevance in shaping desktop computing habits.
Operating System Marketing Statistics #7: macOS Holds 5.5% of Desktop Market
macOS has a 5.5% share in the desktop operating system market, highlighting its niche yet influential role. Apple’s computers often appeal to creative professionals, designers, and brand-loyal users. This creates unique opportunities for marketing premium apps and services. macOS users are also seen as trendsetters, often influencing wider adoption of new technologies. While smaller in numbers, their brand affinity makes them a valuable audience for specialized campaigns.
Operating System Marketing Statistics #8: Linux Holds 4.06% of Desktop Market
Linux accounts for 4.06% of desktop market share worldwide. Though modest, this percentage reflects a strong and loyal community of developers, IT professionals, and privacy-focused users. Linux’s open-source nature makes it especially appealing to businesses seeking customization and flexibility. Marketers targeting this audience must emphasize value in technical performance and security. The presence of Linux, though smaller, demonstrates the importance of alternative platforms in niche marketing.
Operating System Marketing Statistics #9: ChromeOS Holds 1.83% of Desktop Market
ChromeOS has secured a 1.83% share, carving out a position in education and budget-conscious segments. The OS is particularly popular in schools, where affordability and cloud-based learning are key drivers. For marketers, ChromeOS users represent an opportunity in the education technology and productivity space. The lightweight system shows the growing appeal of simple, cloud-driven computing solutions. ChromeOS’s steady growth highlights the demand for practical and cost-effective platforms.
Operating System Marketing Statistics #10: Mobile Devices Account for 59.6% of Web Traffic
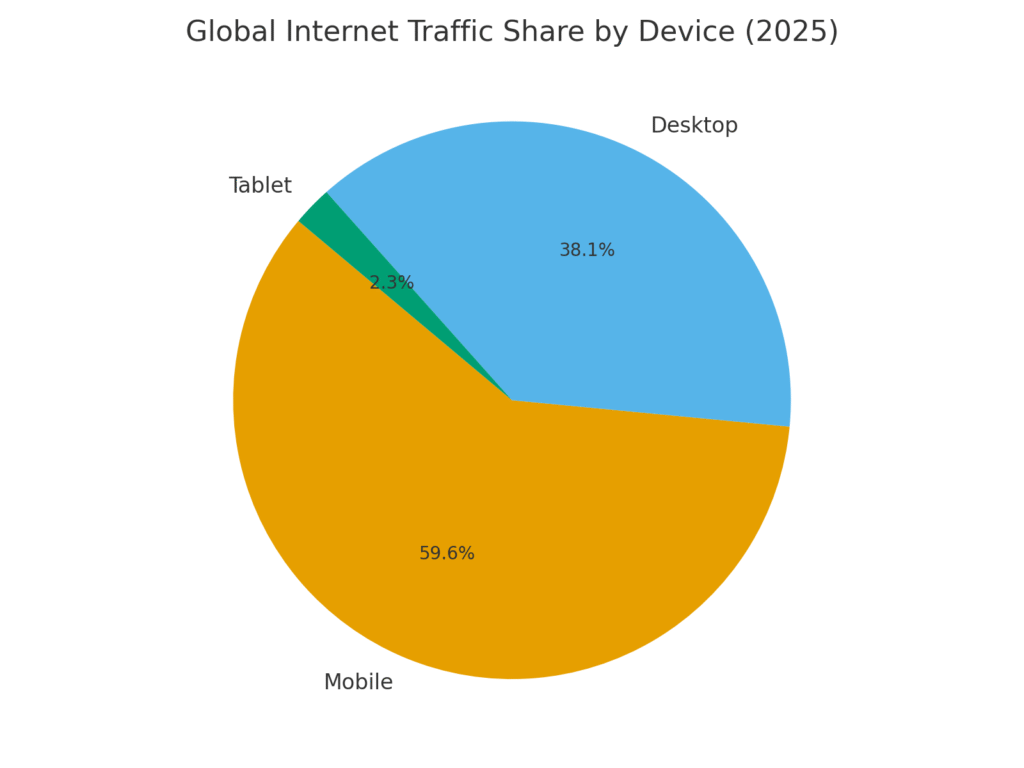
Globally, mobile devices drive 59.6% of internet traffic, leaving desktops with 38.1% and tablets with 2.3%. This milestone cements mobile as the dominant medium for online access. Marketers need to ensure mobile optimization for websites, apps, and campaigns to avoid losing engagement. Mobile-first strategies, such as responsive design and mobile advertising, are no longer optional. The shift reflects how smartphones have become the primary window to the digital world.
Operating System Marketing Statistics #11: Desktop Traffic at 38.1% of Internet Use
Desktops still account for 38.1% of web traffic globally, maintaining relevance in workplaces and for complex tasks. This share proves that while mobile dominates, desktops are irreplaceable in certain scenarios. Marketers can leverage this by tailoring campaigns differently for desktop audiences. Larger screen sizes offer opportunities for richer, more detailed content. Desktop usage continues to be vital for industries relying on productivity and detailed workflows.
Operating System Marketing Statistics #12: Mobile Internet Traffic in India at 80.31%
In India, mobile devices generate 80.31% of internet traffic, far above the global average. This reflects the country’s reliance on affordable smartphones as primary internet tools. For marketers, India’s mobile-first reality calls for strategies designed for low-bandwidth and cost-conscious users. Localization, lightweight apps, and mobile-friendly campaigns are essential here. The trend underscores how operating system preferences shift significantly in developing regions.
Operating System Marketing Statistics #13: Windows 11 Becomes Most Widely Used Windows Version
Windows 11 has overtaken Windows 10 to become the most widely used Windows version. This transition signals growing user adoption despite initial hesitancy about the upgrade. Microsoft’s push for Windows 11 adoption has clearly paid off in recent years. For marketers, this means focusing on compatibility with the latest version is critical. The milestone also highlights how upgrade cycles influence both user behavior and marketing opportunities.
Operating System Marketing Statistics #14: Windows 10 Holds 43% of Version Share
Despite Windows 11’s rise, Windows 10 still accounts for 43% of the Windows OS market. This significant base reflects the slower transition rate of enterprises and cautious users. Businesses often delay upgrades due to cost, compatibility, and training requirements. For marketers, supporting Windows 10 remains necessary in the near future. The strong user base illustrates how legacy systems can remain relevant long after successors launch.
Operating System Marketing Statistics #15: Windows 11 Holds 53% of Version Share
Windows 11 now accounts for 53% of all Windows installations globally. This marks a turning point where the latest OS has firmly taken over its predecessor. Adoption is driven by new device sales and Microsoft’s upgrade incentives. Marketers and developers alike must prioritize Windows 11 compatibility to avoid alienating this majority. The stat also reflects users’ willingness to embrace modern features when supported by strong brand trust.
Operating System Marketing Statistics #16: iPadOS Holds 52% of Tablet Market
Apple’s iPadOS leads the global tablet market with 52% share. This dominance underscores Apple’s strong reputation in the tablet segment. Marketers targeting iPadOS users can leverage their premium brand loyalty. iPad users often engage heavily with creative, educational, and productivity apps. The stat highlights the strength of specialized operating systems in shaping consumer habits.
Operating System Marketing Statistics #17: Android Tablet Share at 48%
Android holds 48% of the tablet OS market, nearly rivaling iPadOS. Its appeal lies in affordability, diversity of devices, and accessibility. For marketers, Android tablets offer opportunities in education and budget-friendly sectors. The near parity with iPadOS demonstrates Android’s growing strength beyond smartphones. This balance in the tablet market creates diverse opportunities for app and content creators.
Operating System Marketing Statistics #18: HarmonyOS Gains 5% Global Mobile Share
Huawei’s HarmonyOS has reached a 5% global share in the mobile market. Its expansion demonstrates that new players can carve out a niche in a competitive landscape. Marketers should not overlook HarmonyOS, especially in regions where Huawei maintains brand loyalty. The growth also underscores user demand for alternatives to Android and iOS. HarmonyOS’s rise presents a fresh opportunity for brands seeking emerging markets.
Operating System Marketing Statistics #19: HarmonyOS at 19% in China
In China, HarmonyOS has achieved a 19% share, surpassing iOS in some quarters. This is a remarkable accomplishment for a relatively new operating system. For marketers targeting China, HarmonyOS represents an essential platform for outreach. The OS’s rapid adoption highlights national support for local technology ecosystems. It illustrates how regional preferences can dramatically shift the global operating system landscape.
Operating System Marketing Statistics #20: Mobile Bounce Rates Higher Than Desktop
Mobile bounce rates remain higher compared to desktop, despite mobile’s dominance in traffic. This suggests users still prefer desktops for in-depth browsing and complex tasks. For marketers, this highlights the need to improve mobile experiences to retain engagement. Mobile content must be optimized for quick loading and easy navigation. The stat emphasizes that high reach on mobile does not always equate to high retention.
Wrapping It All Up
Looking back at these statistics, I can’t help but feel like they’re less about cold data and more about real stories—stories of people choosing devices, shifting habits, and adapting to new technologies. For me, the biggest takeaway is how quickly the landscape moves, and how important it is for marketers, creators, and entrepreneurs to stay one step ahead. Whether it’s the surge of mobile dominance, the loyalty to certain desktop systems, or the surprising rise of alternatives like HarmonyOS, each trend carries a lesson about adaptability and foresight. Personally, I see these insights as a reminder to never stop learning and to always keep a curious eye on the digital future. Because at the end of the day, that’s where the next big opportunity will come from.
SOURCES
https://gs.statcounter.com/os-market-share
https://en.wikipedia.org/wiki/Usage_share_of_operating_systems
https://www.thebusinessresearchcompany.com/report/operating-systems-global-market-report
https://www.cognitivemarketresearch.com/operating-systems-market-report
https://sqmagazine.co.uk/linux-statistics/
https://gs.statcounter.com/os-market-share/desktop-tablet/worldwide/
https://borncity.com/win/2025/02/03/operating-system-windows-share-end-of-january-2025/
https://learn.g2.com/operating-system-statistics
https://www.wired.com/story/android-overtakes-windows
https://www.theverge.com/2024/9/2/24234091/microsoft-windows-11-popular-steam-pc-gaming-survey