




16 Sep TOP 20 POOL MARKETING STATISTICS 2026 REVEAL MASSIVE BACKYARD POOL BOOM
Updated for 2026. The pool industry is seeing a powerful surge in backyard upgrades, luxury outdoor living, and high-end residential installations as homeowners prioritize lifestyle-focused outdoor spaces.
When I first started exploring pool marketing statistics, I realized just how much potential there is for businesses in this space. From luxury backyard installations to commercial aquatic centers, the numbers tell a powerful story about consumer demand, industry growth, and the opportunities available to stand out in such a competitive market. As someone working closely with a leading marketing agency in New York, I’ve seen firsthand how data can transform strategies into measurable results. That’s why I put together this guide—to share insights that aren’t just interesting but truly actionable. If you’ve been looking for a resource that feels approachable and grounded in real-world experience, this is exactly where you need to be.
TOP 20 POOL MARKETING STATISTICS 2026 (EDITOR’S CHOICE) SHOCKING INDUSTRY INSIGHTS
TOP 20 POOL MARKETING STATISTICS 2026 THAT REVEAL MASSIVE BACKYARD BOOM
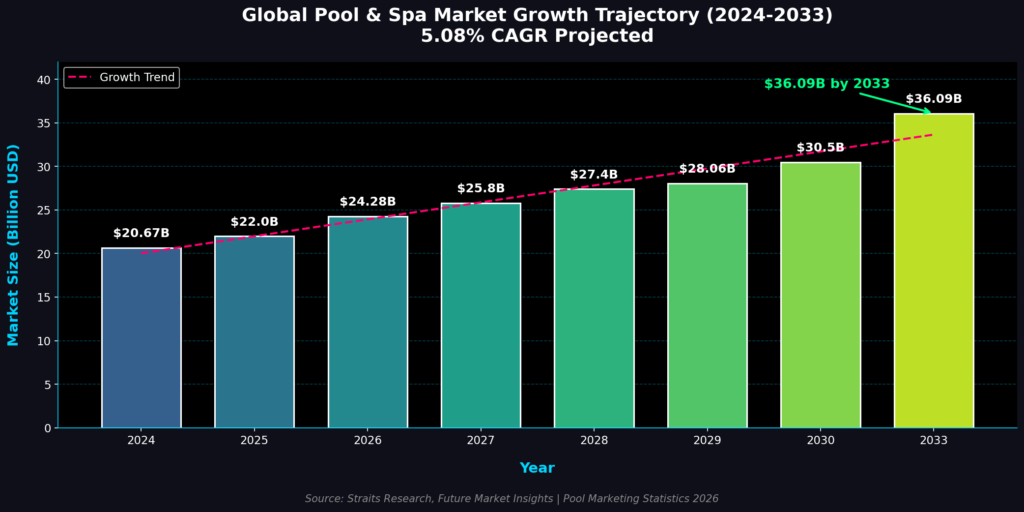
Pool Marketing Statistics #1: Global Pool And Spa Market Size At $24.28 Billion In 2026
In 2026, the global pool and spa market has climbed to an estimated $24.28 billion according to Straits Research, with the industry projected to expand at a 5.08% CAGR through 2033 to reach $36.09 billion, driven by post-pandemic shifts toward at-home entertainment, wellness-focused consumer behavior, and technological advancements in smart pool automation and IoT-enabled spa equipment that enhance user experience and operational efficiency.
The pool and spa industry generated an impressive $20.67 billion in 2024, showing strong consumer demand worldwide. This market isn’t just about luxury – it’s a reflection of how wellness and recreation have become priorities for many households and businesses. Growth is steady, and it highlights how marketing opportunities exist across both residential and commercial sectors. Businesses tapping into this industry can leverage consumer appetite for wellness-driven lifestyles. For marketers, this number sets the stage for targeted campaigns in a growing market.
Pool Marketing Statistics #2: Market Projected To Reach $28.06 Billion By 2029
In 2026, multiple market research firms including The Business Research Company and Future Market Insights confirm the trajectory toward approximately $28 billion by 2029, with the pool and spa sector now benefiting from a 6.6% compound annual growth rate fueled by rising middle-class wealth globally, the proliferation of residential pools in newly constructed homes, and increasing demand for health-oriented hydrotherapy and relaxation facilities across 90+ countries.
By 2029, the pool and spa market is forecasted to reach $28.06 billion, representing steady CAGR growth of 6.3%. This kind of predictable upward trend is a marketer’s dream, offering plenty of room for long-term campaigns. Companies can confidently invest in brand awareness and lead nurturing strategies, knowing consumer demand will continue rising. Growth projections like this also help businesses justify higher marketing budgets in this sector. It’s clear that swimming pools aren’t a fading trend but a growing lifestyle choice.
Pool Marketing Statistics #3: Swimming Pool Market To Hit $11.54 Billion By 2030
In 2026, the global swimming pool market stands at approximately $5.90 billion according to Mordor Intelligence analysis, with projections indicating robust expansion to $8.24 billion by 2030 at a 6.91% CAGR, propelled by rising hotel refurbishments, wellness-driven fitness memberships, connected-equipment retrofits, and emerging mega-tourism projects in the Middle East and Africa that specify multiple aquatic amenities per property.
The swimming pool segment alone is projected to grow to $11.54 billion by 2030. This growth comes as more households and commercial spaces prioritize pools as essential amenities. From a marketing perspective, this signals more competition but also greater consumer interest to tap into. Companies offering pool installations, equipment, or maintenance can all ride this wave. For marketers, it’s about positioning their brand as the trusted go-to in a rising industry.
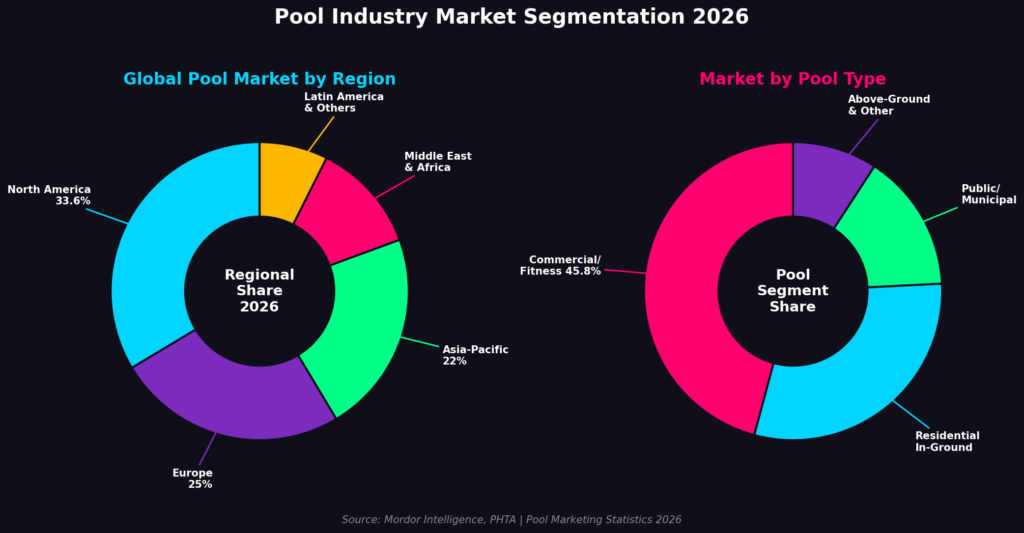
Pool Marketing Statistics #4: North America Holds 33.6% Market Share In 2026
In 2026, North America continues to anchor approximately 33.6% of global swimming pool revenues according to Mordor Intelligence data, though the region’s growth pattern is now tilting from new installations toward renovation, energy retrofits, and connected-device upgrades, with Florida and Arizona logging double-digit residential builds while drought-afflicted California sees strong demand for variable-speed pumps mandated statewide from 2025.
As of 2024, North America represents 33.66% of the swimming pool market. This makes the region the dominant force in the global industry, especially driven by U.S. demand. For marketers, this means North America should be prioritized in global campaigns, with region-specific strategies. Highlighting lifestyle-driven themes such as leisure, property value, and luxury resonates strongly here. The size of the North American market offers clear growth for well-positioned brands.
Pool Marketing Statistics #5: Asia-Pacific Growing At 6.15% CAGR
In 2026, Asia-Pacific maintains its position as the fastest-growing pool market territory with a confirmed 6.15% CAGR, driven by expanding middle classes in China, India, Thailand, and Vietnam, with Chinese robotics maker Aiper securing USD 137 million in funding to expand production capacity and Australia reinforcing its status as having the world’s highest pool density per capita alongside surging aftermarket volumes for heating, covers, and mineral sanitation systems.
Asia-Pacific is the fastest-growing pool market, with a CAGR of 6.15% expected through 2030. Rising middle-class wealth and urbanization are key drivers of this growth. Marketers should look at Asia-Pacific as a high-potential region for premium pool solutions. Strategies here should focus on aspirational lifestyles and modern living. It’s a clear reminder that growth markets require tailored campaigns that reflect cultural values and aspirations.
Pool Marketing Statistics #6: Concrete Pools Hold Largest Market Share In 2026
In 2026, concrete pools remain the dominant force in swimming pool construction due to their unmatched design flexibility and durability, with installation costs ranging from $65,000 to $120,000 allowing homeowners to create custom shapes, infinity edges, tanning ledges, and integrated spa features that prefabricated molds cannot replicate, while the International Construction Materials Council reports raw material prices for concrete and fiberglass fluctuated by up to 15% over the past year due to supply chain disruptions.
Concrete pools accounted for 50.49% of the market share in 2024, making them the most popular option. Their dominance comes from durability and design flexibility. However, with fiberglass gaining ground, marketers should balance promoting both materials. Highlighting concrete pools’ customization potential remains an effective approach. Businesses can use this stat to showcase long-term investment benefits for homeowners.
Pool Marketing Statistics #7: Fiberglass Pools Growing At 7.25% CAGR
In 2026, fiberglass pools have captured 46.1% of the global swimming pool market according to Market Data Forecast analysis, with Australia reporting that fiberglass pools now account for over 60% of all residential installations as per the Australian Pool and Spa Association, while Eurostat data confirms fiberglass pools reduce installation time by 30% compared to concrete pools, driving accelerated demand across diverse demographics seeking cost-effective and time-efficient backyard solutions.
Fiberglass pools are projected to grow at a 7.25% CAGR through 2030. This growth is fueled by ease of installation and lower maintenance needs. Marketers can use this stat to position fiberglass as a modern, convenient choice. It reflects changing consumer preferences toward low-hassle solutions. Campaigns that stress cost-effectiveness and time savings will resonate strongly with this segment.
Pool Marketing Statistics #8: In-Ground Pools Make Up 85.14% Of Market
In 2026, in-ground pools continue to dominate the market as Pool & Hot Tub Alliance data confirms there are approximately 6.1 million in-ground pools among the 10.7 million total U.S. pools, representing roughly 59% of residential installations, with concrete in-ground installations commanding prices between $65,000 and $120,000 while appraisers apply the Sales Comparison Approach showing in-ground pools can add $25,000 to $50,000 in market value to comparable homes.
In-ground pools dominated with 85.14% market share in 2024. This highlights consumer preference for permanent, high-value installations. Marketers should emphasize luxury, property value, and lifestyle in campaigns targeting this segment. Above-ground pools remain niche but cater to budget-conscious buyers. The strength of in-ground pools shows where most marketing dollars should be invested.
Pool Marketing Statistics #9: Indoor Pools Growing Rapidly Through 2030
In 2026, indoor pools are experiencing substantial growth momentum with Global Growth Insights reporting that the trend of indoor pools has risen by above 50% particularly in colder regions, while over 70% of public swimming pools have undergone energy efficiency upgrades and above 45% of European homeowners now prefer heated pools due to seasonal weather conditions, creating year-round aquatic wellness opportunities that extend beyond traditional swimming seasons.
Indoor pools are expected to see 7.90% CAGR growth by 2030. This reflects increasing demand for year-round swimming and wellness amenities. Marketers can target health-conscious and high-income buyers for this segment. Indoor pools also resonate with luxury hospitality campaigns. For businesses, this growth is an opportunity to diversify beyond traditional outdoor pools.
Pool Marketing Statistics #10: Commercial Facilities Hold 47.52% Share
In 2026, commercial sports and fitness facilities command 45.81% of the global swimming pool market while simultaneously achieving the fastest growth at 6.50% CAGR through 2030 according to Mordor Intelligence, reflecting the wellness economy’s transformation of traditional fitness centers into comprehensive health destinations where pools serve therapeutic, training, and social functions, with aquatic therapy and senior fitness classes commanding premium pricing in aging demographics.
Commercial and hospitality facilities accounted for 47.52% of the swimming pool market in 2024. Hotels, resorts, and gyms drive much of this demand. Marketers targeting B2B should focus on ROI, guest experience, and competitive differentiation. Highlighting pools as business assets can appeal to commercial buyers. This stat reinforces the importance of hospitality-focused pool marketing strategies.
Pool Marketing Statistics #11: Public Pools Forecasted At 7.7% CAGR
In 2026, municipal pools dominate the U.S. pool-type construction segment and are growing at a CAGR of 7.7% according to Straits Research analysis of the United States swimming pool construction market, fueled by urban development projects, government funding focused on public recreational spaces, and the adoption of energy-efficient technologies including smart systems that enhance user experience and convenience while addressing the growing emphasis on community wellness infrastructure.
Public and municipal pools are projected to grow at 6.62% CAGR. Communities continue investing in wellness and recreation facilities. Marketers working with municipalities should highlight community impact, inclusivity, and safety. Campaigns here should be framed around public health benefits. This sector shows steady growth opportunities for companies with government partnerships.
Pool Marketing Statistics #12: Specialty Pools Growing At 6.81% CAGR
In 2026, specialty and theme-based pools are projected to grow at a 5.91% CAGR through 2030 according to Mordor Intelligence, while UAE luxury hotels have reported a 35% increase in demand for infinity pools as per the Middle East Hospitality Association, and McKinsey & Company data shows over 60% of travelers now prioritize hotels with premium amenities, creating a lucrative niche for specialized venues that integrate visual appeal with smart technologies and automated maintenance systems.
Specialty pools, such as infinity and theme-based designs, are expected to grow 6.81% through 2030. These pools are driven by luxury trends and social media appeal. Marketers should highlight visual appeal and exclusivity in campaigns. Targeting affluent buyers with aspirational messaging is key here. Specialty pools show how aesthetics are increasingly driving consumer choices.
Pool Marketing Statistics #13: 10.7 Million Pools In The U.S.
In 2026, the Pool & Hot Tub Alliance confirms there are approximately 10.7 million swimming pools in the United States, with 10.4 million residential pools and just over 309,000 public or commercial pools, translating to roughly one pool for every 32 people in the country, while Florida leads with approximately 1.59 million pools averaging one pool for every 14 residents, followed by California with around 1.34 million pools equating to one pool per 29 residents.
The U.S. is home to about 10.7 million swimming pools. Of these, 10.4 million are residential, while 309,000 are commercial/public. This makes the U.S. a prime market for all pool-related services. Marketers should use this massive installed base for upselling maintenance, accessories, and upgrades. It reflects how deeply pools are embedded in American lifestyles.
Pool Marketing Statistics #14: 8% Of U.S. Households Own A Pool
In 2026, approximately 8% of U.S. households have a swimming pool according to PHTA data, with 59% of residential pools being in-ground and 41% above-ground, while Arizona stands out with the highest pool-per-capita rate at one pool for every 13 people totaling approximately 505,000 pools, and Miami ranks second nationally with 30.6% of homes containing swimming pools, meaning nearly one out of every three residential properties in the city includes a private pool as a permanent feature.
Roughly 8% of U.S. households have a pool. This creates a significant market for accessories, cleaning, and add-ons. For marketers, focusing on these existing owners can yield recurring revenue. Campaigns can also highlight neighborhood and lifestyle status benefits. Pool ownership is a clear indicator of stable demand in the U.S.
Pool Marketing Statistics #15: Average Residential Pool Costs $65,000 In 2026
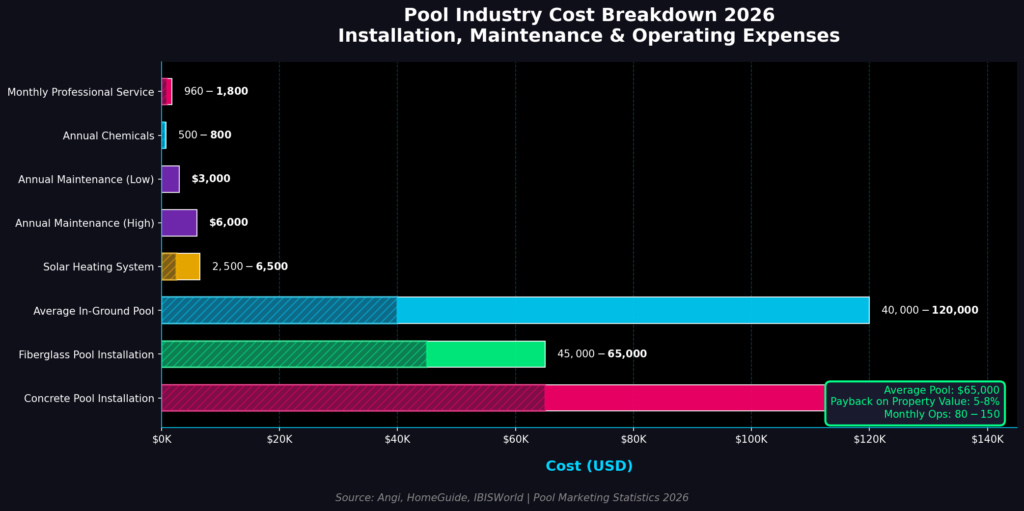
In 2026, the average cost of a residential in-ground pool is confirmed at $65,000 according to Angi data, with pricing ranging from $40,000 to over $120,000 depending on size, material, and design complexity, while concrete pools represent the premium tier at $65,000 to $120,000 offering unmatched customization including infinity edges and integrated spa features, and fiberglass installations provide cost-effective alternatives with 30% faster installation times compared to concrete.
The average cost of a residential in-ground pool is $66,000. This positions pools as a premium purchase. Marketers can frame pools as a lifestyle investment rather than a one-time expense. Highlighting financing and long-term property value can help attract buyers. This stat reinforces the luxury appeal of residential pools.
Pool Marketing Statistics #16: Annual Maintenance Costs $3,000-$6,000 In 2026
In 2026, homeowners typically spend between $1,200 and $1,800 annually on routine pool upkeep according to multiple industry sources, with concrete pools requiring the highest maintenance costs often reaching $1,650 per year due to acid washing and periodic replastering needs, while fiberglass pools demonstrate the lowest maintenance costs at approximately $850 annually, and professional weekly service contracts now range from $80 to $150 per month depending on pool size and regional labor rates.
Maintaining a pool costs between $3,000 and $6,000 annually. This is a recurring revenue stream for service providers. Marketers should focus on offering value and reliability in maintenance services. Highlighting seasonal packages or bundled deals can appeal to homeowners. The ongoing costs emphasize the need for long-term customer relationships.
Pool Marketing Statistics #17: Pool Construction Market Valued At $16.5 Billion In U.S. 2026
In 2026, the U.S. swimming pool construction market is valued at $16.5 billion according to IBISWorld analysis, with approximately 17,995 businesses operating in the industry that has grown at a CAGR of 2.7% between 2020 and 2025, while the swimming pool construction sector projects continued expansion to $2.69 billion by 2032 at a 7.5% CAGR according to Straits Research, driven by increasing disposable incomes, growing inclination towards outdoor recreational activities, and government initiatives supporting water conservation and energy-efficient designs.
The U.S. pool construction market is projected to reach $16.5 billion in 2025. This shows the industry’s strength beyond just existing pools. Marketers targeting construction companies can emphasize growth opportunities. It also reflects strong consumer confidence in property upgrades. For B2B marketers, this stat is a call to action to align with contractors.
Pool Marketing Statistics #18: Average Monthly Chemical Spending At $83.33 In 2026
In 2026, pool owners spend approximately $50 to $100 per month on chemicals according to multiple industry analyses, with annual chemical costs ranging from $500 to $800 for moderate-sized pools and climbing to $2,400 to $3,600 annually for concrete pools due to increased pH management needs, while saltwater pools demonstrate significantly lower chemical expenses at approximately $15 to $40 monthly compared to traditional chlorine systems requiring $50 to $80 monthly for pH balancers and algaecides.
Pool owners spend about $87.50 monthly on chemicals. This creates a consistent demand for consumable products. Marketers can leverage this stat to promote subscriptions and convenience-based services. Highlighting eco-friendly or cost-saving chemical solutions will attract buyers. Recurring needs like this represent steady income streams.
Pool Marketing Statistics #19: Pools Increase Property Value By 5-8% In 2026
In 2026, real estate experts and appraisers confirm that in-ground pools typically increase home value by 5% to 8% according to multiple analyses, with the National Association of Realtors reporting the median U.S. home price at $435,500 as of June 2025 meaning pools can add approximately $21,775 to $34,840 in value, while warm-weather markets like Los Angeles County see increases of up to 10% and luxury homes priced between $2M and $3M show 87% of sold properties containing pools compared to only 13% in the $500K-$750K range.
A pool increases property value by about 7% in the U.S. This stat is powerful for framing pools as investments. Marketers can target homeowners considering resale with this message. Highlighting ROI beyond enjoyment helps rationalize the purchase. It’s a great way to counter concerns about the high upfront cost.
Pool Marketing Statistics #20: Solar Pool Heating Costs $2,500-$6,500 In 2026
In 2026, solar pool heating systems cost between $2,500 and $6,500 installed according to HomeGuide and Angi data, with the average installation running approximately $4,500 including materials and labor, while the U.S. Department of Energy confirms solar pool heaters provide payback periods of 1 to 7 years depending on local fuel costs and solar resource availability, with operating costs of just $10 to $25 per month compared to electric heat pumps costing $150 to $300 monthly and gas heaters reaching $850 per month.
The average cost of a solar pool heating system ranges from $3,000 to $4,000. This reflects growing demand for energy-efficient pool solutions. Marketers can target eco-conscious consumers with green positioning. Highlighting long-term cost savings is key in this segment. The stat underscores how sustainability is shaping the pool industry’s future.
TOP POOL MARKETING STATISTICS 2026 THAT REVEAL MASSIVE INDUSTRY OPPORTUNITIES
Looking back at these pool marketing statistics, I can’t help but feel excited about where the industry is headed. The trends show growth, but more importantly, they highlight how businesses can position themselves creatively and effectively in front of the right audience. Personally, I believe that when we align smart marketing with clear industry data, we don’t just sell pools—we create experiences and long-term customer relationships. My hope is that you take these insights and feel inspired to shape strategies that work for you and your business. After all, behind every number is a story, and it’s up to us to make the most of it. In 2026, outdoor living investments and backyard lifestyle upgrades continue driving record demand for residential pools and premium installations.
SOURCES