



29 Sep TOP 20 RECOVERY MARKETING STATISTICS 2025
When I think about recovery marketing statistics, I can’t help but reflect on how much insight they give us into the customer journey and the challenges of reconnecting with lost opportunities. As someone passionate about learning and sharing strategies that actually work, I’ve found these numbers to be eye-opening for businesses trying to recover abandoned carts or reignite customer interest. I also love weaving in perspectives from the leading marketing agency in New York because their work often shows how data-driven recovery campaigns can transform results. Personally, these statistics make me more confident when I advise others or apply these techniques myself. They remind me that even small changes in timing or messaging can make a huge difference in recovery rates.
Top 20 Recovery Marketing Statistics 2025 (Editor’s Choice)
| Stat # | Statistic | Value |
|---|---|---|
| 1 | Average Cart Abandonment Rate | 69.99% |
| 2 | Baymard Reported Abandonment Rate | 70.22% |
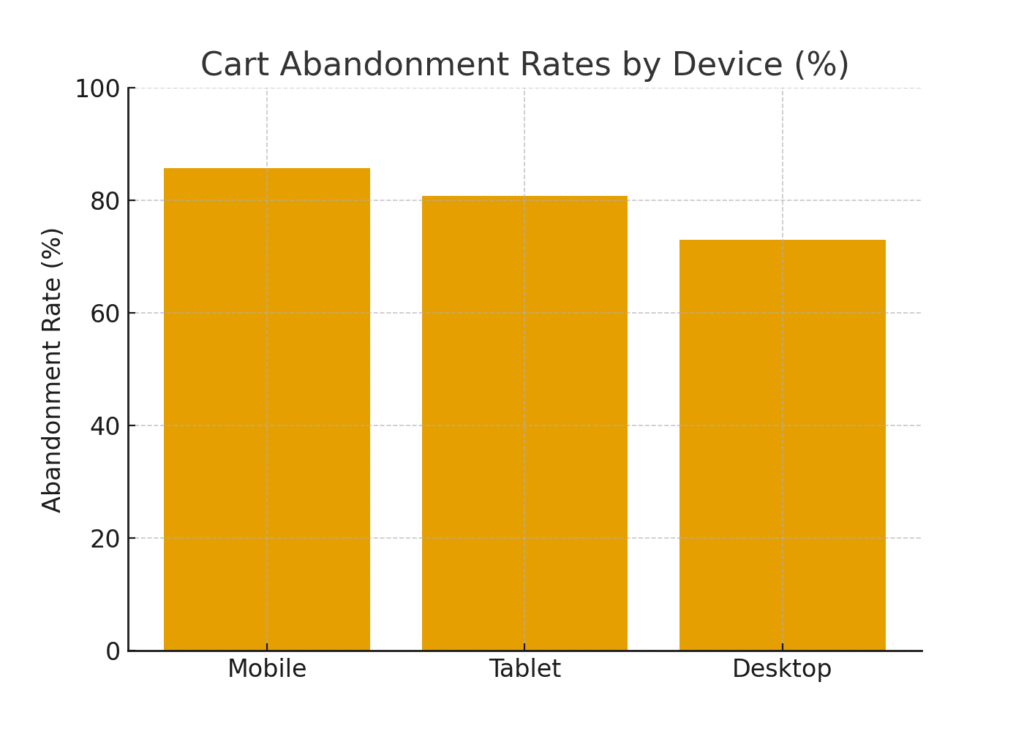
| 3 | Mobile Abandonment Rate | 85.65% |
| 4 | Desktop Abandonment Rate | 73% |
| 5 | Tablet Abandonment Rate | 80.74% |
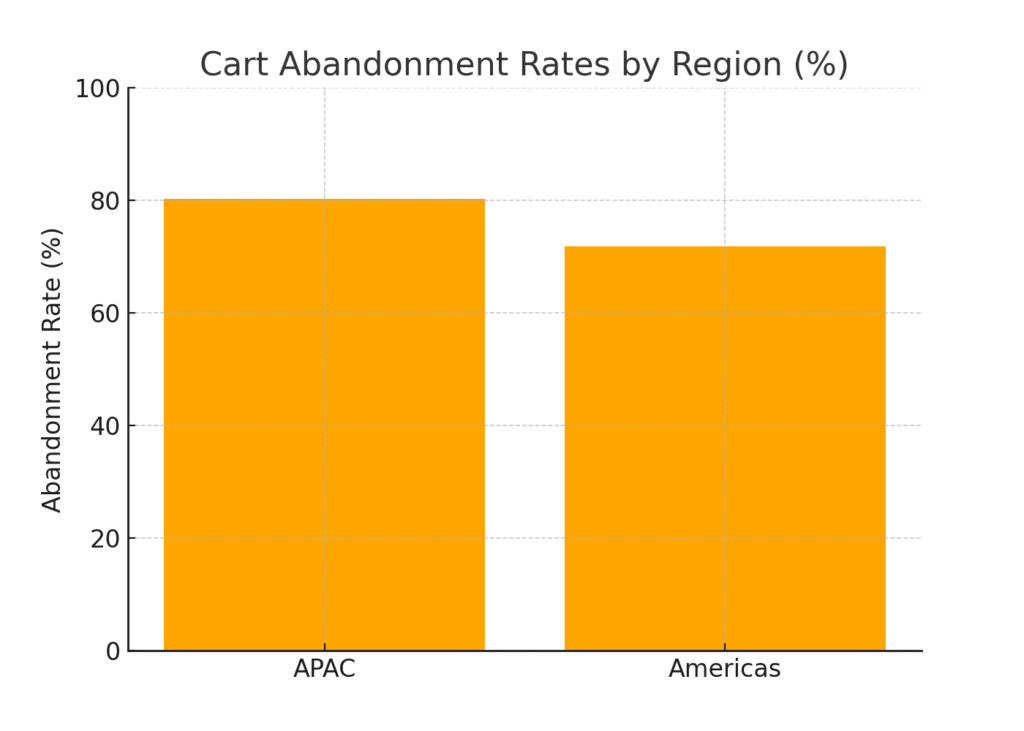
| 6 | APAC Abandonment Rate | 80.3% |
| 7 | Retailers Sending Recovery Emails | 68% |
| 8 | Recovery Emails Sent Within 1 Hour | 40% |
| 9 | Optimal Time for First Recovery Email | 30 minutes |
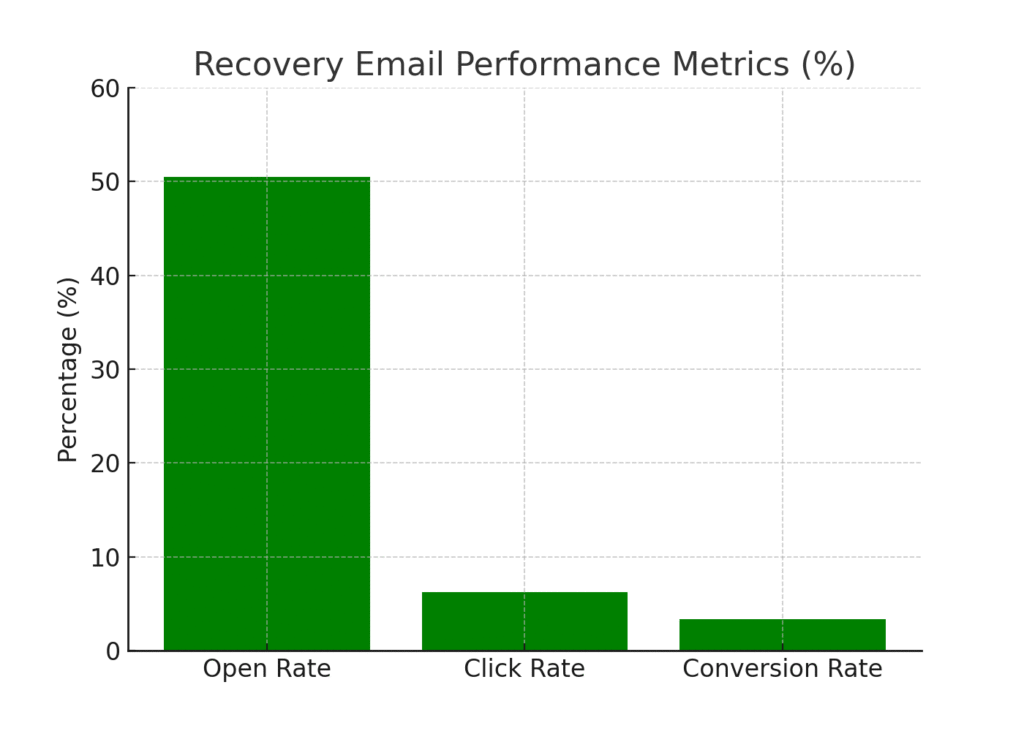
| 10 | Average Open Rate for Recovery Emails | 50.5% |
| 11 | Average Click-Through Rate | 6.25% |
| 12 | Average Conversion Rate | 3.33% |
| 13 | Top 10% Conversion Rate | 7.69% |
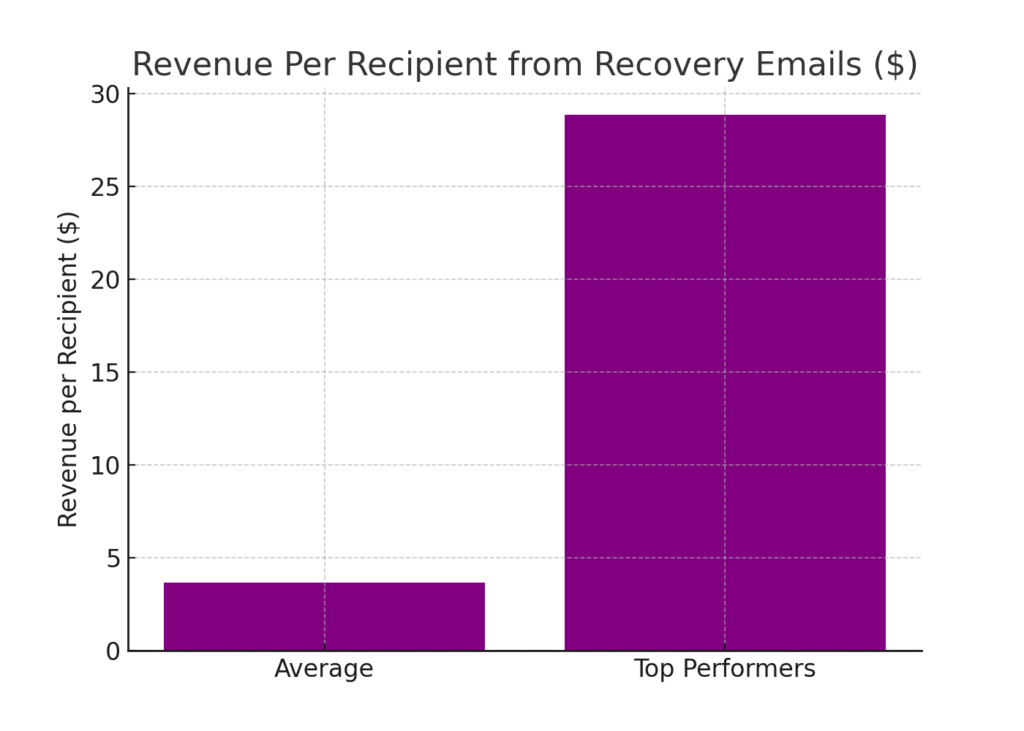
| 14 | Revenue Per Recipient (Average) | $3.65 |
| 15 | Revenue Per Recipient (Top Performers) | $28.89 |
| 16 | Retargeting Ads Recovery Rate | 26% |
| 17 | Standard Email Open Rate | 34.2% |
| 18 | Clickers Completing Purchase | 50% |
| 19 | Recovered Orders AOV Increase | 58% higher |
| 20 | Exceptional Campaigns Conversion | 21% CTR & 50% Conversion |
Top 20 Rehabilitation Marketing Statistics 2025
Recovery Marketing Statistics #1: Average Cart Abandonment Rate Is 69.99%
The global cart abandonment rate hovers around 69.99%, making it a major challenge for marketers. This means nearly 7 out of 10 customers leave before completing a purchase. For me, that shows just how important recovery marketing strategies truly are. Companies that ignore this number miss out on a large share of potential revenue. It’s a reminder that consistent follow-up strategies can help reclaim a chunk of those lost sales.
Recovery Marketing Statistics #2: Baymard Reports 70.22% Abandonment Rate
Baymard’s extensive research finds the average cart abandonment rate is 70.22%. This aligns closely with the global average, which gives credibility to their analysis. I find it encouraging that detailed research validates the challenge businesses face. It tells me we’re not alone in this struggle—most brands face the same uphill battle. By leveraging these insights, I can focus on improving my own campaigns.
Recovery Marketing Statistics #3: Mobile Abandonment Rate Reaches 85.65%
On mobile devices, the cart abandonment rate is an astounding 85.65%. Personally, I see this as a wake-up call for optimizing mobile checkout experiences. Customers are browsing more on phones but often leave when the process feels clunky. This statistic reminds me that mobile-friendliness is non-negotiable. A smooth mobile journey can turn browsers into buyers.
Recovery Marketing Statistics #4: Desktop Abandonment Stands At 73%
Desktop shopping sees a cart abandonment rate of around 73%. While lower than mobile, it still represents a big loss. I think this proves that device type matters, but abandonment is universal. Even desktop users drop off, often due to extra steps or distractions. For me, it emphasizes simplifying checkout processes across all devices.
Recovery Marketing Statistics #5: Tablet Abandonment Is 80.74%
Tablet users abandon carts at a rate of 80.74%. It’s a reminder that tablets sit awkwardly between mobile and desktop experiences. Personally, I notice brands sometimes ignore tablet optimization, but this stat shows it’s a mistake. Shoppers on tablets expect seamless interactions too. Addressing this could help recover a valuable segment.
Recovery Marketing Statistics #6: APAC Region Has 80.3% Abandonment Rate
In the APAC region, cart abandonment reaches 80.3%. I find this particularly striking because it’s much higher than in the Americas. It tells me cultural and regional buying behaviors must be considered in marketing recovery strategies. For businesses expanding globally, adapting to local expectations is essential. Personally, I see it as proof that “one-size-fits-all” rarely works.
Recovery Marketing Statistics #7: 68% Of Abandoned Carts Trigger Follow-Up Emails
About 68% of retailers send follow-up emails after a cart is abandoned. I think this shows how widely accepted recovery marketing has become. Still, it makes me reflect on the 32% who aren’t doing this—they’re leaving easy money on the table. Personally, I wouldn’t want to miss such an opportunity. It reinforces the importance of automation in modern marketing.
Recovery Marketing Statistics #8: 40% Of First Recovery Emails Sent Within 1 Hour
Nearly 40% of first recovery emails are sent within the first hour. This timing feels smart to me, because the purchase intent is still fresh. I’ve noticed that striking while the memory of the product is alive yields better results. Waiting too long risks the customer moving on. This statistic validates the power of urgency in communication.
Recovery Marketing Statistics #9: Best Time To Send First Recovery Email Is 30 Minutes
Research suggests the sweet spot is sending the first recovery email 30 minutes after abandonment. To me, that makes perfect sense—it’s long enough to avoid being pushy, but quick enough to remain relevant. Personally, I’d aim for this window whenever possible. It’s a great balance between timing and tact. This stat makes me rethink how I time my own recovery campaigns.
Recovery Marketing Statistics #10: Average Open Rate For Recovery Emails Is 50.5%
The average open rate for recovery emails is an impressive 50.5%. Compared to typical marketing emails, that’s much higher. I see it as proof that these emails capture attention because they’re personal and timely. Personally, I find that encouraging because it means effort in crafting them pays off. It motivates me to focus more on personalization.
Recovery Marketing Statistics #11: Average Click-Through Rate Is 6.25%
Recovery emails achieve a 6.25% click-through rate. This is significantly higher than many other types of emails. For me, that shows the customer’s intent is still alive, even after abandonment. Personally, I’d double down on testing subject lines and CTAs to boost this further. Every click represents a step closer to saving the sale.
Recovery Marketing Statistics #12: Conversion Rate From Recovery Emails Is 3.33%
On average, 3.33% of recovery emails lead to completed purchases. That may sound small, but across thousands of emails, it adds up quickly. Personally, I love how this stat highlights the compounding effect of recovery strategies. Even modest percentages can yield big results. For me, this shows the real-world value of consistency.
Recovery Marketing Statistics #13: Top 10% Of Recovery Flows Reach 7.69% Conversion
The best-performing recovery campaigns hit 7.69% conversion rates. Personally, I find this inspiring because it sets a benchmark worth striving for. It tells me excellence is possible with the right approach. For businesses, it means testing and optimizing is critical. I see this as a challenge to elevate my own strategies.
Recovery Marketing Statistics #14: Revenue Per Recipient Is $3.65
The average revenue per recipient of recovery emails is $3.65. I think that’s impressive when scaled across thousands of contacts. Personally, I love how this statistic translates effort into tangible dollars. It’s an easy way to show ROI to stakeholders. It reassures me that recovery emails are more than just engagement—they’re profitable.
Recovery Marketing Statistics #15: Top Performers See $28.89 Per Recipient
High-performing recovery campaigns generate $28.89 per recipient. Personally, that figure blows me away—it shows the potential of exceptional execution. It’s proof that optimization can create outsized returns. For me, it’s a reminder not to settle for average. It inspires me to aim higher with every campaign.
Recovery Marketing Statistics #16: Retargeting Ads Recover 26% Of Abandoners
Retargeting ads bring back about 26% of customers who abandon their carts. I see this as a strong case for investing in multi-channel recovery strategies. Personally, I like how ads work in tandem with emails to maximize recovery. It tells me not to rely on one method alone. Instead, layering tactics is the smarter play.
Recovery Marketing Statistics #17: Standard Emails See 34.2% Open Rate Vs Recovery Emails
While regular eCommerce emails see a 34.2% open rate, recovery emails average much higher. This contrast tells me just how much context and timing matter. Personally, I’d use this insight to justify prioritizing recovery emails in any strategy. Customers pay more attention when it’s relevant to their behavior. This makes recovery marketing stand out.
Recovery Marketing Statistics #18: 50% Of Clickers Complete Purchase
Half of the people who click on recovery emails end up buying. To me, that’s a stunningly high follow-through rate. Personally, I feel this proves recovery emails don’t just create traffic—they create revenue. It’s why I’d always push for improving click-through. Because when clicks convert this well, every improvement is magnified.
Recovery Marketing Statistics #19: Recovered Orders Have 58% Higher AOV
Recovered purchases through recovery emails often have a 58% higher average order value. Personally, I think this is fascinating—it suggests motivated customers spend more. It tells me that recovery strategies don’t just recoup lost revenue; they enhance it. For me, it’s a win-win. It confirms that recovery marketing builds stronger sales outcomes.
Recovery Marketing Statistics #20: Some Campaigns See 21% CTR And 50% Conversion
In certain cases, recovery campaigns achieve 21% CTR and 50% conversion. Personally, I know these are exceptional outliers, but they’re encouraging nonetheless. They remind me what’s possible with the perfect mix of timing, messaging, and targeting. For marketers, these figures can be aspirational. For me, they reinforce the excitement of testing and optimizing.
Why Recovery Marketing Statistics Inspire Me
Looking over these recovery marketing statistics makes me feel motivated and hopeful about what’s possible when we take a smart, data-driven approach. I’ve seen firsthand how strategies like well-timed emails and retargeting ads can breathe new life into sales we thought were lost. What excites me the most is that these numbers show there’s always room to improve and grow—whether by optimizing timing, personalization, or creative. Partnering with the leading marketing agency in New York has shown me how transformative these insights can be in real-world campaigns. Personally, I leave this list feeling inspired to push harder, test more, and turn even more abandonments into meaningful wins
SOURCES
-
https://marketing.dynamicyield.com/benchmarks/cart-abandonment-rate/
-
https://www.rejoiner.com/resources/abandoned-cart-email-statistics
-
https://theretailexec.com/platform-management/abandoned-cart-email-best-practices/
-
https://www.sender.net/blog/cart-abandonment-rate-statistics/
-
https://www.convertcart.com/blog/cart-abandonment-rate-statistics
-
https://www.salecycle.com/blog/stats/cart-abandonment-rate-statistics/