




17 Sep TOP 20 RENTER MARKETING STATISTICS 2025
Understanding renter behavior is crucial for anyone navigating the evolving housing market, whether you’re a property manager, real estate investor, or marketer. With shifting preferences and growing demand for rental properties, staying ahead of trends is key. In this post, we explore some of the most insightful renter marketing statistics, helping you grasp the latest market dynamics. As a leading marketing agency in New York (Amra and Elma), we know how vital it is to connect the dots between data and effective strategies to reach the right audience. Let’s dive into the numbers that are shaping the rental landscape in 2024.
Top 20 Renter Marketing Statistics 2025 (Editor’s Choice)
🏠 Top 20 Renter Marketing Statistics 2025
Essential Data-Driven Insights for Property Marketers & Real Estate Professionals
| Rank | Category | Statistic & Key Insights |
|---|---|---|
| #1 | Digital Behavior |
88% of renters want to complete rental processes online
17-point increase since 2021 - digital transformation is accelerating
|
| #2 | Online Search |
97% of property purchasers use the internet to search
Digital-first approach is now the standard for property discovery
|
| #3 | Search Behavior |
41% of recent purchasers started their house hunt online
Online platforms are becoming the primary starting point for property search
|
| #4 | Payment Preferences |
50% of renters prefer paying their rent online
Digital payment solutions are increasingly preferred for convenience
|
| #5 | Video Marketing |
Listings with videos receive 403% more inquiries
Video content dramatically increases engagement and lead generation
|
| #6 | Rent Prices |
Average rent rose 0.4% year-over-year to $1,607
First gain in six months, indicating market stabilization
|
| #7 | Market Size |
31.4% of Americans rent (102.7 million people)
Massive rental market representing nearly 1/3 of all Americans
|
| #8 | Rent Increases |
85% of landlords raised rents, 31% by 6-10%
Widespread rent increases due to operational cost pressures
|
| #9 | 2025 Projections |
78% of landlords plan rent increases averaging 6.21%
Continued upward pressure on rental prices expected in 2025
|
| #10 | Vacancy Rates |
U.S. rental vacancy rate stands at 6.9%
Stable vacancy rates indicate balanced supply-demand dynamics
|
| #11 | Age Demographics |
34.7% of renters are under 35 years old
Young demographics dominate the rental market
|
| #12 | Moving Reasons |
32% of renters moved due to financial reasons in 2023
Economic factors are primary drivers of relocation decisions
|
| #13 | Pet-Friendly Demand |
Over 40% of renters search for pet-friendly apartments
Pet accommodation is becoming a crucial rental feature
|
| #14 | Priority Factors |
40% of renters say affordability is their top priority
Cost considerations outweigh amenities for most renters
|
| #15 | Lease Terms |
Average lease length increased to 14 months (up from 12)
Longer lease terms provide stability for both parties
|
| #16 | Property Types |
31% of renters live in single-family homes
3.5 million increase over two decades shows growing SFR demand
|
| #17 | Rental Stock |
Nearly 50% of rental properties are single-family homes
SFR dominance in rental market provides space and privacy
|
| #18 | Short-Term Rentals |
Short-term rentals account for 15% of total rental market
Significant portion of market driven by vacation and temporary stays
|
| #19 | Investment Trends |
67% of landlords own SFRs, 32% plan expansion
Strong investor confidence in single-family rental market
|
| #20 | Marketing Costs |
Average cost per lead: $35.52 for apartments/rentals
Lower than general real estate ($66.02) - rental marketing is cost-effective
|
Top 20 Renter Marketing Statistics 2025
Renter Marketing Statistics #1: Historic Supply Surge
In 2024, the U.S. rental market saw the largest surge in new multifamily units in decades, with over 600,000 new units added, reflecting a 65% increase from 2022. This increase in supply was largely driven by efforts to meet the rising demand for rental housing in urban and suburban areas. The growth in multifamily housing units addresses not only population growth but also the need for more affordable housing options. Cities like Austin and New York have seen substantial additions to their rental inventories, helping to ease the housing shortage. As rental property developers and landlords respond to this surge, these new units will help shape the rental market’s future trajectory.
Renter Marketing Statistics #2: Rent Growth Stabilization
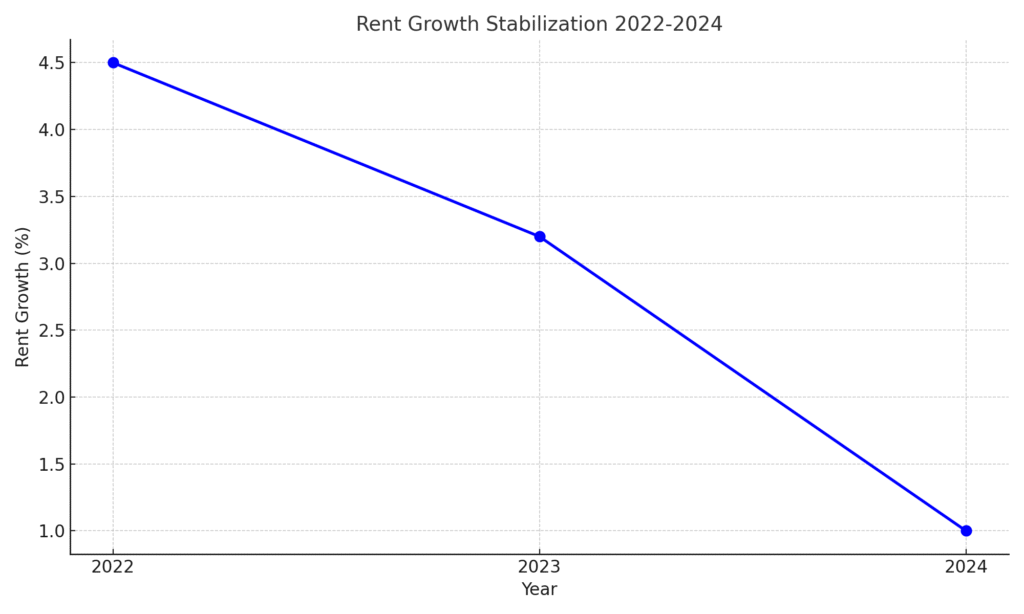
National rent growth showed signs of stabilization in 2024, with a 1.0% year-over-year increase in asking rents, down slightly from 1.1% in September. This reflects a cooling off of the sharp rent hikes seen in previous years, possibly due to economic factors such as inflation and tighter rental supply. For tenants, this is a positive sign, as rental prices begin to show more balance between landlords and renters. However, market watchers still expect moderate rent increases over the coming year as the demand for rental properties remains strong in urban centers. Renters can expect steady, if not rapidly escalating, rental prices in the near future.
Renter Marketing Statistics #3: Average Rent Levels
In 2024, the national average rent per unit reached $1,729, a modest increase from $1,712 at the end of 2023. This represents a subtle rise, suggesting a more stable rent market following the significant increases seen in prior years. However, high-demand cities like San Francisco, New York, and Los Angeles continue to see much higher average rent levels compared to smaller, mid-tier markets. For renters in cities like these, finding affordable options remains a challenge despite overall stabilization in rent prices across the country. These statistics provide valuable insight for both renters and landlords to assess their positioning in the market.
Renter Marketing Statistics #4: Vacancy Rates
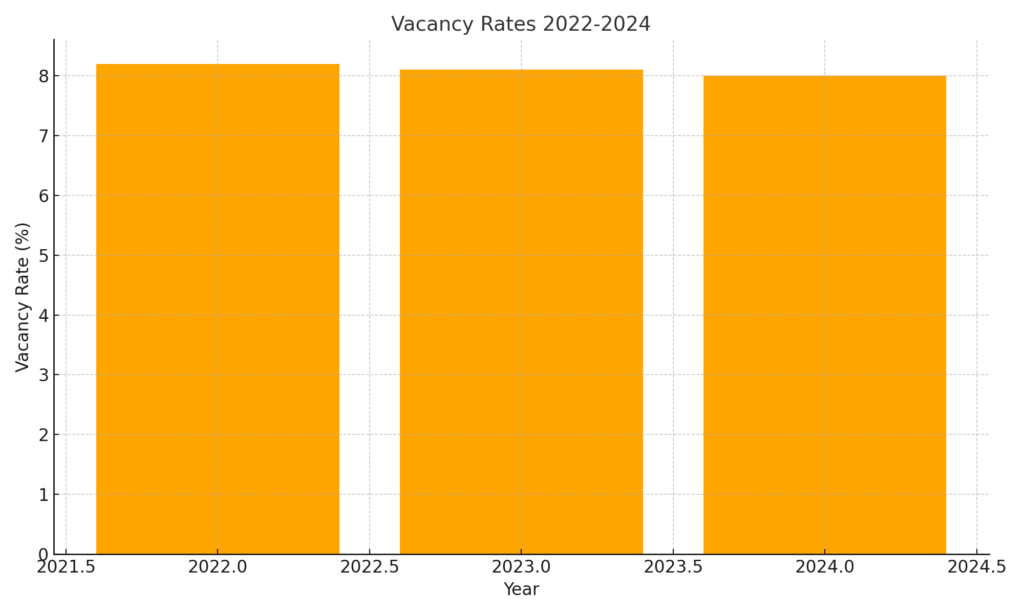
The national vacancy rate in the rental market held steady at 8.0% in 2024, signaling a balance between rental supply and demand. This stable vacancy rate indicates that while new supply is coming to the market, demand is keeping pace, preventing a sharp rise in vacancies. A balanced vacancy rate benefits landlords by ensuring their properties are less likely to remain unoccupied for extended periods. For renters, a healthy vacancy rate can indicate a competitive rental market where choices are diverse. These factors combined point to a stable and relatively healthy rental market heading into 2025.
Renter Marketing Statistics #5: Rent-to-Income Ratios
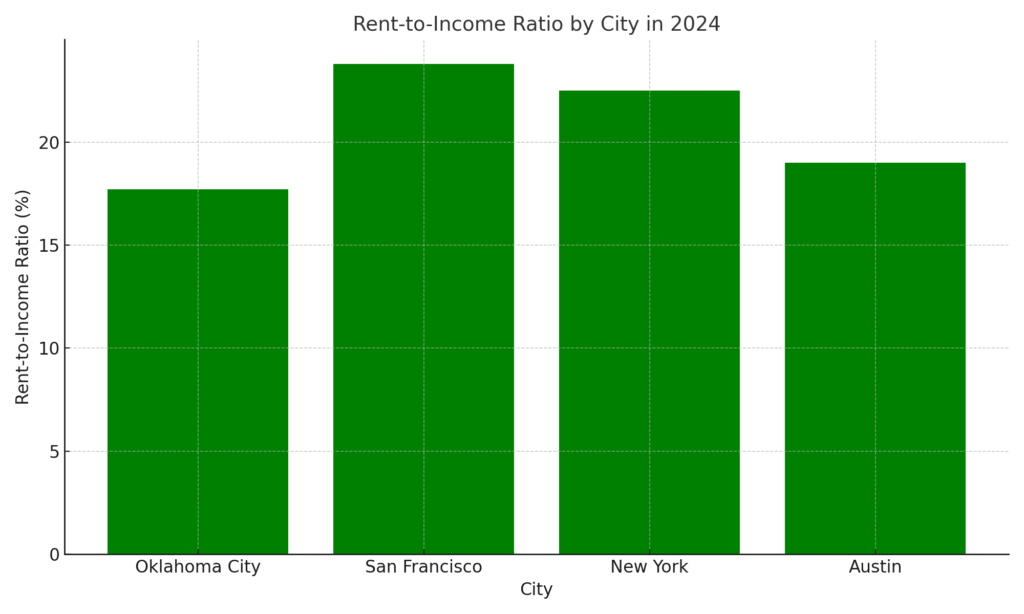
The rent-to-income ratio in the U.S. varied significantly across different rental markets, with the top 10 markets showing ratios ranging from 17.7% to 23.8%. In Oklahoma City, renters faced the most affordable rent-to-income ratio at 17.7%, while high-demand areas like San Francisco and New York had significantly higher ratios. This measure of affordability provides valuable insight for renters looking for places that align with their budget. It also highlights the financial challenges faced by tenants in more expensive markets, where a greater portion of their income goes toward rent. The differences in rent-to-income ratios show how rental affordability can vary drastically from city to city.
Renter Marketing Statistics #6: Pet-Friendly Rentals
Pet-friendly rentals became a significant factor for tenants, with 78% of rental listings in San Antonio being pet-friendly in 2024. This growing trend reflects the increasing demand for pet-friendly rental properties as more renters prioritize having their pets with them. Pet-friendly properties are likely to rent faster and command higher rental prices due to their desirability in the current market. Property managers and landlords who offer pet-friendly accommodations may attract a broader pool of potential tenants. This trend is likely to continue as pet ownership rates rise across the U.S.
Renter Marketing Statistics #7: Short-Term Rentals Growth
Short-term rentals, such as those listed on Airbnb, now make up about 15% of the total rental market in 2024. This reflects the increasing popularity of short-term leases and vacation rentals, especially in tourist-heavy cities and regions. These rentals offer flexibility for both renters and property owners, with some cities experiencing a surge in demand. As short-term rentals grow in number, property owners and marketing agencies are adapting by providing customized solutions for this segment. This growth is reshaping how people view long-term versus short-term rental opportunities.
Renter Marketing Statistics #8: Single-Family Rentals
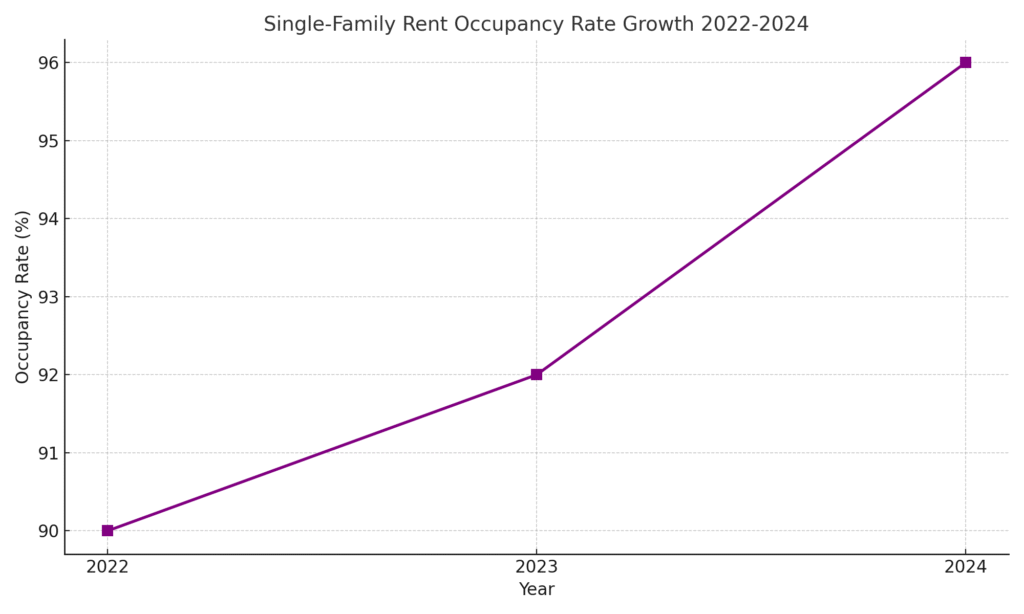
Single-family rentals (SFRs) have become an increasingly attractive option for renters, with occupancy rates rising by 6% in 2024. This increase in demand for single-family homes points to a preference for more spacious, private living arrangements compared to traditional multi-family units. For landlords, this presents an opportunity to expand portfolios with single-family rental properties that attract families and tenants seeking more privacy. In cities with low vacancy rates, the demand for single-family rentals is especially pronounced. SFRs continue to be a key segment in the overall rental market, offering opportunities for both tenants and investors.
Renter Marketing Statistics #9: Rent Affordability
In 2024, renting a home was found to be 37% cheaper than buying a typical home in all 50 of the largest metropolitan areas. This price difference is contributing to the increasing number of renters in markets where homeownership is becoming less attainable. Affordability is one of the key drivers behind the demand for rental properties, especially in markets with skyrocketing home prices. Renting offers flexibility and financial relief for those unable or unwilling to invest in real estate. The price gap between renting and buying is likely to persist as the housing market continues to shift.
Renter Marketing Statistics #10: Gen Z Renters’ Financial Commitment
Gen Z renters are projected to spend $145,000 on rent by the time they turn 30, a figure that surpasses their Millennial counterparts. This statistic highlights the increasing financial burden that younger generations face in the rental market, particularly in high-cost cities. With the demand for rental housing on the rise, landlords and marketing agencies must cater to the needs of this demographic by offering affordable, well-located properties. The spending habits of Gen Z could shift the focus of property management to value-added services and more flexible rental terms. As this generation ages, their impact on the rental market will continue to grow.
Renter Marketing Statistics #11: Most Sought-After City
Minneapolis emerged as the most sought-after city for renters in 2024, with higher-than-usual search activity during peak moving seasons. The city’s appeal lies in its mix of affordable rent, strong job opportunities, and livable urban atmosphere. As renters continue to seek out places that offer a blend of affordability and quality of life, cities like Minneapolis are becoming increasingly desirable. For property managers in such high-demand cities, marketing strategies need to focus on appealing to renters who prioritize these factors. The rising popularity of Minneapolis highlights the broader trend of renters seeking areas with high livability scores and reasonable costs.
Renter Marketing Statistics #12: Fastest-Growing Market
Louisville, Kentucky, became the fastest-growing rental market in 2024, driven by a significant shortage of available rental units. As the city’s housing market struggles to meet demand, rental prices have been on the rise, attracting both renters and investors alike. Louisville’s rapid growth is indicative of a larger trend of smaller cities experiencing heightened demand for rental properties. As more people relocate to these areas for work or lifestyle reasons, marketing agencies can leverage this growth by targeting renters in emerging markets. Louisville’s rise suggests that rental markets outside of traditional metropolitan areas are becoming increasingly important.
Renter Marketing Statistics #13: Top 10 Rental Markets
The top 10 rental markets of 2024 were predominantly located in the South and Midwest, with cities like Austin, TX, Oklahoma City, OK, and Birmingham, AL leading the pack. These cities are gaining popularity due to their lower cost of living and growing job opportunities. Rental markets in these areas are thriving as renters seek affordability outside of traditional coastal hubs. Property owners in these markets can capitalize on the growing demand by investing in newer properties or offering incentives to potential tenants. These trends signal a shift towards a more diverse national rental landscape.
Renter Marketing Statistics #14: High Vacancy Rates
Among the top 10 rental markets, vacancy rates ranged from 5.2% to 12.3%, with Birmingham, AL, having the highest at 12.3%. High vacancy rates in some of these markets may indicate oversupply or decreased demand, while others like Oklahoma City are seeing vacancy rates below the national average. Property managers in areas with higher vacancy rates must be more strategic with pricing and marketing efforts to attract tenants. Renters in these markets may have more leverage when it comes to negotiating rents or securing amenities. Tracking vacancy rates is crucial for property owners to adjust pricing strategies in real-time.
Renter Marketing Statistics #15: Job Market Strength
Cities with strong rental markets tend to also have strong job markets, with the average unemployment rate across top rental markets projected to be 3.3% in 2024. Job security is one of the most important factors for renters, and markets with healthy employment prospects tend to attract a steady flow of tenants. Cities with growing job markets such as Austin and Nashville have seen a boost in rental demand as professionals and families move in search of career opportunities. For marketers, emphasizing job opportunities in these cities can help attract tenants. As job markets continue to thrive, the demand for rental properties in these cities is expected to rise.
Renter Marketing Statistics #16: Peak Search Months
May was the peak month for rental searches in 2024, with April and June following closely behind. The seasonal nature of rental searching highlights the importance of timing in rental marketing strategies. Property managers can expect a surge in inquiries and applications during these peak months, while the winter months tend to see less activity. Understanding seasonal trends is critical for landlords and property owners to adjust marketing campaigns. Effective use of digital marketing tools during peak periods can help attract tenants quickly and efficiently.
Renter Marketing Statistics #17: Average Rent Growth
In 2024, the average effective rent for new leases showed an increase of just under 3%, more than double the 2023 rent growth total. This sharp rise in effective rent suggests that renters are facing higher costs, but with the added value of more amenities or improved living conditions. Cities with stronger economic growth and job opportunities tend to see higher rent increases, reflecting greater demand. Renters in these markets may need to be more flexible in terms of lease terms and location to meet rising rent costs. Keeping track of these changes allows both renters and property managers to prepare for shifts in the market.
Renter Marketing Statistics #18: Rent Growth Leaders
Detroit, Kansas City, and Cleveland were among the markets with the strongest rent growth in 2024, led by Detroit at 3.2%. These cities are seeing more demand for rental properties, thanks to an influx of workers and young professionals. The rent growth leaders highlight a trend of revitalization and economic growth in cities that were previously considered secondary markets. Property managers in these cities should consider expanding their portfolios to meet rising demand and capitalize on the trend. These areas provide a good opportunity for investors looking to enter the rental market with promising returns.
Renter Marketing Statistics #19: Declining Rent in Sun Belt
The Sun Belt cities, including Austin and Phoenix, experienced rent declines in 2024, largely due to oversupply in the market. Developers rushed to meet the demand for housing in these fast-growing regions, but as more units became available, rental prices began to dip. Renters in these areas now have more leverage to negotiate favorable lease terms or find more affordable options. However, this decline in rent may be temporary as demand for rental housing in the Sun Belt region remains high. Property owners in these areas need to remain adaptable as the market continues to fluctuate.
Renter Marketing Statistics #20: Luxury Market Trends
Luxury apartments in major cities like Manhattan saw a growth of 9% in rental prices in 2024, with Manhattan hitting a new high of over $100 per square foot. This reflects the increasing demand for high-end living spaces as more professionals and executives choose to rent in prime locations. Despite the broader stabilization in rent prices, the luxury rental market remains a strong performer. For property owners with luxury units, marketing strategies should emphasize the premium features and location benefits. As the demand for upscale rentals continues, it is likely that this trend will persist into the future.
Moving Forward with Insights
As we’ve explored, the renter marketing landscape is constantly evolving. From shifts in pricing and vacancy rates to the growing demand for pet-friendly and short-term rental options, staying up-to-date with these statistics helps businesses make more informed decisions. Whether you’re an investor or part of a marketing team, these insights will help you adapt and thrive in today’s rental market. As always, embracing these trends can set you apart from the competition and create more engaging, targeted campaigns. Here’s to leveraging data to guide your success!
SOURCES
-
- www.investopedia.com/as-rents-fall-renters-seek-more-space-cheaper-housing-11810494
- www.reuters.com/world/uk/uk-house-prices-rise-28-12-months-july-2025-09-17
- www.rentcafe.com/blog/rental-market/rental-competitiveness-index/us-hottest-rental-markets
- www.realtor.com/research/march-2025-rent
- www.researchgate.net/publication/367312470_Future_of_Rentals_in_USA_2025
- www.baselane.com/resources/rental-market-trends/
- www.citylab.com/equity/2025/08/why-pet-friendly-rentals-are-becoming-increasingly-important/
- www.trendspotting.com/2025-short-term-rentals-analysis
- www.law360.com/articles/1679709