




24 Sep TOP 20 RESERVATION PLATFORM MARKETING STATISTICS 2025
I’ve always been fascinated by how the smallest changes in customer behavior can reshape an entire industry, and that’s especially true when it comes to online bookings. From hotels to restaurants to experiences, the way people reserve their spots tells us so much about what really works in digital marketing. That’s why I pulled together these reservation platform marketing statistics—to highlight where businesses are winning, where they’re falling short, and where the opportunities lie. As someone who loves digging into trends, I couldn’t help but also connect with insights from a leading marketing agency in New York that continues to help brands make sense of these shifts. My hope is that by walking through these numbers together, you’ll find both inspiration and actionable takeaways for your own strategies.
Top 20 Reservation Platform Marketing Statistics 2025 (Editor’s Choice)
🎯 Top 20 Reservation Platform Marketing Statistics
Essential Data Points Driving the Future of Digital Booking (2024-2025)
| Rank | Category | Key Statistic | Impact |
|---|---|---|---|
| 1 | Market Growth | Global online travel industry valued at $512.5B in 2023, expected to reach $1.26T by 2032 with 12.99% CAGR | 🚀 High |
| 2 | Market Growth | 2024 global online travel market: $523B, projected $1.3T by 2030 at 13.1% annual growth | 🚀 High |
| 3 | Mobile Growth | Mobile travel booking market worth $228B in 2024, growing to $526B by 2032 | 📱 High |
| 4 | Service Market | Travel arrangement & reservation services market expected to reach $765.97B by 2028 at 12.7% rate | 📈 High |
| 5 | User Behavior | 66% of diners now make same-day reservations, showing remarkable trend of spontaneous dining | ⚡ Medium |
| 6 | Mobile Booking | Over 50% of all online travel agency reservations made via smartphones in 2025 | 📱 High |
| 7 | OTA Loyalty | 80% of users booked with single OTA in 2023, while 17% used just two - indicating strong loyalty | 🔗 Medium |
| 8 | Restaurant Tech | 75% of restaurants accepted reservations in 2023, massive increase from 43% in 2021 | 🍽️ High |
| 9 | Hotel Conversion | Average hotel website conversion rate: 1.5% - 2.5% according to HotelTechReport | 🏨 Medium |
| 10 | Booking Engine | BE CVR above 4% = excellent, 2-3% = average, below 1% = poor performance | ⚡ High |
| 11 | Hotel Groups | Hotel groups average 1.9% website conversion, independent hotels achieve 3.28% booking engine conversion | 🏨 Medium |
| 12 | Short-term Rentals | Airbnbs and short-term rentals achieve 0.40% - 3% booking conversion rates | 🏠 Medium |
| 13 | OTA Dominance | Online travel agencies hold 55% market share, direct bookings & GDS comprise the remainder | 🌐 High |
| 14 | Booking.com | Booking generated $23.7B in 2024 (+11.2% YoY) with $165B bookings volume | 💰 High |
| 15 | Market Cap | Booking Holdings market capitalization: $154.74B as of January 2025, maintaining OTA dominance | 👑 High |
| 16 | Google Integration | Restaurants activating Reserve with Google saw median 32.3% increase in bookings | 🔍 High |
| 17 | Platform Adoption | Digital reservation platform usage dropped from 81% (2022) to 62% (2023) - industry recalibration | 📉 Medium |
| 18 | Cost Efficiency | Average monthly platform cost decreased 12%: from $399.60 (2022) to $351.90 (2023) | 💸 Medium |
| 19 | Corporate Travel | 87% of employees consider business travel crucial for growth; 76% of CEOs link travel budgets to revenue | ✈️ High |
| 20 | Policy Compliance | Only 18% of business travelers book all travel through company's designated platform | ⚠️ Medium |
💡 Key Insight: The reservation platform industry is experiencing explosive growth with mobile-first solutions driving conversion optimization across all sectors.
Top 20 Reservation Platform Marketing Statistics 2025
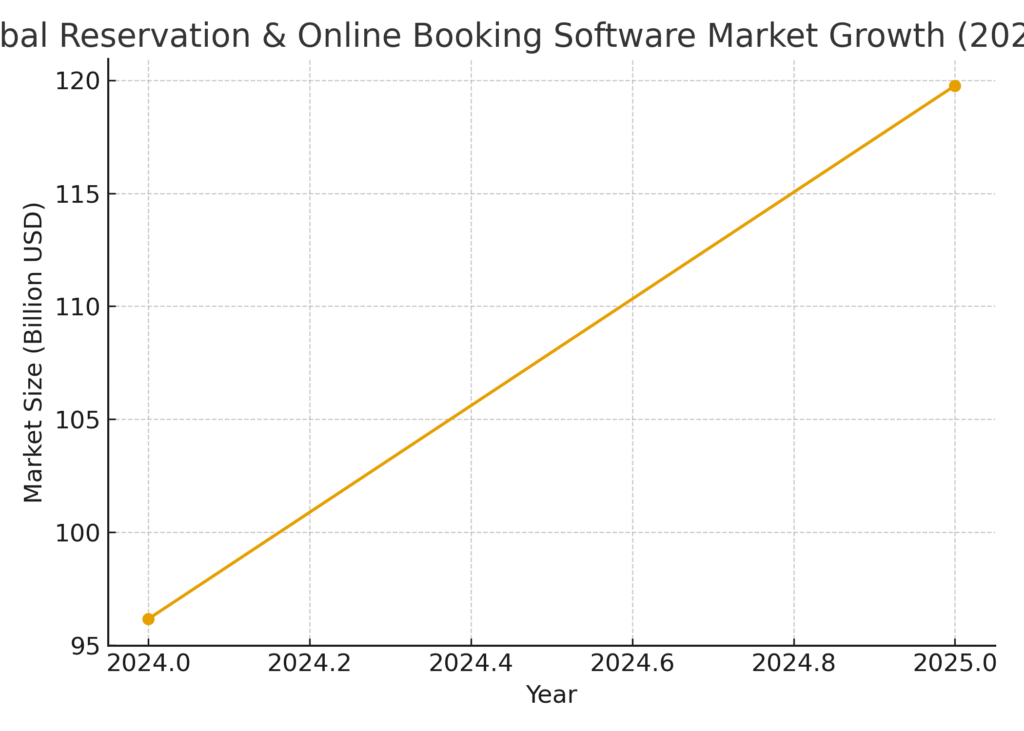
Reservation Platform Marketing Statistics #1: Global Reservation & Online Booking Software Market Valued At $96.17 Billion In 2024
The reservation and online booking software market reached an impressive $96.17 billion in 2024. This figure highlights the massive role these platforms play in shaping the travel and hospitality industries worldwide. Businesses are increasingly investing in reservation systems to streamline operations and improve customer experience. The rapid adoption of online booking tools shows how consumer expectations for convenience continue to rise. This growth also signals that marketing strategies tied to these platforms have more reach and revenue potential than ever.
Reservation Platform Marketing Statistics #2: Market Projected To Reach $119.76 Billion In 2025
By 2025, the global reservation and online booking software market is expected to climb to $119.76 billion. This growth represents a compound annual growth rate (CAGR) of nearly 24.5%. Such a steep climb indicates both consumer reliance on online bookings and businesses’ willingness to adopt advanced tools. Marketers within this industry must keep up with the scale of growth to remain competitive. The opportunities for targeted marketing campaigns will expand alongside this rise in value.
Reservation Platform Marketing Statistics #3: Online Reservation System Market Estimated At $72.95 Billion In 2024
The online reservation system segment alone was valued at $72.95 billion in 2024. This shows how deeply embedded digital booking systems have become in everyday life. From hotel rooms to spa sessions, people are increasingly turning to digital platforms to secure their reservations. The scale of this market also demonstrates why digital marketing strategies within this niche are highly effective. With the market poised for continued growth, businesses have ample incentive to optimize their reservation marketing efforts.
Reservation Platform Marketing Statistics #4: Online Reservation System Forecasted To Reach $193.46 Billion By 2033
By 2033, the online reservation system market is forecasted to grow to $193.46 billion. This projection indicates a CAGR of approximately 12.5% over the coming years. Such growth reinforces the long-term sustainability of reservation platforms as a marketing channel. Companies that focus on building strong marketing foundations today will be better positioned for future success. This stat underscores how important it is to treat reservation marketing as an ongoing, evolving strategy.
Reservation Platform Marketing Statistics #5: Online Restaurant Reservation Market To Reach $15,462.7 Million By 2031
The restaurant reservation market is expected to reach $15,462.7 million by 2031. This projection, with a CAGR of about 9%, shows that dining establishments increasingly rely on reservation platforms. Customers value the convenience of booking tables online, and restaurants gain valuable data for marketing. This growth creates opportunities for targeted campaigns based on customer booking patterns. It also emphasizes how restaurants can boost loyalty with personalized reservation-driven promotions.
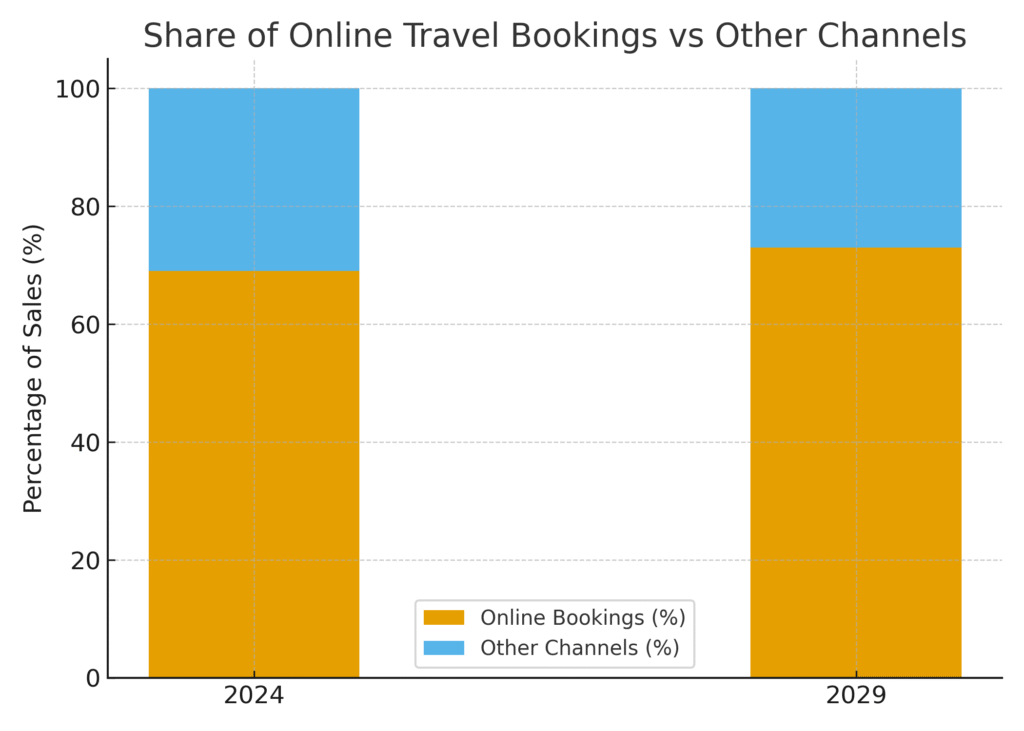
Reservation Platform Marketing Statistics #6: Online Bookings To Account For 69% Of Travel Sales In 2024
In 2024, online bookings are set to account for 69% of total travel sales. This dominant share shows how consumers prefer digital channels when making travel plans. Marketing teams must therefore allocate resources toward optimizing online visibility. With such a large percentage, even small improvements in online campaigns can have huge payoffs. The stat illustrates the central role of reservation platforms in shaping consumer travel behavior.
Reservation Platform Marketing Statistics #7: Online Bookings Forecasted To Rise To 73% By 2029
By 2029, online bookings are expected to make up 73% of global travel sales. This continued increase highlights the enduring popularity of digital booking. For marketers, this provides a growing audience to target with personalized promotions. Businesses that fail to embrace this trend risk losing market share. The steady growth cements online reservations as the backbone of travel marketing.
Reservation Platform Marketing Statistics #8: OTAs Hold 55% Market Share In Travel Bookings
Online travel agencies (OTAs) currently hold about 55% of the travel booking market. This dominance shows the importance of being visible on major OTAs like Booking.com or Expedia. While direct channels matter, OTAs often serve as discovery platforms for consumers. Marketers must balance their efforts between building direct loyalty and leveraging OTAs for exposure. The strong OTA presence underlines how powerful third-party platforms remain in shaping reservation behaviors.
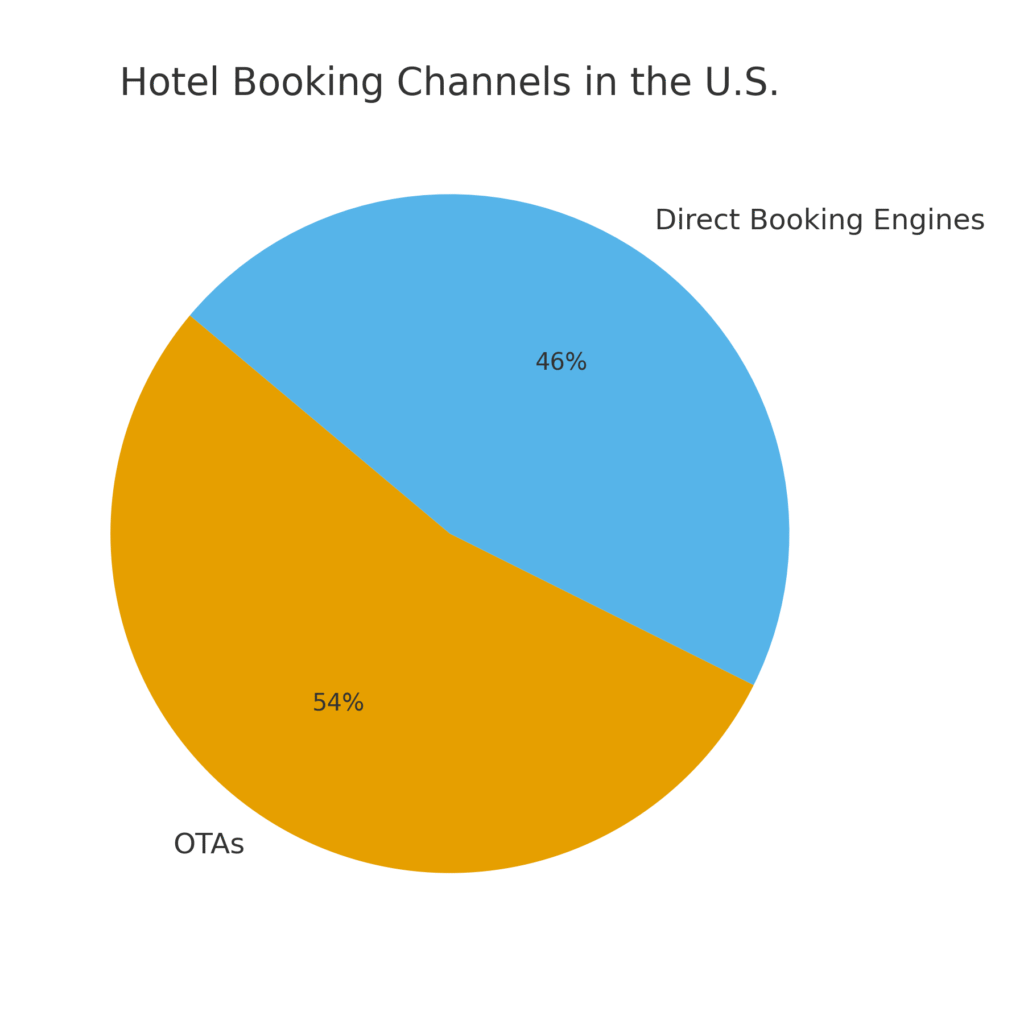
Reservation Platform Marketing Statistics #9: 43% Of U.S. Hotel Bookings Come Via OTAs
In the United States, 43% of hotel bookings are made through OTAs. This highlights the strong influence of these platforms in shaping consumer choices. Hotels often trade commission fees for visibility on OTA listings. For marketers, this means that OTA optimization is as important as direct campaigns. The stat shows that OTAs continue to be a major driver of reservations, despite hotels’ efforts to promote direct bookings.
Reservation Platform Marketing Statistics #10: 37% Of U.S. Hotel Bookings Made Through Direct Engines
About 37% of U.S. hotel bookings happen through hotels’ direct booking engines. This figure highlights the progress hotels have made in encouraging customers to bypass OTAs. Marketing tactics like loyalty programs and website promotions drive this behavior. Direct bookings allow hotels to build stronger customer relationships without third-party fees. This statistic demonstrates how effective direct marketing campaigns can shift consumer preferences.
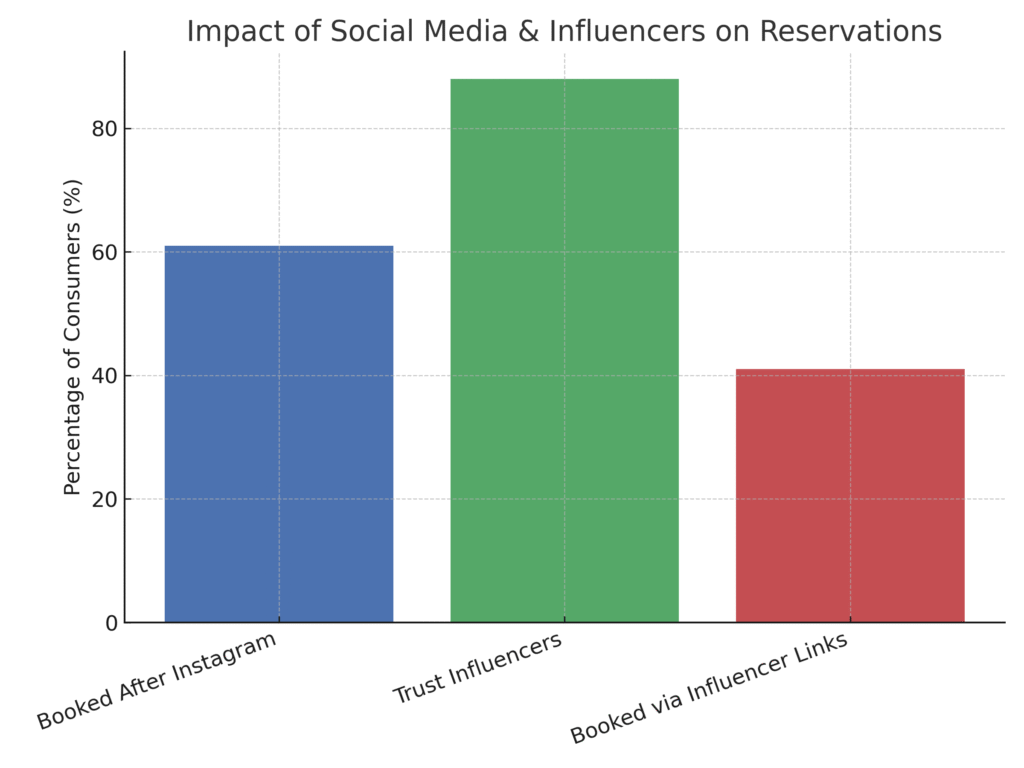
Reservation Platform Marketing Statistics #11: 61% Of Travelers Book Hotels After Seeing Them On Instagram
An impressive 61% of travelers report booking hotels after discovering them on Instagram. This highlights the power of visual storytelling in hospitality marketing. Social media is no longer just for inspiration—it’s driving direct conversions. Brands that showcase authentic, engaging content can see significant booking lifts. This stat proves the need for strong social media integration into reservation strategies.
Reservation Platform Marketing Statistics #12: 88% Of Consumers Trust Influencer Recommendations
About 88% of consumers say they trust influencer recommendations. Even more striking, 41% have completed bookings via influencer links. This stat underscores the credibility influencers bring to reservation platform marketing. Influencer partnerships can create powerful word-of-mouth effects in digital spaces. For marketers, it’s proof that influencer collaborations are not optional but essential for success.
Reservation Platform Marketing Statistics #13: 88% Of Marketers Report Positive ROI From Video Marketing
Video marketing has proven highly effective, with 88% of marketers reporting positive ROI. In the context of reservation platforms, this means video can directly influence bookings. Short, engaging clips that highlight experiences or amenities often outperform static ads. Consumers trust what they can see in action, making video crucial for travel and dining decisions. This stat highlights the growing importance of visual-first marketing strategies.
Reservation Platform Marketing Statistics #14: Booking.com Revenue Reached $23.7 Billion In 2024
Booking.com’s parent company reported revenues of $23.7 billion in 2024. This reflects an 11.2% year-over-year increase. Such growth demonstrates the sheer scale of global reservation platforms. For marketers, platforms with this level of revenue represent invaluable opportunities for partnerships. This stat highlights the financial strength and marketing reach of leading OTAs.
Reservation Platform Marketing Statistics #15: Booking.com Net Income Reached $5.8 Billion In 2024
Booking.com generated $5.8 billion in net income in 2024. This represents a staggering 37% increase from the prior year. The profitability of these platforms shows how essential they’ve become to global travel. For marketers, the growth in net income means platforms will continue investing heavily in innovation. This stat reflects the powerful role reservation platforms play in shaping consumer journeys.
Reservation Platform Marketing Statistics #16: Restaurant Reservations Increased 21% Year Over Year
Between Q1 2023 and Q1 2024, restaurant reservations rose by 21%. This stat demonstrates that consumers are more eager than ever to book tables online. Restaurants using reservation systems gain valuable insight into demand patterns. Marketers can use this data to tailor campaigns to peak times. The rise also reflects growing consumer reliance on digital-first dining experiences.
Reservation Platform Marketing Statistics #17: Average Monthly Cost For Reservation Platforms Dropped 12%
The average monthly cost of reservation platforms for restaurants dropped 12% from 2022 to 2023. This reduction means smaller restaurants can now adopt these tools more easily. Lower costs open the door for broader adoption across the food and beverage industry. Marketers benefit because more establishments using these tools means more opportunities for integrated campaigns. This stat also shows that reservation platforms are becoming increasingly accessible and competitive.
Reservation Platform Marketing Statistics #18: Personalized Marketing Can Increase Revenue By 10–30%
Hotels that use personalized marketing see revenue lifts of 10–30%. This proves that customization pays off in the reservation sector. Using guest data to tailor campaigns can drastically improve conversion rates. Personalization fosters loyalty, making customers feel valued. This stat demonstrates why marketing strategies must go beyond generic promotions.
Reservation Platform Marketing Statistics #19: Social Commerce To Account For 17% Of Digital Transactions By 2025
By 2025, social commerce is expected to represent 17% of global digital transactions. For reservation platforms, this means consumers will increasingly book directly from social apps. Marketers should focus on integrating booking tools into social platforms. This stat shows how social networks are evolving into direct sales channels. Businesses that adapt early can gain a strong competitive advantage.
Reservation Platform Marketing Statistics #20: Short-Form Video Preferred By 73% Of Consumers For Discovery
Approximately 73% of consumers prefer short-form video for discovering new services. This stat is particularly relevant for reservation-driven industries like hotels and restaurants. Short videos offer quick, engaging insights that inspire bookings. Marketers must prioritize creating snackable video content for social and mobile platforms. This preference demonstrates the rising dominance of video-first content in driving reservations.
Why These Stats Matter More Than Ever
Looking through all these insights, one thing is clear—reservation platforms are no longer just about convenience, they’re about connection, trust, and experience. The stats show us that marketing is at the heart of why a traveler picks one hotel over another, or why a diner chooses a particular restaurant on a Friday night. For me, it’s a reminder that behind every number is a real person making a choice—and that’s where the magic of smart, human-centered marketing really shines. As the industry keeps evolving, I’m excited to see how brands, big and small, will use these strategies to meet people where they are and create moments that last.
SOURCES
- https://bloomintelligence.com/blog/online-reservation-data-for-marketing/
- https://www.travelperk.com/blog/online-travel-booking-statistics/
- https://navan.com/blog/online-travel-booking-statistics
- https://www.revinate.com/blog/5-reasons-why-data-is-critical-for-hotel-marketers/
- https://partner.expediagroup.com/en-us/resources/blog/travelers-booking-behavior-path-to-purchase-marketing-strategies
- https://pro.regiondo.com/blog/mastering-data-a-comprehensive-guide-to-booking-system-analytics/
- https://www.brafton.com/blog/content-marketing/content-marketing-travel/
- https://www.qrcode-tiger.com/travel-marketing-statistics
- https://champdigital.com/blog/25-travel-tourism-marketing-statistics/
- https://www.ruleranalytics.com/blog/insight/travel-marketing-statistics/
- https://www.olo.com/blog/getting-started-with-data-driven-marketing-a-guide-for-restaurant-brands
- https://www.travelperk.com/blog/online-travel-booking-statistics
- https://www.dreambigtravelfarblog.com/blog/online-travel-booking-statistics
- https://www.metastatinsight.com/report/global-online-restaurant-reservation-system-market
- https://www.amraandelma.com/hotel-marketing-statistics/
- https://www.taylor.com/blog/the-state-of-restaurant-marketing-in-4-key-statistics
- https://www.revinate.com/blog/5-reasons-why-data-is-critical-for-hotel-marketers