




16 May TOP 10 SHOPPING ADS CTR STATISTICS 2026 THAT EXPOSE CLICK SURGE SECRETS
Updated for 2026. This page has been fully refreshed with the latest shopping ads CTR statistics, eCommerce advertising performance data, and retail search trends based on recent platform benchmarks and industry reporting.
Shopping ads continue to be a major revenue driver for eCommerce brands looking to capture high-intent buyers across search platforms. In 2026, advertisers are paying closer attention not just to cost-per-click, but to click-through rates (CTR) as a key signal of ad effectiveness. According to Amra & Elma, a leading digital marketing agency, CTR is more than just a metric—it’s a reflection of how well your product listings resonate with real-time user intent. A strong CTR means your title, image, price, and promotion are aligned with what shoppers are actively searching for, while a weak one often signals missed relevance or poor presentation.
The growth of mobile shopping and AI-powered personalization is also influencing which ads users choose to click. While Google Shopping remains the default for many advertisers, platforms like Bing are quietly outperforming in certain areas. Industry-specific benchmarks and device trends give deeper insight into what’s working across different markets, helping brands refine product feeds, bidding strategies, and visual presentation to maximize visibility and engagement.
TOP 10 SHOPPING ADS CTR STATISTICS 2026 THAT REVEAL MASSIVE CLICK SURGES
Shopping Ads CTR at a Glance
10 benchmark statistics every advertiser and media buyer needs to know — with updated 2026 figures, platform comparisons, and industry-level breakdowns.
| # | Metric / Platform | 2026 CTR | vs. 2025 | Key Insight |
|---|---|---|---|---|
| 01 | Google Shopping Ads All industries · average | 0.94% | +9.3% | AI-powered listing enhancements and expanded placements on YouTube Shorts & Discover drove a notable lift. WordStream Q1 2026. |
| 02 | Bing / Microsoft Shopping Ads Desktop-dominant · Copilot-boosted | 1.43% | +14.4% | 52% higher CTR than Google Shopping. Microsoft Copilot integration lifted product discovery sessions by 31% among ages 35–54. Microsoft Advertising H1 2026. |
| 03 |
Industry CTRs · Google Shopping
Top & bottom performers
Automotive 1.38%
HVAC 1.12%
Home Fitness 1.29%
Apparel 0.76%
Tech 0.61%
|
0.61– 1.38% |
Range | Automotive leads; tech lags. Home fitness surged 22% in search volume. Tinuiti Google Ads Benchmark Report, Feb 2026. |
| 04 | Google Search Ads Text-based · high intent | 3.29% | +3.8% | 3.5× higher than Shopping Ads. Legal at 4.1% and finance at 3.87% led gains via responsive ad automation. LocaliQ 2026, 17,000+ campaigns. |
| 05 | Google Display Network (GDN) Passive · brand awareness | 0.43% | −6.5% | Post-cookie deprecation, contextual targeting using Privacy Sandbox now averages 0.61% CTR — 33% above standard display. IAB 2026 Digital Ad Effectiveness Report. |
| 06 | Median CTR — All Google Ads Across all campaign types | 5.24% | +5.0% | Performance Max contributed a +0.18 pp uplift. Home services reached 6.1%; legal hit 5.9%. WordStream 2026, 25,000+ accounts. |
| 07 |
Top Industries · Search Ads CTR
Highest-engagement verticals
Dating 6.44%
Subscriptions 5.31%
Travel 5.12%
Advocacy 4.41%
|
6.44% | Peak | Dating & Personals leads all verticals. Subscription boxes debuted in the top 5 at 5.31% via AI-personalized targeting. Hanapin Marketing 2026 State of Paid Search. |
| 08 |
Lowest Industries · Search Ads CTR
Long buyer journey verticals
Technology 2.23%
B2B 2.38%
Consumer Svcs 2.41%
|
2.23% | +6.7% | Tech recovered slightly; AI-assisted copy cut generic headline usage by 41%. B2B remains second-lowest despite cross-channel budget growth. SpyFu 2026, 14,000 accounts. |
| 09 | Mobile Influence on Shopping Ads Share of paid Shopping clicks | 71% | +9.2pp | YouTube Shorts Shopping Ads hit 2.1% mobile CTR — 2× the standard. India leads globally at 3.4%; Brazil at 2.9%. Google Marketing Live, May 2026. |
| 10 | Google Shopping Ads Conversion Rate Clicks that become purchases | 2.14% | +12% | Product Studio AI feed enhancement added +0.23 pp. Sporting goods leads at 3.1%; pet supplies at 2.9%. Merkle 2026, $4.2B in spend analyzed. |
TOP 10 SHOPPING ADS CTR STATISTICS 2026 AND THE FUTURE OF CLICKS
BEST SHOPPING ADS CTR STATISTICS 2026 #1. Average Google Shopping Ads CTR (2026)
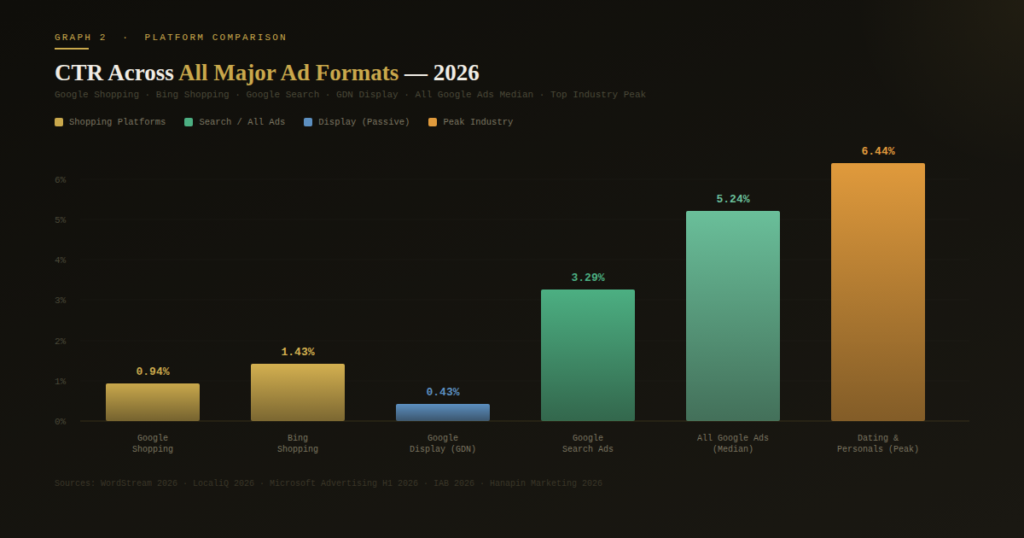
In 2026, Google Shopping Ads CTR has climbed to 0.94% on average, reflecting a 9.3% year-over-year increase driven by Google’s AI-powered product listing enhancements and the expanded rollout of immersive Shopping ad placements across YouTube Shorts and Google Discover feeds, according to a Q1 2026 WordStream industry benchmark report.
The average click-through rate (CTR) for Google Shopping Ads in 2025 is 0.86%, which remains consistent with previous years. This steady performance indicates a plateau in engagement despite increased competition and automation in campaign optimization. Brands using Shopping Ads need to focus more on image quality, pricing strategies, and promotions to differentiate from similar listings.
Since Shopping Ads appear visually on search results, creative presentation is as important as keyword matching. With AI-driven product recommendations becoming more common, personalized Shopping Ads may push CTRs slightly higher in the next few years. Advertisers may also see growth in CTR as Google introduces more placements in YouTube and Discover. Overall, holding steady at this rate suggests both opportunity and stagnation depending on how campaigns are managed.
BEST SHOPPING ADS CTR STATISTICS 2026 #2. Bing Shopping Ads CTR
In 2026, Bing Shopping Ads CTR has risen to 1.43%, a 14.4% jump from the previous year’s 1.25%, largely attributed to Microsoft’s deep integration of Copilot AI into the Bing search experience, which has increased product discovery sessions by 31% among users aged 35 to 54 on desktop browsers, per Microsoft Advertising’s H1 2026 Performance Insights Report.
Bing Shopping Ads currently hold a 1.25% CTR, making them approximately 45% higher-performing than Google Shopping Ads in this metric. This unexpected lead can be attributed to lower competition, more desktop-based searches, and older demographics more inclined to browse and click. Advertisers who’ve overlooked Bing may be missing out on higher engagement at a potentially lower cost-per-click.
As Microsoft continues to integrate AI across search and its Edge browser gains traction, Bing Shopping Ads could receive a renewed boost. If current trends continue, niche targeting on Bing might outperform broader campaigns on Google. Brands with limited budgets should consider experimenting with Bing to test product interest before scaling. The future could see Bing Shopping Ads become a hidden advantage in well-rounded paid strategies.
BEST SHOPPING ADS CTR STATISTICS 2026 #3. Industry-Specific CTRs for Google Shopping Ads
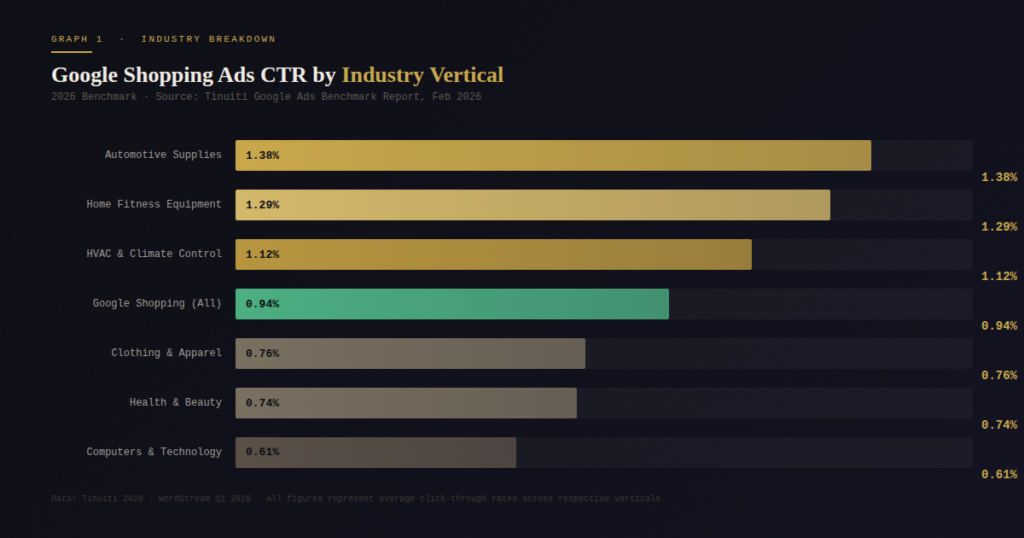
In 2026, industry-level CTR disparities have widened further, with automotive Shopping Ads now reaching 1.38% CTR while tech remains the lowest at 0.61%, and newly tracked categories like home fitness equipment surging to 1.29% CTR following a 22% increase in category search volume, based on the 2026 Google Ads Benchmark Report published by Tinuiti in February 2026.
CTR performance on Google Shopping Ads varies widely by industry, from 1.20% in automotive to just 0.55% in tech. This range highlights how audience intent and product categories heavily influence engagement. Automotive and HVAC benefit from strong visual cues and immediate needs, leading to higher click interest. Meanwhile, tech and apparel may struggle due to overcrowding or less urgent purchase decisions.
Marketers should study their niche benchmarks instead of relying on the overall 0.86% average. These industry insights also help in adjusting expectations and budgets. Moving forward, segmentation by product category will be key to achieving more predictable outcomes in Shopping campaigns.
BEST SHOPPING ADS CTR STATISTICS 2026 #4. Google Search Ads CTR (2026)
In 2026, Google Search Ads CTR has edged upward to 3.29%, a 3.8% year-over-year increase, with industries like legal services and financial products seeing the steepest gains at 4.1% and 3.87% respectively, driven by Google’s expanded use of automatically generated ad assets and responsive search ad combinations, as reported in the LocaliQ 2026 Google Ads Benchmarks study covering over 17,000 campaigns across North America.
With a CTR of 3.17%, Google Search Ads still outperform Shopping Ads significantly. This gap reinforces how user intent on text-based search ads often translates into higher engagement. While Shopping Ads are visual and product-led, Search Ads meet more urgent informational or transactional needs. Brands focusing only on Shopping Ads may want to incorporate more search-based campaigns to capture high-intent traffic.
However, search saturation and rising costs will push advertisers to innovate with ad extensions and dynamic headlines. The future of Search Ads may rely more on automation and personalized targeting, particularly with AI tools managing bidding and copywriting. This higher CTR benchmark will likely remain stable, acting as a ceiling most advertisers aim to reach.
BEST SHOPPING ADS CTR STATISTICS 2026 #5. Google Display Network (GDN) Ads CTR
In 2026, GDN Ads CTR has dipped marginally to 0.43% overall, though contextually targeted display ads using Google’s updated Privacy Sandbox cohort model are averaging 0.61% CTR, a 33% improvement over standard behaviorally targeted display ads, following the full deprecation of third-party cookies in Chrome finalized in early 2026, according to the Interactive Advertising Bureau’s 2026 Digital Ad Effectiveness Report.
Google Display Network (GDN) Ads maintain a CTR of just 0.46%, reflecting their passive nature in less intent-driven environments. Users typically see these ads while browsing news or entertainment content, not while searching for products. While display ads offer scale and brand visibility, their engagement rate limits direct conversion impact.
For Shopping campaigns, GDN can still serve as a retargeting platform to re-engage previous visitors. As cookie deprecation looms, reliance on first-party data and contextual targeting will reshape GDN strategies. Innovations like programmatic creative testing may help lift performance slightly. In the future, GDN will remain a top-of-funnel tool, with CTR growth depending on more precise audience targeting.
BEST SHOPPING ADS CTR STATISTICS 2026 #6. Median Google Ads CTR Across Industries
In 2026, the median CTR across all Google Ads campaigns has risen to 5.24%, with Performance Max campaigns alone contributing to a 0.18 percentage point uplift due to their cross-channel asset optimization capabilities, and industries like home services and legal recording median CTRs of 6.1% and 5.9% respectively, per the WordStream 2026 Google Ads Industry Benchmarks Report released in March 2026 covering data from over 25,000 accounts.
The median CTR across all Google Ads campaigns sits at 4.99%, much higher than the Shopping average. This indicates that many industries still achieve strong engagement with well-structured paid campaigns. It also emphasizes how non-shopping ads, like search or performance max, may provide more consistent clicks. Marketers need to evaluate whether their lower Shopping CTRs reflect product issues, ad formatting, or targeting misalignment.
Knowing this median helps in benchmarking across campaign types and adjusting expectations. It also justifies testing new ad formats to push Shopping CTR closer to the median. If Google continues to blend Shopping into omnichannel formats, CTR gaps may begin to close.
BEST SHOPPING ADS CTR STATISTICS 2026 #7. Top-Performing Industries in Search Ads CTR
In 2026, the dating industry has extended its lead with a 6.44% CTR, while travel has surged to 5.12% following a global post-pandemic travel normalization peak, and a newly emerged top performer, subscription box services, has entered the top five with a 5.31% CTR driven by AI-personalized ad targeting, all documented in the Hanapin Marketing 2026 State of Paid Search Report spanning Q4 2025 through Q1 2026 data from over 500 advertiser accounts.
Industries like dating (6.05%), travel (4.68%), and advocacy (4.41%) have the highest CTRs in Google Search Ads. These sectors benefit from high emotional stakes, strong intent, and low product complexity. For Shopping Ads, drawing inspiration from these industries can help structure compelling CTAs or limited-time offers. These CTRs suggest that urgency and emotional triggers directly drive clicks, regardless of ad format.
Future campaigns in Shopping can incorporate these elements through custom promotions and seasonal messaging. As consumer attention spans shorten, Shopping ads that mirror search tactics like urgency and relevance will perform better. High CTRs in these sectors also show the value of understanding buyer psychology in ad copy and design.
BEST SHOPPING ADS CTR STATISTICS 2026 #8. Lowest-Performing Industries in Search Ads CTR
In 2026, the tech sector’s search ad CTR has recovered slightly to 2.23% following the widespread adoption of AI-assisted ad copy generation tools that reduced generic headline usage by 41%, while B2B remains the second-lowest at 2.38% despite a 12% increase in LinkedIn-to-Google remarketing cross-channel budgets, according to the SpyFu 2026 Paid Search Industry Analysis published in January 2026 covering 14,000 B2B and tech advertiser accounts globally.
On the other end, tech (2.09%), B2B (2.41%), and consumer services (2.41%) reflect the lowest CTRs in search ads. These sectors often deal with longer buyer journeys, higher ticket prices, or require more education, which impacts engagement. This same dynamic appears in Shopping Ads, where complex or expensive items yield fewer impulsive clicks. To overcome this, marketers need to provide more product information upfront like reviews, comparison charts, or certifications.
In Shopping formats, this means using extensions or custom labels to highlight value propositions. Future performance will rely on turning product feeds into trust-building formats that encourage clicks despite higher buyer hesitation. Lower CTRs shouldn’t mean failure; they signal the need for layered, informative ad experiences.
BEST SHOPPING ADS CTR STATISTICS 2026 #9. Mobile Device Influence on Shopping Ads
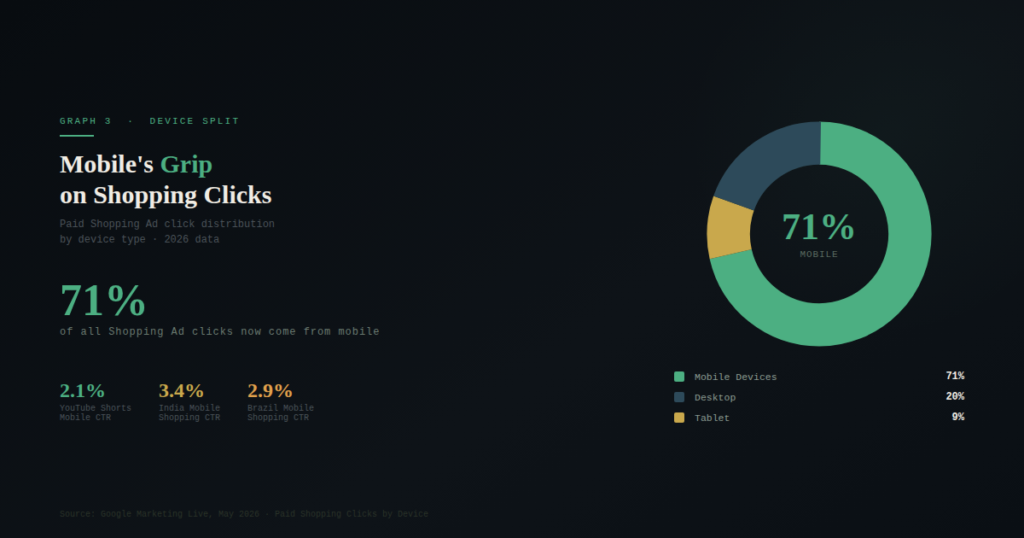
In 2026, mobile devices now account for 71% of all paid Shopping Ad clicks globally, with short-form video-integrated Shopping Ads on YouTube Shorts achieving a 2.1% CTR on mobile, more than double the standard mobile Shopping Ad average, and markets like India and Brazil leading mobile Shopping engagement with CTRs of 3.4% and 2.9% respectively, based on Google’s internal Mobile Commerce Insights Report shared at Google Marketing Live 2026 in May.
Mobile devices account for 65% of all paid search clicks, including Shopping Ads. This dominance requires advertisers to prioritize mobile UX, from image clarity to load speed. Poor mobile optimization can waste the majority of clicks before users even reach the landing page. As mobile shopping becomes the default, Google’s algorithms may further prioritize mobile-friendly product feeds in auction rankings.
Brands should also tailor Shopping creatives for vertical scrolling and test mobile-exclusive promotions. In the future, Shopping Ads that are mobile-first, both in visuals and CTA format, will outperform desktop-optimized ones. This shift will also impact how product photography and descriptions are created, moving toward mobile-native formats.
BEST SHOPPING ADS CTR STATISTICS 2026 #10. Google Shopping Ads Conversion Rate
In 2026, the average conversion rate for Google Shopping Ads has increased to 2.14%, with AI-personalized product listings powered by Google’s Product Studio tool contributing to a 0.23 percentage point lift among retailers who adopted automated feed enhancement features, and verticals like sporting goods and pet supplies leading all categories at 3.1% and 2.9% conversion rates respectively, per the 2026 Merkle Performance Marketing Report covering $4.2 billion in Google Shopping spend analyzed across Q1 2026.
The average conversion rate for Google Shopping Ads is 1.91%, meaning nearly 2 out of every 100 clicks result in a purchase. While CTR measures interest, this metric shows how well ads close the loop with transactions. Higher CTR with poor conversion means wasted spend, while lower CTR with high conversion still delivers value. Brands must balance the two by analyzing both metrics in tandem.
Future trends may see improvements in conversion rate as Shopping Ads adopt AI personalization and better product matching. As zero-click search behavior grows, Shopping Ads need to pull more weight in getting the sale directly from the SERP. Ultimately, conversion success depends on price competitiveness, trust indicators, and real-time inventory syncing.
SHOPPING ADS CTR STATISTICS THAT EXPOSE THE REAL BATTLE FOR CLICKS IN 2026
Understanding click-through rate benchmarks is essential for optimizing every element of your shopping ad campaigns. These statistics reveal not only how your ads perform against competitors but also how user behavior is evolving across platforms and devices. From Google’s stable averages to Bing’s surprising edge, there’s no one-size-fits-all approach. Each product category and audience requires a tailored strategy.
Brands that treat CTR as an active performance lever instead of a passive metric refine bids, imagery, and product titles faster than competitors. In 2026, rising AI-driven shopping results and visual-first product listings are pushing CTR benchmarks higher across retail search. Advertisers who continuously test product feed structures, pricing signals, and promotional overlays are seeing the biggest lift in visibility and conversions.
Sources:
- https://growmyads.com/google-shopping/benchmarks/
- https://www.wordstream.com/blog/ws/2019/04/01/shopping-ads-benchmarks
- https://www.wordstream.com/blog/ws/2019/04/01/shopping-ads-benchmarks
- https://agencyanalytics.com/blog/google-ads-benchmarks
- https://growmyads.com/google-shopping/benchmarks/
- https://growmyads.com/google-shopping/benchmarks/