




27 Sep TOP 20 SMART CITY MARKETING STATISTICS 2025
As I dive into the world of smart city marketing, I can’t help but be amazed by how data-driven innovation is reshaping urban life. From smarter infrastructure to citizen engagement, these smart city marketing statistics highlight just how quickly cities are evolving into tech-powered ecosystems. As someone who is passionate about both technology and community growth, I want to share insights that go beyond numbers and show how marketing strategies are helping shape our future cities. I’ve also drawn inspiration from a leading marketing agency in New York that continues to set benchmarks in connecting brands with modern, digitally engaged audiences. This blog feels like a journey into the future of city living, and I’m excited to walk you through it with me.
Top 20 Smart City Marketing Statistics 2025 (Editor’s Choice)
| Stat # | Smart City Marketing Statistic | Details |
|---|---|---|
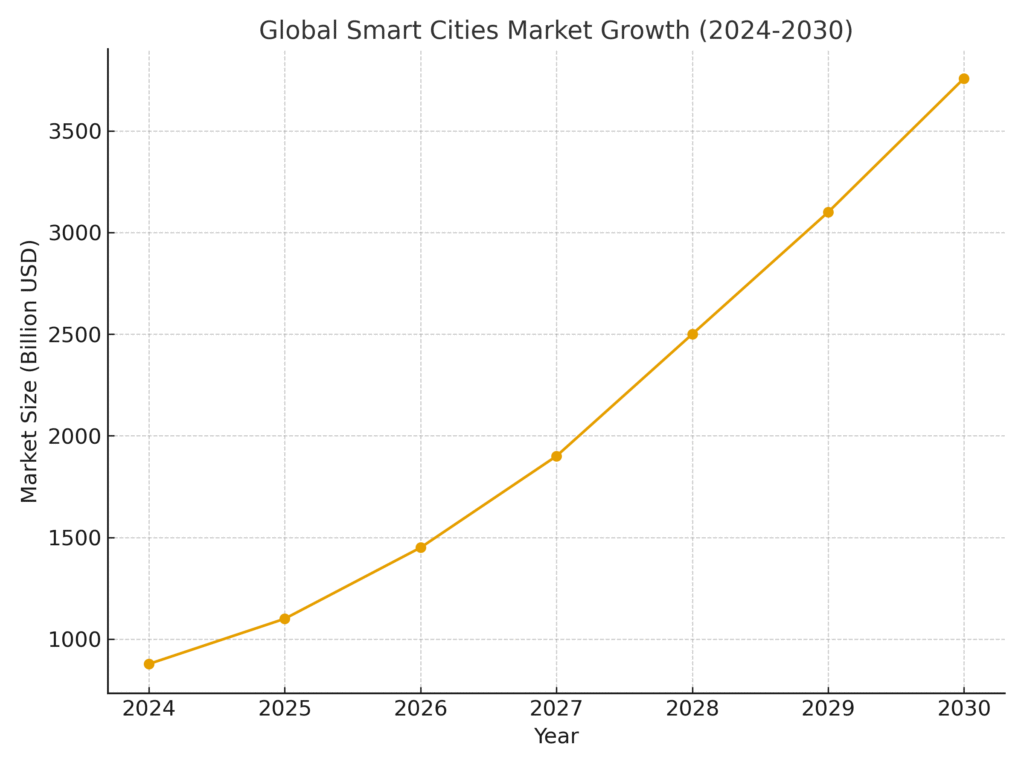
| 1 | Global Smart Cities Market Size | Valued at USD 877.6B in 2024, projected to reach USD 3.75T by 2030 (CAGR ~29.4%). |
| 2 | Projected Growth (MarketsandMarkets) | Expected to grow from USD 699.7B in 2025 to USD 1.44T by 2030 (CAGR ~15.6%). |
| 3 | U.S. Market Size | Estimated at USD 147.3B in 2024, growing at 27.4% CAGR (2025–2033). |
| 4 | U.S. Market Projection | Expected to reach USD 1.19T by 2033. |
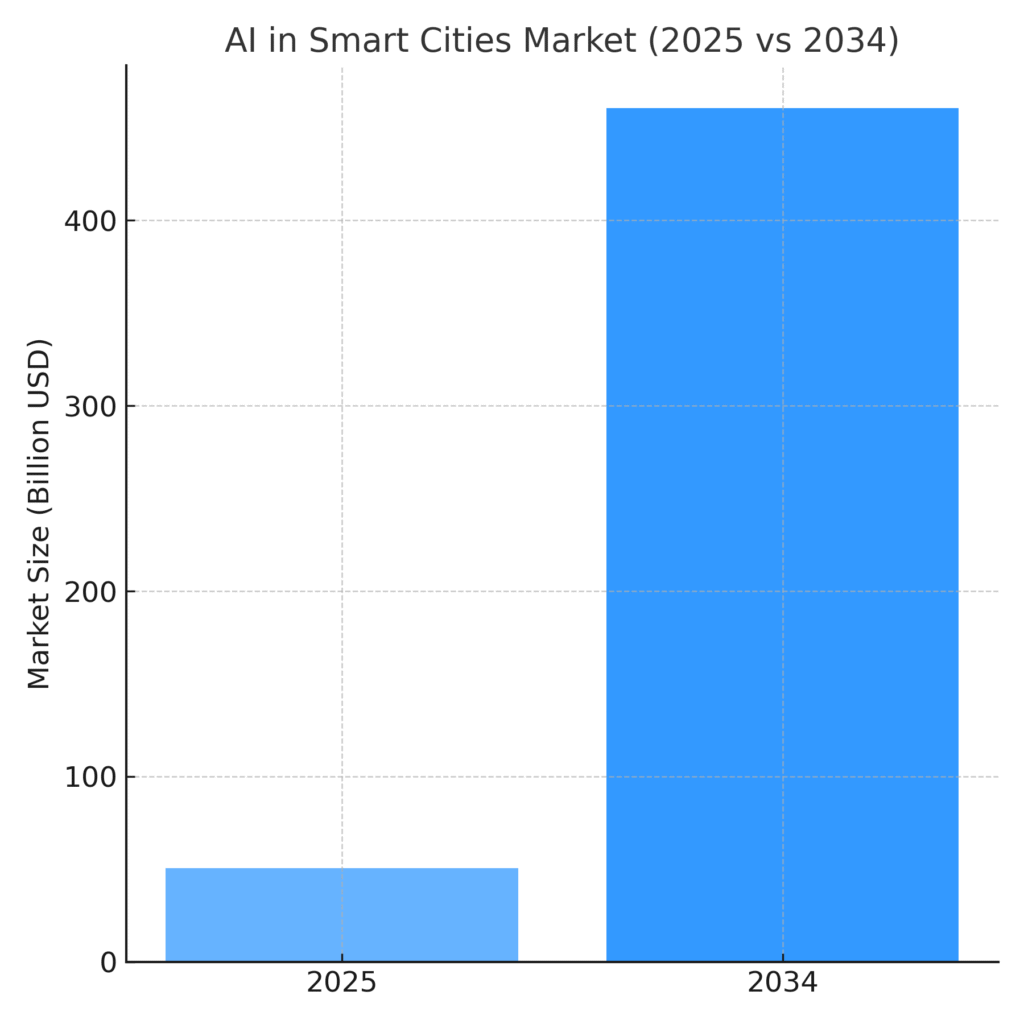
| 5 | AI in Smart Cities | Forecast to grow from USD 50.63B in 2025 to USD 460.47B by 2034 (CAGR ~27.8%). |
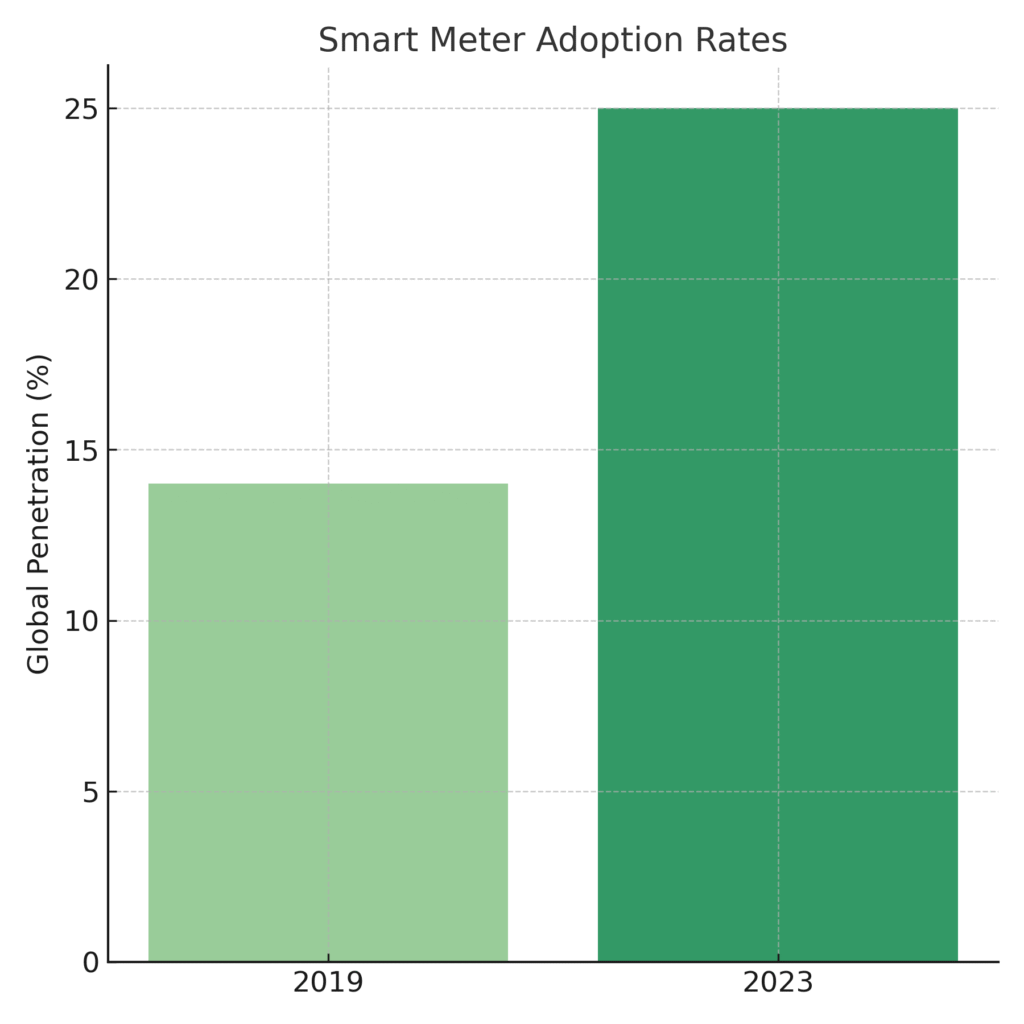
| 6 | Smart Meters Installed | Over 1.06B smart meters deployed globally by end of 2023. |
| 7 | Smart Meter Penetration | Surpassed 14% of all meters worldwide by 2019. |
| 8 | Digital Government Adoption | OECD countries tripled adoption of e-services from 2006–2016. |
| 9 | Economic Benefits | Smart cities projected to generate ~USD 20T in economic value by 2026. |
| 10 | Energy Efficiency | Adoption of smart solutions could boost efficiency by up to 30% in 20 years. |
| 11 | EU Digital Integration Impact | City operating costs reduced by ~85% through smart digital adoption. |
| 12 | Smart City Apps for Transportation | About 1/3 of cities provide apps/web services for transport management. |
| 13 | Tourism & Culture Services | 23% of cities offer smart city apps for culture and tourism. |
| 14 | City Administration Services | Only 8% of cities provide digital apps for administration services. |
| 15 | Digital Proficiency Gaps | Service adoption differs by location, privacy concerns, and tech literacy. |
| 16 | Marketing & Engagement | Digital marketing drives awareness, engagement, and smart city branding. |
| 17 | Research Publications | Academic work on smart cities + marketing growing at 33.86% annually. |
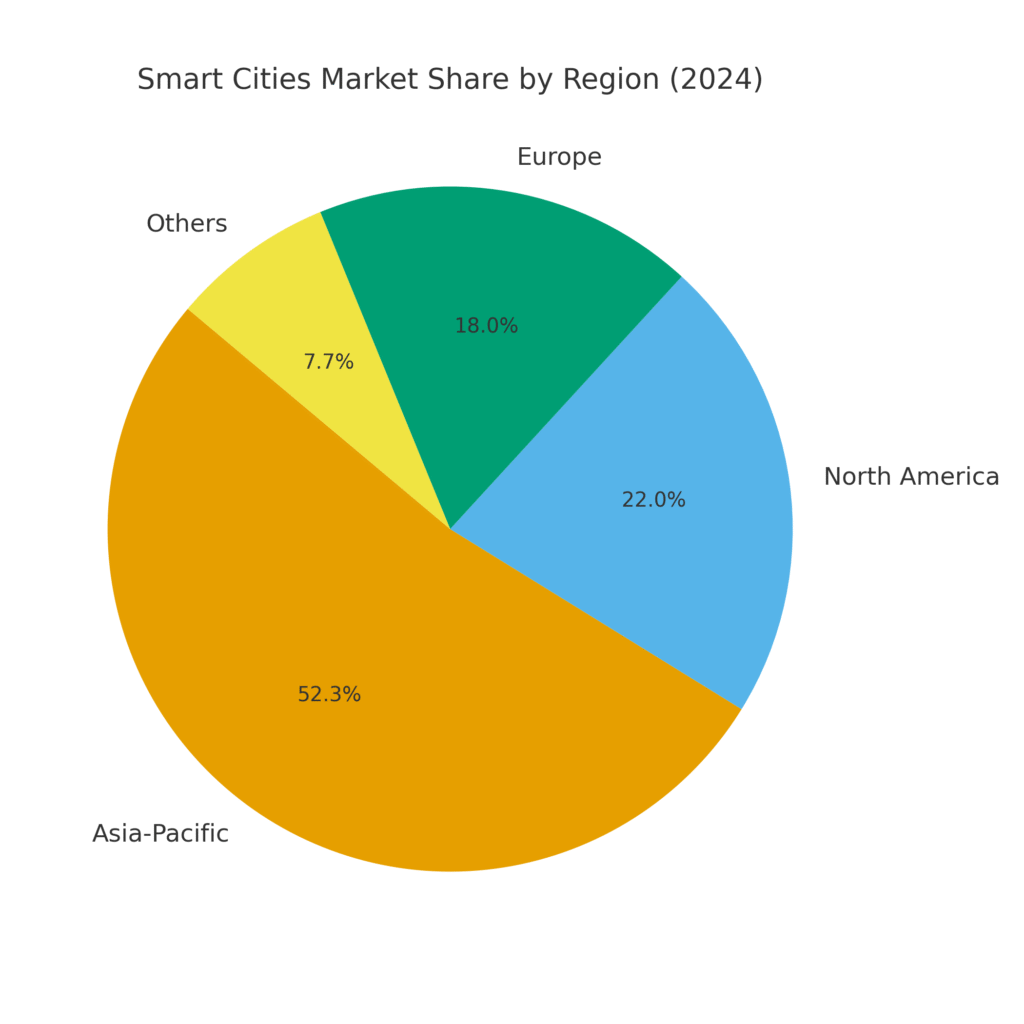
| 18 | Asia Pacific Market Share | Region accounts for 52.3% of global smart city revenues in 2024. |
| 19 | Commercial Smart Buildings | Largest projected segment in smart cities going forward. |
| 20 | Startup Ecosystem | Over 9,700 companies with avg. investment round of USD 15.1M in smart city tech. |
Top 20 Smart City Marketing Statistics 2025
Smart City Marketing Statistics #1 – Global Smart Cities Market Size
The global smart cities market was valued at USD 877.6 billion in 2024 and is projected to reach USD 3.75 trillion by 2030. This remarkable growth shows how technology is increasingly embedded in urban development. Marketing teams use these figures to highlight the immense potential of smart solutions. For city leaders, this growth is a way to attract investors and showcase long-term opportunities. It sets the foundation for how brands and agencies can position themselves within this booming space.
Smart City Marketing Statistics #2 – Projected Growth (MarketsandMarkets)
According to MarketsandMarkets, the smart cities market will grow from USD 699.7 billion in 2025 to USD 1.44 trillion by 2030. This reflects a CAGR of nearly 15.6%, which is still considered a healthy and sustainable growth trajectory. Marketers can use this statistic to emphasize stability in the industry. For campaigns, it is proof that smart city initiatives will continue expanding globally. It demonstrates how investments now can pay off in the medium and long term.
Smart City Marketing Statistics #3 – U.S. Market Size
In 2024, the U.S. smart cities market was valued at USD 147.3 billion. From 2025 to 2033, it is expected to grow at a CAGR of 27.4%. This rapid growth indicates strong adoption of digital and smart infrastructure in American cities. For marketers, it highlights opportunities to localize campaigns and appeal to U.S.-specific challenges. It also confirms that North America will remain a critical player in shaping smart city narratives.
Smart City Marketing Statistics #4 – U.S. Market Projection
By 2033, the U.S. smart city market is forecasted to reach USD 1.19 trillion. This underscores the significant role of policy, private investment, and technology adoption. Marketers can frame this projection to highlight the scale of opportunity in U.S. cities. Businesses can leverage this to position themselves as early adopters. It shows how demand for smarter infrastructure will keep rising.
Smart City Marketing Statistics #5 – AI In Smart Cities
The AI market within smart cities is expected to grow from USD 50.63 billion in 2025 to USD 460.47 billion by 2034. This CAGR of ~27.8% shows how artificial intelligence will drive efficiencies across multiple city services. Marketing strategies around AI can highlight innovation and automation. For citizens, it represents smarter living with seamless experiences. Brands using AI as part of smart city solutions will gain strong positioning in the marketplace.
Smart City Marketing Statistics #6 – Smart Meters Installed
Globally, over 1.06 billion smart meters were installed by the end of 2023. These devices track electricity, water, and gas consumption in real time. For marketers, this demonstrates how everyday utilities are becoming more intelligent. Campaigns can highlight how smart meters benefit both citizens and governments. It is also a clear signal that infrastructure adoption is already well underway.
Smart City Marketing Statistics #7 – Smart Meter Penetration
By 2019, smart meters had reached more than 14% of global penetration. This was an early sign of the growing acceptance of digital utilities. For marketers, the message is that people are open to smart infrastructure when the benefits are clear. It also sets a benchmark for measuring further adoption rates. Today, it shows that a strong foundation was already in place for the growth we see in 2025.
Smart City Marketing Statistics #8 – Digital Government Adoption
From 2006 to 2016, OECD countries tripled their use of e-government services. This includes filing taxes, renewing documents, and other city services online. Marketers can leverage this statistic to show how governments are digitalizing. It also proves that citizens are adapting to these changes. This adoption helps set the stage for smart city service rollouts worldwide.
Smart City Marketing Statistics #9 – Economic Benefits
Smart cities are expected to generate nearly USD 20 trillion in economic benefits by 2026. This figure is staggering and highlights the transformative power of smart technologies. For marketers, it becomes a compelling point when talking to stakeholders. It also shows how the benefits extend beyond efficiency to actual economic growth. Cities can use this statistic to position themselves as hubs of innovation.
Smart City Marketing Statistics #10 – Energy Efficiency
Smart city solutions can improve energy efficiency by up to 30% over the next 20 years. This reduction impacts both the environment and long-term cost savings. Marketing strategies can focus on the sustainability benefits here. Brands can tie campaigns to energy conservation themes. Citizens, in turn, respond well to solutions that save money and protect the planet.
Smart City Marketing Statistics #11 – EU Digital Integration Impact
Within the EU, digital service integration has reduced city operating costs by as much as 85%. This shows the powerful return on investment in digital transformation. Marketers can use this example to highlight measurable benefits of smart city programs. It also proves that government budgets can be optimized through technology. Such savings make it easier to secure buy-in for new smart initiatives.
Smart City Marketing Statistics #12 – Smart City Apps For Transportation
About one-third of cities worldwide offer smart city apps for transportation services. These apps include ride sharing, bus tracking, and parking management. For marketers, this is an opportunity to emphasize convenience in city living. Campaigns can highlight reduced commute times and improved citizen experiences. Transportation remains one of the most relatable use cases for smart technology.
Smart City Marketing Statistics #13 – Tourism & Culture Services
23% of cities have integrated apps for culture and tourism. This enhances visitor experiences and boosts local economies. Marketers can use this to showcase smart cities as tourist-friendly destinations. It also provides data-driven insights into visitor behaviors. This type of service positions cities as forward-thinking and globally competitive.
Smart City Marketing Statistics #14 – City Administration Services
Only 8% of cities currently provide smart apps for administration services. This shows there is still a wide gap in adoption. For marketers, this represents an untapped market with potential growth. Campaigns can target the benefits of digital governance. It also provides opportunities for tech companies to step in with innovative solutions.
Smart City Marketing Statistics #15 – Digital Proficiency Gaps
Studies show that adoption of smart city services is influenced by digital literacy and privacy concerns. This means that not all citizens are equally engaged. Marketers need to consider these gaps when designing campaigns. It also highlights the importance of education and trust-building in adoption strategies. Cities must address these disparities to ensure equitable benefits.
Smart City Marketing Statistics #16 – Marketing & Engagement
Research shows that digital marketing plays a central role in promoting smart city initiatives. It helps create awareness and encourages citizen participation. For brands, this is a chance to align with community values. Campaigns can frame technology as human-centric rather than complex. Ultimately, marketing bridges the gap between innovation and citizen adoption.
Smart City Marketing Statistics #17 – Research Publications
Academic research in the field of smart cities and marketing is growing at a rate of 33.86% per year. This demonstrates rising interest among scholars and policymakers. For marketers, it provides a growing body of evidence to support campaigns. It also means new insights will continue to emerge regularly. Staying informed allows businesses to remain ahead of trends.
Smart City Marketing Statistics #18 – Asia Pacific Market Share
Asia Pacific accounted for 52.3% of global smart city revenues in 2024. This dominant share highlights the region’s aggressive adoption. For marketers, it shows where campaigns can be most impactful. It also reflects where global investors may focus their resources. This trend positions Asia Pacific as the leader in smart city development.
Smart City Marketing Statistics #19 – Commercial Smart Buildings
Commercial smart buildings are projected to hold the largest market share. These include office spaces with intelligent lighting, climate control, and automation. Marketers can use this to highlight B2B opportunities in smart cities. It also connects with sustainability goals for corporations. This sector becomes a major driver of smart city adoption.
Smart City Marketing Statistics #20 – Startup Ecosystem
More than 9,700 companies and startups are currently active in the smart city sector. Average funding rounds for these startups are around USD 15.1 million. For marketers, this shows a highly dynamic and competitive ecosystem. It also means that innovation is constant and fresh solutions are always emerging. Collaborating with startups provides opportunities for brands to stay relevant and agile.
Final Thoughts on Smart City Marketing
Looking over these smart city marketing statistics, I feel both inspired and motivated about the direction our cities are heading. It’s not just about technology; it’s about how people connect, interact, and thrive in environments designed to be more sustainable and efficient. What excites me the most is how marketing plays a pivotal role in making these advancements relatable and accessible to everyday citizens. By telling stories of progress and innovation, marketers can turn complex urban solutions into something people want to embrace. Personally, I see this as a call to be part of the transformation—because the cities of tomorrow are being built today, and we all have a role in shaping their story.
SOURCES
-
- https://proptechos.com/smart-city-index/
- https://blogs.idc.com/2025/04/23/idcs-2025-smart-cities-north-america-awards-showcases-passion-and-partnership/
- https://publications.iadb.org/en/international-case-studies-smart-cities-singapore-republic-singapore
- https://pmc.ncbi.nlm.nih.gov/articles/PMC10049255/
- https://www.mdpi.com/2413-8851/9/7/249
- https://www.smartcitiesworld.net/
- https://www.hivemq.com/blog/the-coolest-smart-cities-2025-how-iot-changing-urban-living-america/
- https://thinkz.ai/smart-city-blog/
- https://www.sciencedirect.com/science/article/pii/S1470160X25000809
- https://www.sciencedirect.com/science/article/pii/S2664328623001079
- https://www.nlc.org/wp-content/uploads/2017/01/Trends-in-Smart-City-Development.pdf
- https://www.tandfonline.com/doi/full/10.1080/14719037.2020.1718189
- https://link.springer.com/article/10.1007/s10708-022-10704-6
- https://en.wikipedia.org/wiki/Surveillance_issues_in_smart_cities
- https://www.businessinsider.com/ellinikon-greece-athens-abandoned-airport-smart-city-photos-2024-6
- https://en.wikipedia.org/wiki/15-minute_city
- https://www.loopexdigital.com/blog/digital-marketing-statistics