




28 Sep TOP 20 SMART PAYMENT MARKETING STATISTICS 2025
As someone deeply fascinated by how technology reshapes our everyday experiences, I’ve been paying close attention to the rise of smart payment marketing statistics. From digital wallets to real-time payments, the data shows just how much our shopping behaviors are changing, and how quickly businesses are adapting. What excites me most is how these insights can guide companies toward creating seamless, customer-first payment journeys. That’s why I wanted to explore these numbers and share what they mean for both consumers and brands, drawing inspiration from the expertise of a leading marketing agency in New York.
Top 20 Smart Payment Marketing Statistics 2025 (Editor’s Choice)
| # | Smart Payment Marketing Statistics 2025 |
|---|---|
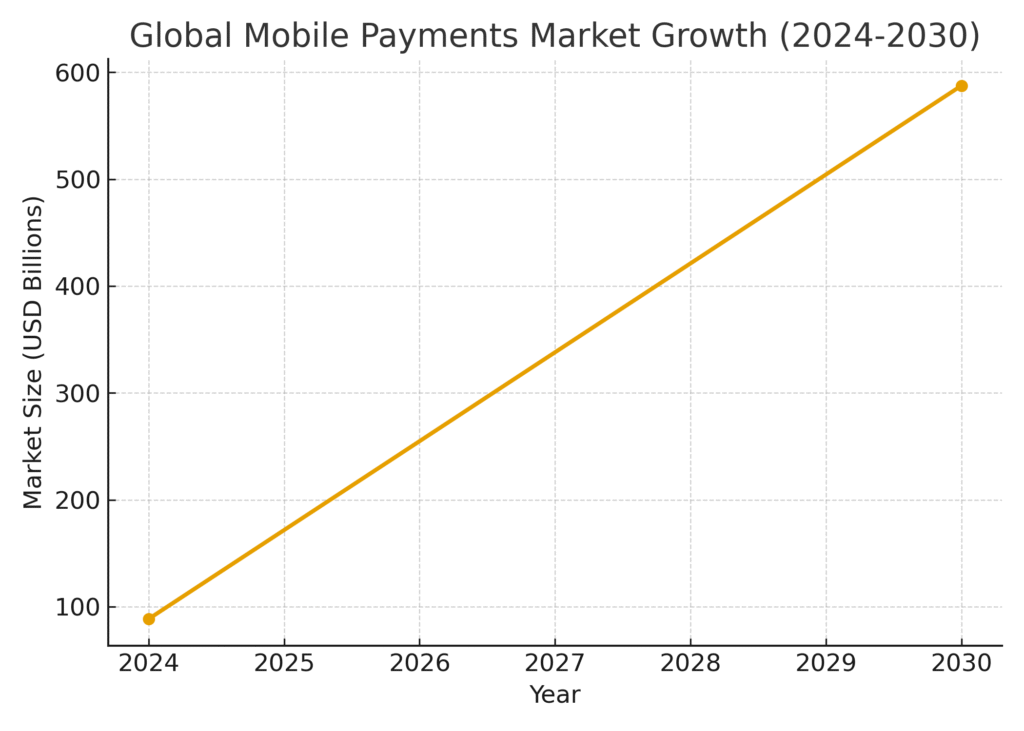
| 1 | The global mobile payments market was valued at USD 88.50 billion in 2024 and is projected to reach USD 587.52 billion by 2030. |
| 2 | The global digital payments market size was USD 114.41 billion in 2024 and is expected to grow to USD 361.30 billion by 2030. |
| 3 | The global smart payment systems market will reach USD 42,064.3 million in 2025 and USD 94,807.4 million by 2032 (CAGR 12.3%). |
| 4 | The smart payment terminals market was USD 53.83 billion in 2023, expected to grow at 12.5% CAGR through 2032. |
| 5 | Real-time payments are forecasted to grow at 35.4% CAGR from 2025 to 2032, hitting USD 284.49 billion. |
| 6 | The smart home payments market will rise from USD 86.16 billion in 2025 to USD 384.61 billion by 2033 (CAGR 20.57%). |
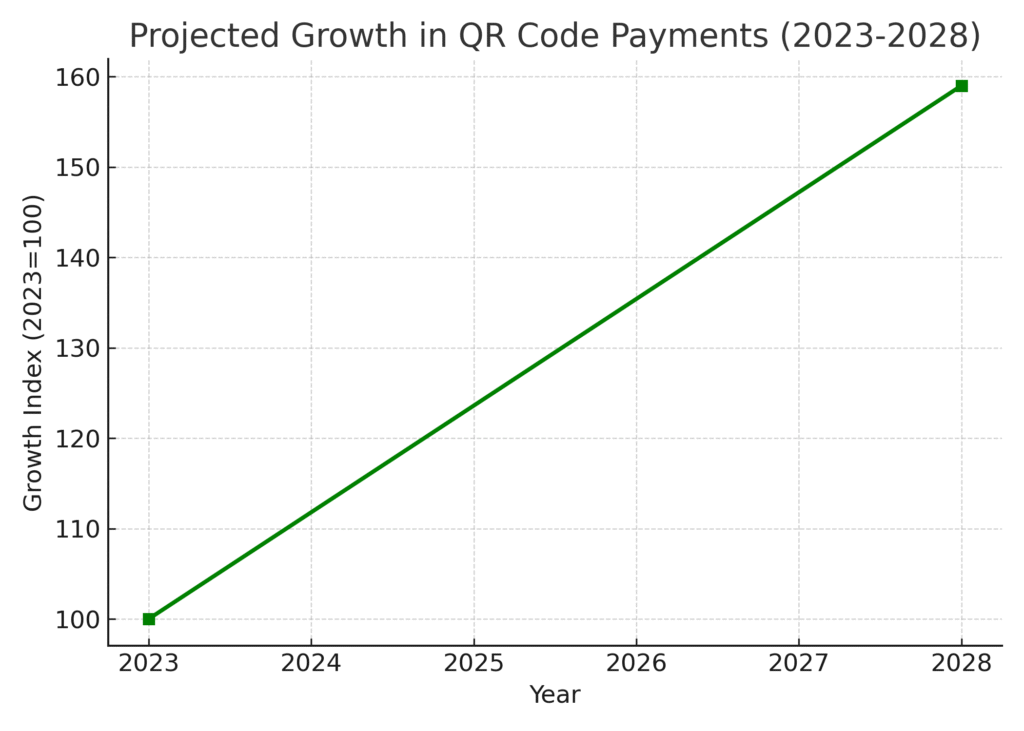
| 7 | QR code payments are expected to grow by nearly 59% between 2023 and 2028 globally. |
| 8 | Nearly 90% of North Americans use digital payments, with Gen Z and Millennials leading adoption. |
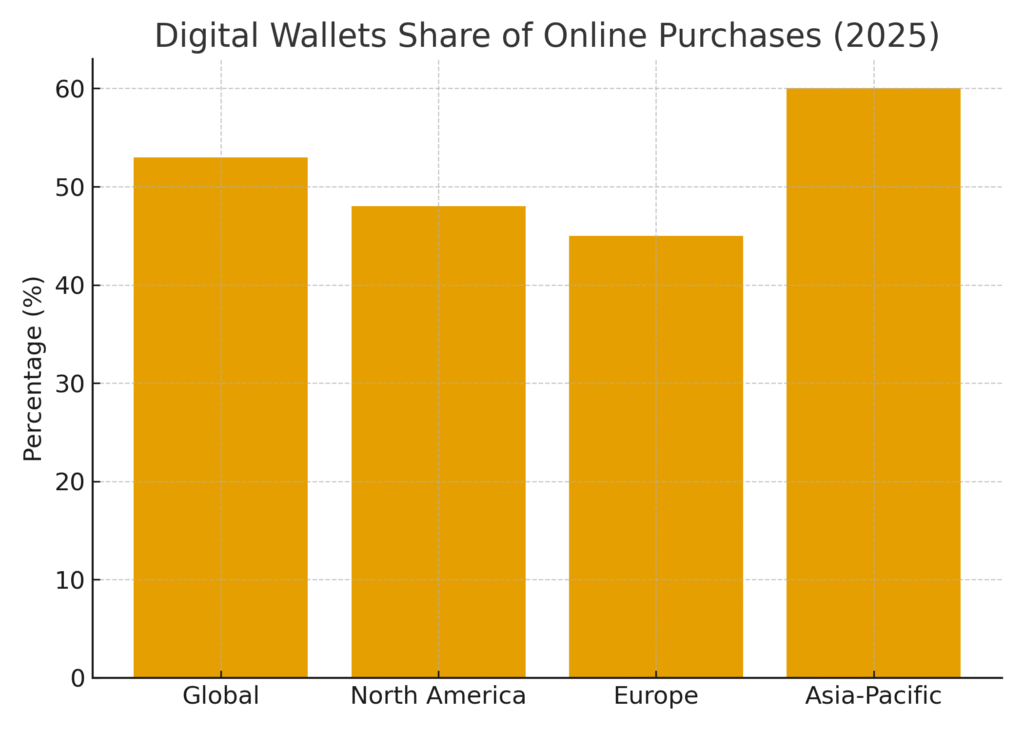
| 9 | Digital wallets already account for around 53% of online purchases worldwide. |
| 10 | 34% of UK consumers made mobile contactless payments monthly in 2023. |
| 11 | India’s UPI processes ~20 billion transactions monthly, equating to ~7,500 per second. |
| 12 | WeChat Pay and Alipay dominate China’s market with over 90% combined share. |
| 13 | 80% of Americans consider mobile payment options important when choosing retailers. |
| 14 | BNPL adoption in the U.S. grew 40% in two years, with 80% of Cyber Monday BNPL purchases via mobile. |
| 15 | Factors driving adoption: security, convenience, and seamless experiences. |
| 16 | Asia-Pacific holds over 45% market share in mobile payments and is the fastest-growing region. |
| 17 | Internet-based payments are expected to capture ~41.9% of the smart payment systems market by 2025. |
| 18 | Retail is the largest end-use sector, accounting for ~33.3% of smart payment usage. |
| 19 | Consumers abandon carts if their preferred smart payment option is unavailable. |
| 20 | Frictionless payments improve conversion rates, lower cart abandonment, and increase ROI. |
Top 20 Smart Payment Marketing Statistics 2025
Smart Payment Marketing Statistics #1: Mobile Payments Market Reaches $587.52 Billion By 2030
The global mobile payments market was valued at USD 88.50 billion in 2024 and is projected to soar to USD 587.52 billion by 2030. This rapid growth reflects consumers’ preference for convenient, on-the-go payment methods. Businesses adopting mobile payments are likely to see higher engagement from younger, tech-savvy customers. For marketers, this creates an opportunity to emphasize fast and secure checkout experiences in campaigns. Highlighting mobile payment options has become a differentiator in winning customer trust.
Smart Payment Marketing Statistics #2: Digital Payments Market Expands To $361.30 Billion By 2030
The digital payments market, worth USD 114.41 billion in 2024, is forecasted to more than triple by 2030. This growth is fueled by e-commerce, fintech innovations, and increased smartphone adoption. Marketers can leverage this trend by tailoring campaigns around digital convenience and security. Offering multiple digital payment methods can also reduce cart abandonment. As consumers grow more reliant on digital options, businesses that adapt will have a competitive advantage.
Smart Payment Marketing Statistics #3: Smart Payment Systems Market Hits $94.80 Billion By 2032
The global smart payment systems market is projected to reach USD 42,064.3 million in 2025 and nearly USD 94,807.4 million by 2032. This expansion highlights the adoption of advanced payment technologies like biometrics and AI-driven verification. Consumers value seamlessness and safety, making smart systems integral to modern commerce. Marketing strategies that emphasize innovation and reliability in payment options resonate strongly with today’s buyers. Smart payment systems will play a central role in shaping customer loyalty.
Smart Payment Marketing Statistics #4: Smart Payment Terminals Market Grows At 12.5% CAGR
The smart payment terminals market, valued at USD 53.83 billion in 2023, is expected to maintain a CAGR of over 12.5% until 2032. Retailers are upgrading point-of-sale devices to improve checkout speed and flexibility. For marketers, showcasing modernized POS experiences can be used as a branding advantage. Smart terminals also enable businesses to collect data that can inform personalized campaigns. As terminals become smarter, they enhance both convenience and marketing insights.
Smart Payment Marketing Statistics #5: Real-Time Payments Market Reaches $284.49 Billion By 2032
Real-time payments are projected to hit USD 284.49 billion by 2032, growing at an annual rate of 35.4%. The ability to transfer money instantly appeals to both businesses and consumers. Marketers can highlight the speed and transparency of real-time payments to build trust. This trend also opens opportunities in B2B marketing, where efficiency is highly valued. Companies offering real-time solutions can position themselves as forward-thinking leaders.

Smart Payment Marketing Statistics #6: Smart Home Payments Market Expands To $384.61 Billion By 2033
The smart home payments market will grow from USD 86.16 billion in 2025 to USD 384.61 billion by 2033. With devices like smart speakers and appliances facilitating payments, everyday transactions are becoming easier. Marketers can tap into this by promoting convenience and futuristic shopping experiences. Smart home integrations also encourage repeat purchases due to effortless re-ordering. Highlighting compatibility with smart devices boosts consumer confidence and adoption.
Smart Payment Marketing Statistics #7: QR Code Payments Grow 59% By 2028
QR code payments are expected to grow by nearly 59% between 2023 and 2028 worldwide. This reflects the rise of contactless and cashless societies. For marketers, QR payments represent a low-cost and easy-to-adopt solution. They also enable creative campaigns, such as QR-based promotions or loyalty rewards. Businesses embracing QR codes can engage consumers with interactive and frictionless payment experiences.
Smart Payment Marketing Statistics #8: 90% Of North Americans Use Digital Payments
Nearly 90% of North Americans have adopted digital payments, with Millennials and Gen Z leading the charge. Younger generations are setting the tone for future financial habits. Marketers should focus on digital-first strategies to appeal to this audience. Highlighting secure and modern payment options can resonate strongly with these groups. Brands that ignore this shift risk being perceived as outdated.
Smart Payment Marketing Statistics #9: Digital Wallets Account For 53% Of Online Purchases
Digital wallets now account for around 53% of online purchases worldwide. Consumers prefer wallets for their ease, speed, and security. Marketers can emphasize wallet options to reduce checkout friction. Wallet usage also provides opportunities for loyalty integration and personalized offers. As their dominance grows, wallets are becoming the centerpiece of e-commerce marketing strategies.
Smart Payment Marketing Statistics #10: 34% Of UK Consumers Use Mobile Contactless Monthly
In 2023, 34% of UK consumers made at least one mobile contactless payment per month. This indicates a widespread shift from traditional cards and cash. Marketers can highlight mobile contactless features in campaigns to attract tech-oriented shoppers. Retailers that don’t adopt these options risk losing customers seeking faster experiences. Promoting mobile contactless adoption can build a progressive brand image.
Smart Payment Marketing Statistics #11: India’s UPI Processes 20 Billion Transactions Monthly
India’s Unified Payments Interface (UPI) handles approximately 20 billion transactions each month. That equates to over 7,500 transactions per second, showcasing massive scalability. For marketers, UPI’s success illustrates how simplicity drives adoption. Campaigns that highlight ease of use and wide acceptance can increase trust. UPI also serves as a benchmark for how other markets may evolve.
Smart Payment Marketing Statistics #12: WeChat Pay And Alipay Hold 90% Market Share In China
WeChat Pay and Alipay together dominate China’s mobile payments, controlling over 90% of the market. This duopoly has shaped how consumers expect to pay in everyday life. Marketers targeting Chinese consumers must integrate with these platforms to remain relevant. The ecosystem also allows brands to run promotions directly tied to payments. Ignoring these payment giants would significantly limit market reach.
Smart Payment Marketing Statistics #13: 80% Of Americans Value Mobile Payment Options
A McKinsey survey revealed that 80% of Americans prioritize mobile payment options when selecting retailers. Convenience has become as important as price and product. For marketers, highlighting mobile payment support can directly influence consumer choice. Offering limited payment methods could lead to missed sales opportunities. In campaigns, stressing convenience and flexibility can strongly resonate with U.S. shoppers.
Smart Payment Marketing Statistics #14: BNPL Usage Grows 40% In Two Years
Buy Now, Pay Later (BNPL) usage in the U.S. grew 40% between 2021 and 2023. Around 80% of BNPL purchases during Cyber Monday 2024 were completed on mobile devices. This shows BNPL’s appeal to mobile-first shoppers seeking flexibility. Marketers can highlight BNPL to attract budget-conscious consumers. Integrating BNPL in checkout marketing can boost conversion rates.
Smart Payment Marketing Statistics #15: Key Adoption Drivers Are Security And Convenience
Security, seamlessness, and convenience are the top drivers of smart payment adoption. Consumers are more likely to try new technologies if they feel protected. Marketers should emphasize strong security features in messaging. At the same time, showcasing ease of use helps overcome hesitation. Building campaigns around trust and convenience makes adoption faster.
Smart Payment Marketing Statistics #16: Asia-Pacific Leads With 45% Market Share
Asia-Pacific holds over 45% of the global mobile payments market. This dominance is fueled by high smartphone penetration and strong fintech ecosystems. Marketers targeting this region must prioritize mobile-first payment strategies. Highlighting localized payment systems like UPI or Alipay can drive relevance. Asia-Pacific’s leadership signals future global payment trends.
Smart Payment Marketing Statistics #17: Internet-Based Payments Hold 41.9% Share In 2025
By 2025, internet-based payments are expected to capture 41.9% of the smart payments market. Online transactions remain the backbone of digital commerce. Marketers can position internet payments as secure, fast, and versatile. Campaigns emphasizing easy checkout online can increase sales. This dominance underscores the continued rise of e-commerce payments.
Smart Payment Marketing Statistics #18: Retail Holds 33.3% Share In Smart Payment Usage
Retail accounts for approximately 33.3% of smart payment adoption. Consumers expect flexible and fast options in retail settings. Marketers can use retail adoption stories in campaigns to build trust. Highlighting compatibility with both physical and digital retail channels is key. Retail remains a proving ground for smart payment strategies.
Smart Payment Marketing Statistics #19: Consumers Abandon Carts Without Preferred Payment
Many consumers abandon their carts if their preferred payment method is unavailable. This highlights the importance of offering multiple options. Marketers should ensure campaigns emphasize inclusivity of various payment types. Cart abandonment can directly harm conversion and sales. Brands that meet consumer preferences will see improved loyalty and revenue.
Smart Payment Marketing Statistics #20: Frictionless Payments Boost ROI And Conversions
Frictionless payments are proven to improve conversion rates and reduce cart abandonment. Smooth checkouts directly impact customer satisfaction. Marketers can position frictionless payments as a competitive advantage. Highlighting “one-click” or “instant pay” features can boost brand appeal. Ultimately, payment ease translates to higher ROI in marketing campaigns.
Why Smart Payment Marketing Matters More Than Ever
Looking at these smart payment marketing statistics, it’s clear that payments are no longer just about transactions—they’re about building trust, convenience, and lasting customer relationships. For me, the biggest takeaway is that businesses who embrace innovation in payment methods position themselves as forward-thinking and customer-centric. Whether it’s enabling one-tap checkouts, offering flexible payment plans, or leveraging data for personalization, each step creates an edge in an increasingly competitive market. As consumers, we want simplicity; as marketers, we need strategies that deliver exactly that. I truly believe this evolving payment landscape will define the next wave of brand loyalty and growth.
SOURCES
- https://worldline.com/en-us/home/main-navigation/resources/blogs/10-key-payment-trends-shaping-the-market-in-2025-and-why-they-matter-for-software-providers (Worldline)
- https://www.coherentmarketinsights.com/industry-reports/smart-payment-systems-market (Coherent Market Insights)
- https://gr4vy.com/posts/112-payment-industry-statistics-for-2025-trends-costs-methods-and-more/ (GR4VY)
- https://www.nmi.com/blog/nmi-survey-what-consumers-want-from-payments-in-2025/ (NMI)
- https://financialit.net/blog/paymenttrends-futureofpayment/five-payment-trends-expect-2025 (Financial IT)
- https://ipaysmart.ai/payment-trends-that-continue-to-Evolve (ipaysmart.ai)
- https://www.marketingdive.com/news/digital-marketing-statistics-2025-h1-by-the-numbers/751401/ (Marketing Dive)
- https://www.hubspot.com/marketing-statistics (HubSpot)
- https://www.salesforce.com/marketing/marketing-statistics/ (Salesforce)
- https://en.wikipedia.org/wiki/Unified_Payments_Interface (Wikipedia)
- https://en.wikipedia.org/wiki/Buy_now%2C_pay_later (Wikipedia)
- https://www.coherentmarketinsights.com/industry-reports/smart-payment-systems-market (Coherent Market Insights)
- https://www.coherentmarketinsights.com/industry-reports/smart-payment-systems-market?utm_source=search (Coherent Market Insights)
- https://gr4vy.com/posts/112-payment-industry-statistics-for-2025-trends-costs-methods-and-more/?utm_source=web (GR4VY)
- https://ipaysmart.ai/payment-trends-that-continue-to-Evolve?utm_campaign=2025trends (ipaysmart.ai)
- https://financialit.net/blog/paymenttrends-futureofpayment/five-payment-trends-expect-2025?ref=blog (Financial IT)
- https://www.nmi.com/blog/nmi-survey-what-consumers-want-from-payments-in-2025/?source=blog (NMI)
- https://worldline.com/en-us/home/main-navigation/resources/blogs/10-key-payment-trends-shaping-the-market-in-2025-and-why-they-matter-for-software-providers?lang=en (Worldline)