




27 Sep TOP 20 SOLAR DELIVERY MARKETING STATISTICS 2025
When I started researching solar delivery marketing statistics, I quickly realized how powerful this industry is becoming and how important it is for businesses to understand the trends driving growth. From acquisition costs to referral performance, these insights reveal how companies are adapting to capture a fast-expanding audience. As someone who collaborates closely with the leading marketing agency in New York, I’ve seen firsthand how the right strategy can reduce costs and boost conversions in the solar space. I want to share these numbers not only as stats but also as stories that highlight the opportunities ahead. Personally, I believe this data is more than just figures—it’s a map of where solar delivery is headed in 2025 and beyond.
Top 20 Solar Delivery Marketing Statistics 2025 (Editor’s Choice)
☀️ Top 20 Solar Marketing Statistics 2025
Key Insights for Solar Industry Marketing & Growth
| # | Category | Statistic |
|---|---|---|
| 1 | Market Growth | The US solar industry installed 18 GW of new capacity in the first half of 2025, with solar and storage accounting for 82% of all new power added to the grid |
| 2 | Market Growth | The global residential solar PV market was valued at $94.2 billion in 2024 and is projected to reach $198.9 billion by 2034, growing at a CAGR of 7.9% |
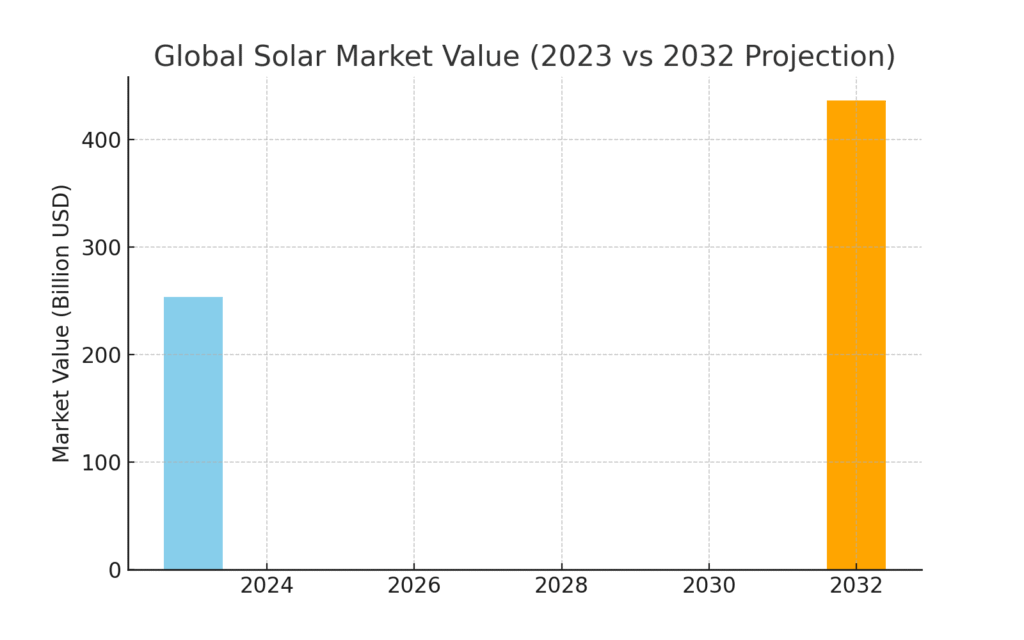
| 3 | Market Growth | The global solar power market size was valued at $253.69 billion in 2023 and is projected to reach $436.36 billion by 2032, exhibiting a CAGR of 6% |
| 4 | Market Growth | Texas installed the most solar capacity in the first half of 2025 (3.8 GWdc), followed by California, Indiana, and Arizona |
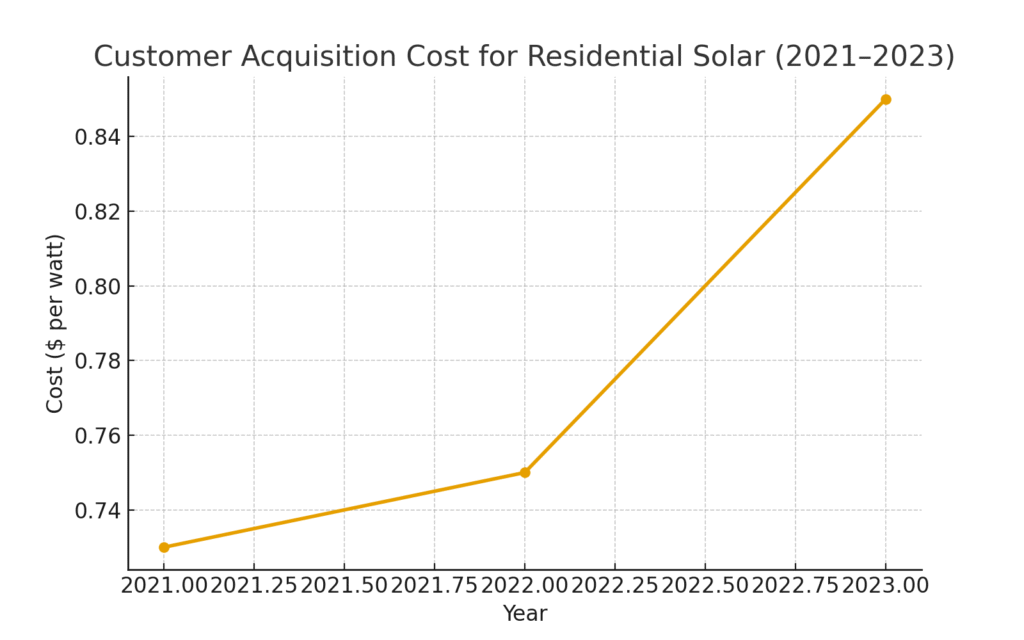
| 5 | Customer Acquisition | At $0.81/W, customer acquisition costs are the highest cost category in the residential solar system cost stack, ahead of $0.49/W for modules |
| 6 | Customer Acquisition | Solar customer acquisition costs can be as high as $3,000 or more per customer, compared to retail averaging about $10 and software at $400 |
| 7 | Customer Acquisition | Customer acquisition costs jumped almost $0.15/W from H2 2022 to H1 2023 due to high interest rates and consumer hesitancy |
| 8 | Customer Acquisition | Sunrun decreased their customer acquisition costs by 23% year-over-year in Q2 2023 by increasing their sales and marketing budget by an average of 6% per quarter |
| 9 | Residential Solar | Over 1.1 GW of residential solar were installed in Q1 2025, a 4% decline compared to Q4 2024 and a 13% year-over-year drop |
| 10 | Residential Solar | Over 28% of all new residential solar capacity was paired with storage in 2024, compared to under 12% in 2023 |
| 11 | Residential Solar | An average-sized residential system has dropped from a pre-incentive price of $40,000 in 2010 to roughly $26,880 |
| 12 | Residential Solar | The residential solar market experienced a 31% year-over-year decline in 2024, with 4.7 GWdc of installed capacity - the lowest year since 2021 |
| 13 | Market Dynamics | 38% of all solar companies expect to grow in 2025, and an additional 35% think they will maintain the same level of business |
| 14 | Market Dynamics | 28% of companies say they have expanded into low-income areas as a result of the Inflation Reduction Act, and another 28% expect to in 2025 |
| 15 | Market Dynamics | States that voted for Donald Trump accounted for nearly 75% of all solar installations in Q1 |
| 16 | Industry Challenges | 33% of installers reported permitting and interconnection rules and costs as the top barrier to success |
| 17 | Industry Challenges | Residential installations will decrease slightly in 2025, following a 30% market contraction in 2024, as high interest rates and other market headwinds impact consumer demand |
| 18 | Industry Challenges | Residential system pricing is down 4% year-over-year, while commercial system pricing is down 12% year-over-year |
| 19 | Marketing Efficiency | Gen AI integration in marketing is creating personalized offers and quotes, as well as initial system designs, which can accelerate the bidding process and reduce customer acquisition costs |
| 20 | Marketing Efficiency | An accepted target ratio of Lifetime Value (LTV) to Customer Acquisition Cost is 3:1, with a reasonable time period of 25 years equivalent to most warranty periods in solar |
Top 20 Solar Delivery Marketing Statistics 2025
Solar Delivery Marketing Statistics #1: Customer Acquisition Cost At $0.85 Per Watt
The U.S. residential solar sector reported customer acquisition costs (CAC) averaging $0.85 per watt in 2023. This represented a 13% year-over-year increase, highlighting ongoing challenges in lowering marketing expenses. CAC remains one of the most difficult metrics for solar firms to optimize. While marketing innovation helps, much of the cost is tied to competitive lead generation. For delivery-focused solar companies, this means prioritizing efficiency in customer outreach.
Solar Delivery Marketing Statistics #2: $10,000 Average CAC Per Sale
Studies estimate that residential solar firms spend about $10,000 per customer acquisition. This includes marketing, lead management, and sales conversion expenses. For delivery companies, this highlights the importance of cost-effective marketing channels like referrals and digital campaigns. The figure can be daunting, but it underscores the value of long-term customer relationships. The key takeaway is that high upfront costs can be balanced by decades of service value.
Solar Delivery Marketing Statistics #3: CAC Is 25% Of Installation Costs
Customer acquisition makes up nearly 25% of the total installation cost for residential solar. That means one-quarter of the price a homeowner pays is directly tied to sales and marketing. For solar delivery businesses, this statistic underscores how marketing efficiency impacts overall pricing. Companies with leaner acquisition systems can pass savings on to customers. Ultimately, reducing CAC is one of the fastest ways to improve competitiveness.
Solar Delivery Marketing Statistics #4: 3,238 Referral Link Shares Annually
On average, solar providers generate 3,238 referral link shares in a single year. These links serve as powerful trust signals since they come from satisfied customers. Word-of-mouth referrals in the solar sector often outperform cold leads. For delivery businesses, investing in referral platforms can amplify reach at minimal cost. It shows that empowering customers to share their experience drives organic growth.
Solar Delivery Marketing Statistics #5: $271,717 Revenue From Referrals
Referral marketing campaigns generate about $271,717 in annual revenue for solar companies. This figure reflects the tangible return from leveraging customer advocacy. Delivery businesses can use referral revenue to offset marketing expenses. The ROI highlights the importance of keeping existing customers engaged and incentivized. It’s a strategy that scales naturally as satisfied clients spread the word.
Solar Delivery Marketing Statistics #6: Referrals Provide 10× ROI In Year One
Solar providers report up to 10× ROI from referral programs in just the first year. This level of return is rarely matched by other marketing channels. For delivery-based companies, referrals bring both trust and efficiency. Incentive-driven programs help customers feel valued while also reducing CAC. It proves that referral marketing is more than just a bonus—it’s a critical driver of profitability.
Solar Delivery Marketing Statistics #7: $253.69 Billion Global Market Value
The global solar market was valued at $253.69 billion in 2023. Projections suggest it will grow to $436.36 billion by 2032. Delivery-focused businesses stand to benefit as adoption continues accelerating. This figure highlights both the massive opportunity and increasing competition. To succeed, companies must combine smart delivery logistics with data-driven marketing strategies.
Solar Delivery Marketing Statistics #8: $206 Average Cost Per Lead
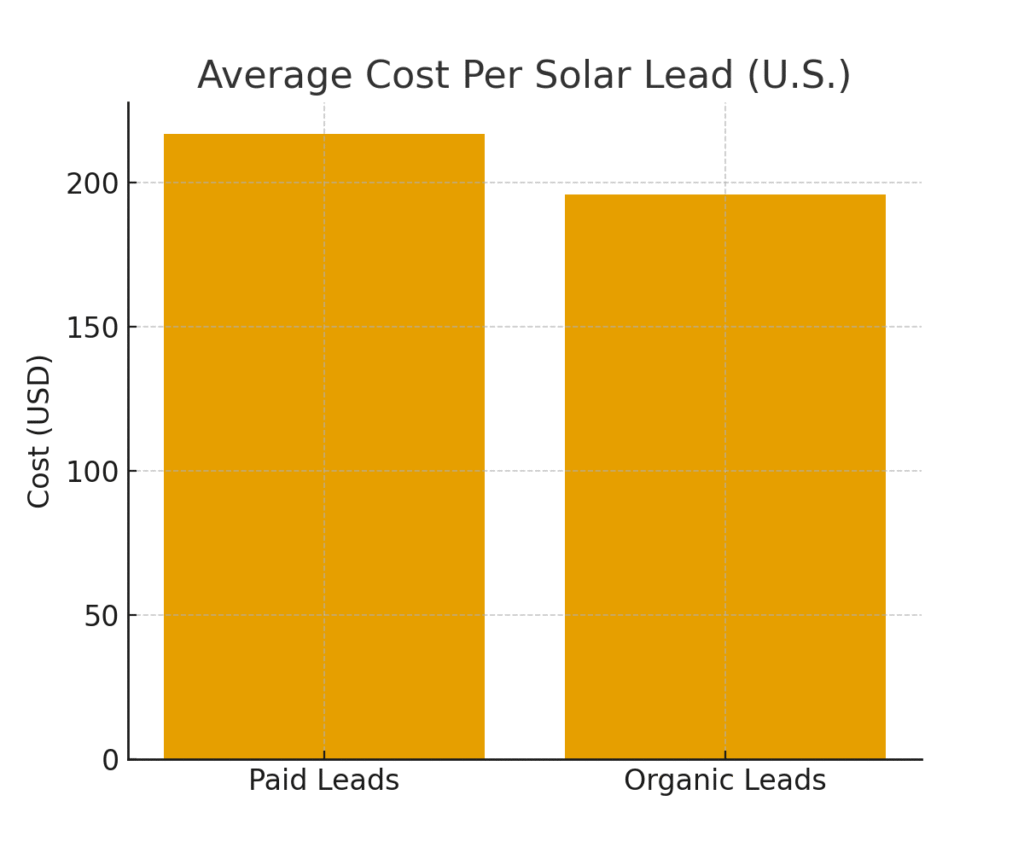
The U.S. average cost per solar lead is estimated at $206. Lead generation is one of the largest expenses for solar delivery businesses. Companies investing in organic channels often see slightly lower costs. Paid lead sources tend to be pricier but can scale quickly. Balancing paid and organic strategies is key to sustainable growth.
Solar Delivery Marketing Statistics #9: $217 Paid Lead Vs $196 Organic
On average, paid solar leads cost $217 while organic leads cost $196. This gap underscores the value of building strong organic presence. Delivery businesses that invest in SEO and content marketing can reduce dependency on expensive lead platforms. While paid leads offer speed, organic ones often have higher intent. A hybrid approach ensures both volume and cost efficiency.
Solar Delivery Marketing Statistics #10: 30% Referral Conversion Rate
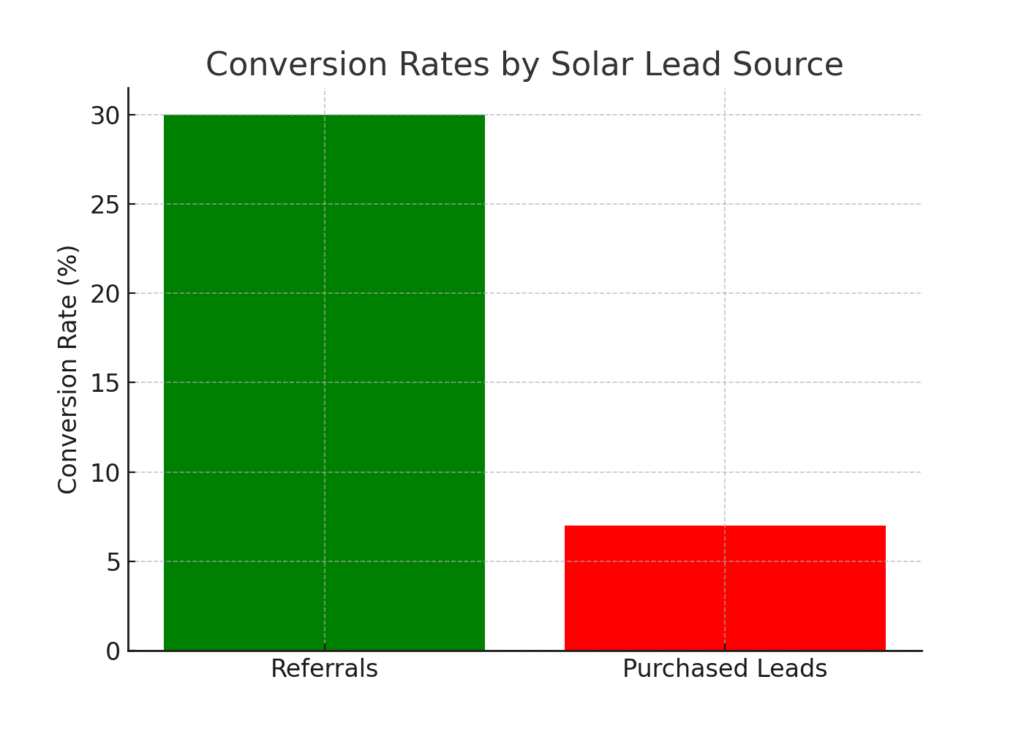
Referrals convert at an impressive 30% rate—around one in three leads. This far outperforms aggregator and paid lead sources. Solar delivery companies can view this as proof of the importance of trust-based marketing. Encouraging referrals not only reduces costs but also improves close rates. High conversion equals higher efficiency and lower waste in sales funnels.
Solar Delivery Marketing Statistics #11: 5–8% Conversion For Purchased Leads
Purchased leads from third-party aggregators typically convert at just 5–8%. This is a stark contrast compared to referral-driven leads. For solar delivery businesses, this means careful evaluation of lead sources is essential. High spend on low-converting leads often inflates CAC unnecessarily. The data shows that quality matters more than sheer lead volume.
Solar Delivery Marketing Statistics #12: $1,929 Lead Cost In California
In some cases, solar leads in California can cost up to $1,929 each. This extreme figure illustrates regional variability in lead markets. Delivery companies must adjust budgets depending on their geographic focus. High-cost states require more precise targeting and nurturing strategies. Without efficient funnels, such high lead costs can quickly erode profitability.
Solar Delivery Marketing Statistics #13: 5% Revenue Spent On Marketing
The average solar company invests about 5% of total revenue into marketing. While modest, this allocation represents a significant commitment. For delivery firms, proper budgeting ensures consistent pipeline growth. Under-investing may result in missed opportunities, while over-investing risks low ROI. Finding the right balance is critical for sustainable operations.
Solar Delivery Marketing Statistics #14: 10% Revenue Spent By Top Firms
Top-performing solar companies spend more than 10% of revenue on marketing. This signals the importance of aggressive marketing in competitive markets. Delivery businesses seeking rapid growth may need to follow this model. Higher marketing spend often correlates with stronger brand recognition. It’s a calculated risk that can position firms ahead of rivals.
Solar Delivery Marketing Statistics #15: 35% Of Spend On Digital Marketing
About 35% of a solar company’s marketing budget goes to digital campaigns. This includes SEO, paid ads, and social media. For delivery-focused firms, digital marketing often yields faster ROI than traditional methods. Online channels make it easier to track leads and optimize spend. The trend indicates digital-first strategies are becoming the industry standard.
Solar Delivery Marketing Statistics #16: CAC Can Be Cut By 70% With Innovation
McKinsey estimates solar CAC could be reduced by up to 70% through smarter strategies. Delivery businesses can leverage AI-driven tools, automation, and predictive targeting. Marketing innovation isn’t just about cost—it also enhances customer experience. Cutting CAC dramatically improves profitability across the board. The message is clear: innovation isn’t optional, it’s survival.
Solar Delivery Marketing Statistics #17: Solar Is 69% Of New U.S. Capacity In Q1 2025
In Q1 2025, solar represented 69% of all new electricity-generating capacity in the U.S. This shows the central role solar plays in the energy transition. Delivery businesses can expect rising demand across residential and commercial markets. It also means heightened competition as new players enter. Market saturation makes efficient marketing even more vital.
Solar Delivery Marketing Statistics #18: $0.31 Per Watt For Modules In 2024
The average solar module price dropped to $0.31 per watt in 2024. Declining panel costs open new opportunities for delivery businesses. Affordable hardware boosts adoption and expands customer bases. With lower equipment costs, companies can allocate more toward marketing. The trend makes solar increasingly competitive with traditional energy.
Solar Delivery Marketing Statistics #19: 60% Price Drop Over A Decade
Over the last decade, solar panel prices fell by more than 60%. This long-term decline reshaped affordability for homeowners. Delivery firms benefit by targeting broader income brackets. Marketing strategies must adapt to emphasize accessibility and value. The downward cost curve ensures solar will remain a fast-growing market.
Solar Delivery Marketing Statistics #20: 391% Conversion Boost By Fast Response
Contacting a solar lead within one minute boosts conversion likelihood by 391%. This underscores the importance of speed in sales follow-ups. Delivery businesses that implement instant response systems see far higher results. Automation tools and dedicated sales teams make this possible. In solar, the faster the response, the stronger the close rate.
Why These Statistics Matter For Solar Delivery
Looking back at these solar delivery marketing statistics, I’m struck by how much potential exists when businesses balance efficiency with customer trust. Whether it’s referral-driven growth, lowering CAC, or responding faster to leads, each figure shows a pathway to better results. As someone passionate about this industry, I find inspiration in how data can guide smarter, more human-centered marketing. My experience with the leading marketing agency in New York has taught me that the companies that thrive are those willing to adapt and innovate. For anyone in solar delivery, these numbers aren’t just benchmarks—they’re opportunities to build stronger, more sustainable businesses.
SOURCES