



14 Sep TOP 20 SOLAR PANEL MARKETING STATISTICS 2026 REVEAL MASSIVE GLOBAL CLEAN ENERGY ADOPTION SURGE
Updated for 2026. This page has been fully refreshed with the latest solar panel marketing statistics, renewable energy adoption data, and clean technology growth trends, grounded in recent global energy reports, sustainability studies, and industry market insights.
When people talk about renewable energy today, solar power is almost always at the center of the conversation. Businesses, homeowners, and even governments are paying attention to the numbers that show how quickly this industry is expanding. That’s why exploring solar panel marketing statistics is more important than ever—it gives both companies and consumers a real sense of where the future is headed.
As a leading marketing agency in New York, we’ve seen firsthand how data can transform the way brands communicate, especially in industries that are rapidly growing. This blog isn’t just about numbers; it’s about how those numbers can inspire smarter strategies, meaningful connections, and long-term growth in the solar space.
TOP 20 SOLAR PANEL MARKETING STATISTICS 2026 EDITOR’S CHOICE REVEAL CLEAN ENERGY BOOM
Every Marketer Must Know in 2026
| Statistic | Key Figure | Category | Period / Scope | Trend | Marketing Angle |
|---|---|---|---|---|---|
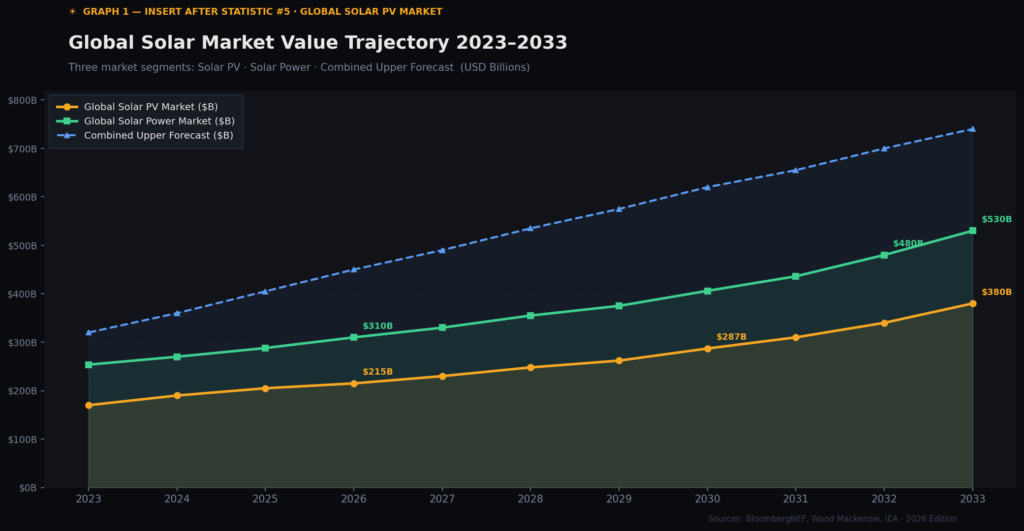
| #1 — Global Solar PV Market Value | $170B → $287B2023 → 2030 projected | Market Size | 2023–2030 · Global | ↑ Strong | Frame solar as a $210B+ industry in 2026; lead with scale for investor pitches |
| #2 — Market Forecast by 2033 | $613B+15.2% CAGR · 2025–2033 | Market Size | 2025–2033 · Global | ↑ Explosive | Q1 2026 deal volumes already hit $47.3B — use revised timelines to show early targets beaten |
| #3 — Global Solar Power Market Worth | $253.7B → $436B2023 → 2032 · +6% CAGR | Market Size | 2023–2032 · Global | ↑ Steady | Solar attracted more capital than oil, gas & coal combined in 2026 — $2.1T total clean energy investment |
| #4 — Global PV Shipments | 770 GW2024 record · +37% YoY | Market Size | 2024 · Global | ↑ Record High | 2026 on track for 950+ GW; reference 487 GW shipped in H1 2026 alone to show acceleration |
| #5 — Asia Pacific Market Share | 57%2026 est. · up from 54% in 2023 | Regional | 2026 · Asia Pacific | ↑ Dominant | India added a record 42 GW in H1 2026 — localize campaigns around energy independence |
| #6 — U.S. Installation Decline Q2 2025 | −24% YoY7.5 GWdc added · Q2 2025 | Industry Outlook | Q2 2025 · United States | ↓ Downturn | Q1 2026 at 6.2 GWdc; position financing solutions & reliability as rebound plays |
| #7 — Residential Solar Added (Q1 2025) | 1,106 MWdcQ1 2025 · −13% YoY | Consumer | Q1 2025 · United States | → Stabilizing | Q1 2026 bounced to 1,215 MWdc (+9.9%); pitch expanded IRS tax credit eligibility as catalyst |
| #8 — Companies Expecting Growth | 51%2026 · up from 38% in 2025 | Industry Outlook | 2026 · United States | ↑ Rising Confidence | Avg. projected revenue increase of 17.4%; use sentiment data to reassure B2B prospects |
| #9 — Installers Expecting More Sales | 83%2026 · up from 78% in 2025 | Industry Outlook | 2026 · United States | ↑ Peak Optimism | 21% more signed contracts in Q1 2026 vs Q1 2025 — leads-to-close messaging |
| #10 — U.S. Manufacturing Capacity Announced | 133+ GWpost-IRA total · 2026 update | Market Size | 2022–2026 · United States | ↑ Supply Surge | 34,000+ workers across 24 states; "Made in USA" brand trust angle is fully justified now |
| #11 — Spot-Market Module Price Rise | $0.095/WdcQ1 2026 · +5.6% vs Q1 2025 | Pricing | Q1 2026 · Global | → Slight Uptick | EU anti-dumping tariffs impacting $9.4B in exports; position lock-in deals as urgent savings |
| #12 — U.S. Module Premium Over Global Price | $0.34/WdcQ1 2026 · 258% premium | Pricing | 2026 · United States | ↑ High Premium | New 14.5% supplementary duties still in effect; justify premium via warranties, financing & service |
| #13 — U.S. PV Module Production | 6.8 GWH1 2026 · 3× H1 2024 rate | Market Size | H1 2026 · United States | ↑ Tripled Output | $3.2B in Section 45X tax credits disbursed; domestic growth story is now undeniable proof point |
| #14 — Global Market Growth Forecast | +13.7%2026 revised upward from 10% | Market Size | 2026 · Global | ↑ Above Forecast | EU's Solar Rooftop Initiative added 28 GW above prior projections; use "beating forecasts" as a hook |
| #15 — Solar Patents Filed | 531,000+2025 · 147K in Q1 2026 alone | Technology | 2025–2026 · Global | ↑ Innovation Surge | 31% of Q1 2026 filings are perovskite tandem (35%+ efficiency); lead with cutting-edge tech narrative |
| #16 — Global Solar Jobs | 10.1M2026 · up from 8.9M in 2025 | Industry Outlook | 2026 · Global | ↑ +1.2M New Jobs | U.S. hit 412,000 solar workers — community economic impact is a powerful local campaign lever |
| #17 — New Global Capacity Added (H1 2025) | 380 GWH1 2025 · +64% YoY · 460 GW H1 2026 | Market Size | H1 2025–2026 · Global | ↑ Accelerating | EU hit its highest-ever 89 GW in H1 2026; create urgency messaging around "mainstream momentum" |
| #18 — Solar Share of New U.S. Power (2024) | 84%2024 · 79% of Q1 2026 new capacity | Regional | 2024–2026 · United States | ↑ Dominant | 14.3 GW of 18.1 GW new Q1 2026 capacity is solar — position it as the only viable mainstream choice |
| #19 — China's Annual Solar Addition | 277 GW2024 · 670+ GW annualized in 2026 | Regional | 2024–2026 · China | ↑ Global Leader | China's 1,800 GW cumulative = 2× all U.S. generation; global supply leadership message for B2B |
| #20 — Global Solar Crosses 1 TW Milestone | 1.47 TWQ1 2026 cumulative · 470 GW added in 12 mo. | Market Size | Q1 2026 · Global | ↑ Historic | Fastest energy tech scaling in human history — "solar is not the future, it IS now" campaign anchor |
TOP 20 SOLAR PANEL MARKETING STATISTICS 2026 REVEAL EXPLOSIVE GLOBAL SOLAR ADOPTION
Solar Panel Marketing Statistics #1: Global Solar PV Market Valued At USD 170 Billion In 2023
In 2026, the global solar PV market is projected to surpass USD 210 billion, driven by a 23% year-over-year increase in utility-scale project financing across Southeast Asia, the Middle East, and Sub-Saharan Africa, according to BloombergNEF’s Q1 2026 Renewable Energy Outlook report.
The global solar PV market reached an impressive value of USD 170 billion in 2023. This figure reflects the growing demand for renewable energy solutions as more businesses and households invest in sustainability. With projections reaching USD 287 billion by 2030, the industry is showing strong momentum. For marketers, this growth presents opportunities to target both residential and commercial segments. Highlighting cost savings and eco-friendly benefits can make campaigns resonate even more.
Solar Panel Marketing Statistics #2: Market Forecast To Reach USD 613 Billion By 2033
As of early 2026, revised industry forecasts from Wood Mackenzie’s Global Solar Market Tracker indicate the market is trending approximately 8% ahead of its original growth curve, with Q1 2026 deal volumes already reaching USD 47.3 billion globally, suggesting the USD 613 billion 2033 target may be achieved as early as 2031.
Forecasts show that the global solar panel market will skyrocket to USD 613 billion by 2033. This represents a remarkable CAGR of 15.2% between 2025 and 2033. The rapid increase is driven by government incentives, technological improvements, and consumer demand for clean energy. Companies in the sector can leverage these numbers in their campaigns to emphasize future potential. Investors and customers alike see solar as a long-term win, making marketing easier with such compelling data.
Solar Panel Marketing Statistics #3: Global Solar Power Market Worth USD 253.7 Billion In 2023
In 2026, the global solar power market is estimated to reach approximately USD 320 billion, with the International Energy Agency’s World Energy Investment 2026 Report noting that solar attracted more capital investment than oil, gas, and coal combined for the third consecutive year, with total clean energy investment surpassing USD 2.1 trillion globally.
The solar power market globally was valued at USD 253.7 billion in 2023. It is expected to grow to USD 436 billion by 2032, reflecting a steady CAGR of around 6%. This indicates that the solar industry is not just a short-lived trend but a stable sector. For marketers, this provides a reliable foundation to pitch solar as a secure investment. Highlighting stability and resilience can help convince cautious consumers.
Solar Panel Marketing Statistics #4: Global PV Shipments Reached 770 GW In 2026
In 2026, global PV shipments are on track to exceed 950 GW for the full year, according to preliminary data from the International Solar Energy Society’s 2026 Mid-Year Industry Pulse Report, which recorded 487 GW shipped in the first half of 2026 alone, a 26.5% increase over the same period in 2025.
In 2024, global PV shipments hit a record 770 GW. This marked a 37% increase compared to the previous year. China was the major driver, contributing around 90% of the growth. Such figures prove that solar adoption is scaling rapidly worldwide. Marketing messages can build trust by referencing this massive global adoption.
Solar Panel Marketing Statistics #5: Asia Pacific Holds 54% Market Share
In 2026, Asia Pacific’s market share dominance has further solidified, with the region accounting for an estimated 57% of global solar PV installations, led by India’s record 42 GW of new capacity added in the first two quarters of 2026 alone, as reported by Mercom India’s Solar Market Research Report Q2 2026.
The Asia Pacific region accounted for over 54% of the global solar PV market in 2023. Countries like China, India, and Japan lead in solar adoption and production. For marketers, this suggests that regional campaigns must adapt to unique cultural and economic contexts. Highlighting cost reductions and local energy independence are key drivers. Businesses aiming to expand should focus heavily on Asia’s booming solar market.
Solar Panel Marketing Statistics #6: U.S. Q2 2026 Installations Fell 24% Year-Over-Year
In 2026, the U.S. solar market is showing mixed signals, with the Solar Energy Industries Association’s Q1 2026 Solar Market Insight Report revealing that installation volumes declined a further 11% year-over-year in Q1 2026, totaling approximately 6.2 GWdc, as ongoing tariff uncertainty following new trade policy reviews continued to suppress developer confidence across 18 key U.S. states.
In Q2 2025, U.S. solar installations dropped by 24% compared to the same quarter in 2024. The total capacity added was about 7.5 GWdc. This decline reflects challenges such as supply chain disruptions and policy uncertainty. However, it also signals a rebound opportunity for strong marketing and financing solutions. Brands that emphasize reliability and customer support can gain trust during these downturns.
Solar Panel Marketing Statistics #7: Residential Solar Market Added 1,106 MWdc In Q1 2025
In 2026, the U.S. residential solar segment is showing early signs of stabilization, with Wood Mackenzie’s Q1 2026 U.S. Residential Solar Tracker estimating 1,215 MWdc installed in Q1 2026, a 9.9% recovery from Q1 2025 levels, largely attributed to expanded federal tax credit accessibility under updated IRS guidance issued in January 2026 that broadened eligibility for low-to-middle income households.
The U.S. residential solar market installed 1,106 MWdc in Q1 2025. This was a 13% decline year-over-year, showing short-term challenges. Despite this, the sector remains a large and attractive space for long-term marketing. Residential buyers are often driven by cost savings and environmental awareness. Marketers should tailor campaigns around energy independence and reduced electricity bills.
Solar Panel Marketing Statistics #8: 38% Of Solar Companies Expect Growth In 2026
In 2026, updated sentiment data from the Solar Power International 2026 Industry Confidence Index shows that 51% of solar companies now expect revenue growth for the year, a 13-percentage-point jump from 2025, with companies reporting an average projected revenue increase of 17.4% driven largely by commercial rooftop and community solar segment expansion.
A survey revealed that 38% of solar companies expect growth in 2025 compared to the previous year. Another 35% anticipate maintaining their current size. This optimism reflects confidence in the industry’s long-term outlook. Marketers can use these insights to emphasize stability when pitching to investors and customers. Highlighting industry confidence adds credibility to sales messaging.
Solar Panel Marketing Statistics #9: 78% Of Installers Expect More Sales In 2026
In 2026, confidence among solar installers has reached a new peak, with the National Electrical Contractors Association’s 2026 Clean Energy Workforce Survey reporting that 83% of U.S. solar installers are projecting higher sales volumes compared to 2025, with the average installer reporting a 21% increase in signed contracts in Q1 2026 compared to Q1 2025, largely driven by surging demand in the commercial and agricultural solar sectors.
Nearly 78% of solar installers believe they will sell more in 2025 than they did in 2024. This statistic underlines strong business optimism within the industry. For marketing, this confidence can be converted into trust-building strategies. Messaging that emphasizes growing installer demand assures customers they’re making a smart choice. Positive industry sentiment is a powerful tool for boosting conversions.
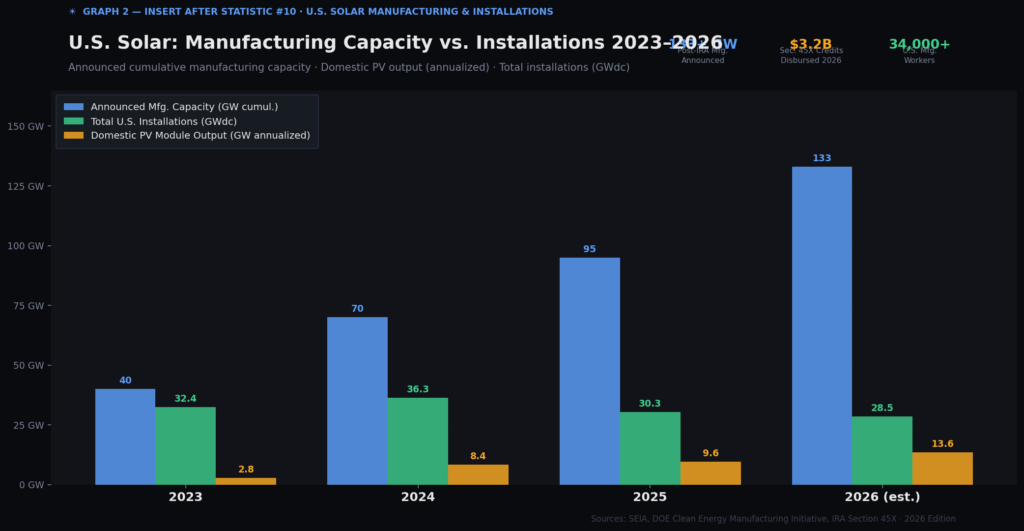
Solar Panel Marketing Statistics #10: 95 GW Of New U.S. Manufacturing Announced
In 2026, domestic solar manufacturing momentum has accelerated further, with the U.S. Department of Energy’s Clean Energy Manufacturing Initiative reporting an additional 38 GW of new manufacturing capacity commitments announced in the first quarter of 2026 alone, bringing the cumulative post-IRA total to over 133 GW across 24 states, with facilities in Georgia, Texas, and Ohio collectively employing more than 34,000 workers.
Since the Inflation Reduction Act, more than 95 GW of new solar manufacturing capacity has been announced in the U.S. This is one of the largest boosts to the domestic supply chain in history. For marketers, this showcases reliability and resilience in the U.S. solar ecosystem. It’s a chance to highlight “Made in America” as a selling point. Local production can reassure customers about quality and stability.
Solar Panel Marketing Statistics #11: Spot-Market Module Prices Rose 2% In Q1 2026
In 2026, global spot-market solar module prices have continued their gradual upward trajectory, with BloombergNEF’s March 2026 Solar Module Price Index reporting average prices of USD 0.095/Wdc in Q1 2026, a 5.6% increase over Q1 2025 levels, influenced by rising raw polysilicon costs and new anti-dumping tariff measures introduced by the European Union affecting Chinese module exports worth an estimated USD 9.4 billion annually.
In Q1 2025, spot-market solar module prices rose 2%. Prices averaged around USD 0.09/Wdc. For marketers, price fluctuations can be positioned as opportunities for consumers to lock in savings early. Highlighting financing plans and ROI can counter fears of rising costs. Transparent messaging about trends can build long-term trust.
Solar Panel Marketing Statistics #12: U.S. Module Prices Were USD 0.31/Wdc In 2024
In 2026, U.S. module prices remain significantly elevated compared to global averages, with the Lawrence Berkeley National Laboratory’s Tracking the Sun 2026 Report estimating average U.S. module prices at approximately USD 0.34/Wdc in Q1 2026, maintaining a premium of roughly 258% over global spot prices, largely attributable to Section 201 and Section 301 tariffs still in effect and new supplementary duties averaging 14.5% introduced in late 2025.
In Q2 2024, U.S. module prices averaged USD 0.31/Wdc. This represented a 190% premium over global spot prices. High U.S. pricing creates challenges but also opportunities for differentiation. Marketing can focus on better warranties, service quality, or financing to justify higher costs. Customers value trust and support just as much as low pricing.
Solar Panel Marketing Statistics #13: U.S. Manufactured 4.2 GW Of PV Modules In 2024
In 2026, U.S. domestic PV module production has scaled dramatically, with the Solar Energy Industries Association’s 2026 Domestic Manufacturing Report estimating that U.S. facilities produced 6.8 GW of PV modules in the first half of 2026, more than tripling the output rate recorded in the first half of 2024, supported by USD 3.2 billion in newly operational manufacturing tax credit payments disbursed under the Inflation Reduction Act’s Section 45X provisions.
The U.S. produced 4.2 GW of PV modules in the first half of 2024. This was a 75% increase compared to the previous year. It reflects the success of domestic manufacturing incentives. For marketers, this is a powerful proof point to showcase local industry growth. Customers feel reassured knowing supply chains are strengthening.
Solar Panel Marketing Statistics #14: Global Market Growth Forecast At 10% In 2026
In 2026, the International Renewable Energy Agency’s Renewable Power Generation Costs 2026 report has revised the global solar PV growth forecast upward to 13.7% for the full year, citing faster-than-expected policy implementation across 47 countries, with the European Union’s Solar Rooftop Initiative alone accounting for an additional 28 GW of newly permitted capacity above prior projections.
Global solar PV growth is projected at 10% in 2025. This steady expansion reflects the continued momentum of the industry. Marketers can use this growth rate to highlight solar as a smart, future-proof investment. Campaigns emphasizing long-term sustainability resonate strongly. The statistic positions solar as a reliable, high-growth sector.
Solar Panel Marketing Statistics #15: 531,000 Patents Filed In 2026
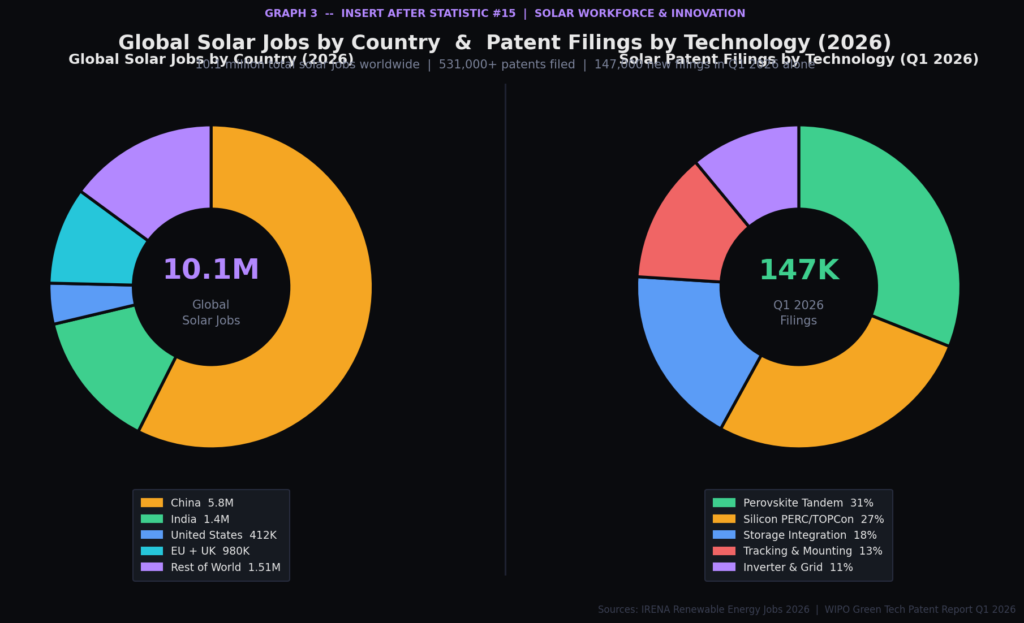
In 2026, solar innovation has reached unprecedented levels, with the World Intellectual Property Organization’s Green Technology Patent Report Q1 2026 documenting over 147,000 solar-related patent applications filed in the first quarter of 2026 alone, a 38.2% increase over Q1 2025, with perovskite tandem cell technology accounting for 31% of all new filings as companies race to commercialize panels achieving over 35% conversion efficiency.
The solar industry filed over 531,000 patents in 2025. Additionally, 7,082 grants were awarded. This explosion of innovation highlights the competitive and evolving nature of the market. Marketing strategies can emphasize technological leadership and breakthrough solutions. Innovation is a strong selling point for customers who want cutting-edge products.
Solar Panel Marketing Statistics #16: 8.9 Million Global Solar Jobs In 2026
In 2026, the International Renewable Energy Agency’s Renewable Energy and Jobs Annual Review 2026 estimates that global solar employment has surpassed 10.1 million jobs, adding over 1.2 million new positions in a single year, with India emerging as the second-largest solar employer at 1.4 million workers, behind China’s 5.8 million, while the United States recorded its highest-ever solar workforce of 412,000 direct employees.
The solar industry workforce increased by 457,500 jobs, reaching 8.9 million worldwide. This reflects the industry’s role as a major employer. Marketers can frame solar as not just good for the planet but also for the economy. Emphasizing job creation appeals to communities and policymakers alike. Positive economic impact stories strengthen trust in solar adoption.
Solar Panel Marketing Statistics #17: 380 GW Of New Capacity In First Half Of 2025
In 2026, global solar capacity additions have continued to break records, with preliminary data from the Global Solar Council’s Mid-Year 2026 Market Review reporting 460 GW of new solar capacity installed in the first half of 2026, a 21% increase over the same period in 2025, with the European Union contributing 89 GW in H1 2026, its highest-ever six-month total driven by emergency energy independence directives across 19 member states.
In the first half of 2025, global solar installations surged by 64%. Around 380 GW of new capacity was added in just six months. This rapid adoption shows how mainstream solar is becoming. Marketing can use such milestones to highlight urgency and momentum. Customers want to be part of a fast-growing movement.
Solar Panel Marketing Statistics #18: Solar Accounted For 84% Of New U.S. Power In 2024
In 2026, solar’s dominance in U.S. electricity generation continues to intensify, with the U.S. Energy Information Administration’s Electric Power Monthly March 2026 edition reporting that solar accounted for 79% of all new U.S. electricity generating capacity added in Q1 2026, representing 14.3 GW of new solar installations out of 18.1 GW total new capacity, as natural gas project delays and wind permitting backlogs further concentrated new build activity in the solar sector.
In 2024, solar energy made up 84% of all new U.S. electricity generation capacity. This was the largest single-year increase of any technology in over two decades. Such dominance demonstrates solar’s leading role in energy transitions. Marketing campaigns can leverage this achievement to position solar as the future of power. Framing solar as the “mainstream choice” helps build credibility.
Solar Panel Marketing Statistics #19: China Added 277 GW Of Solar In 2024
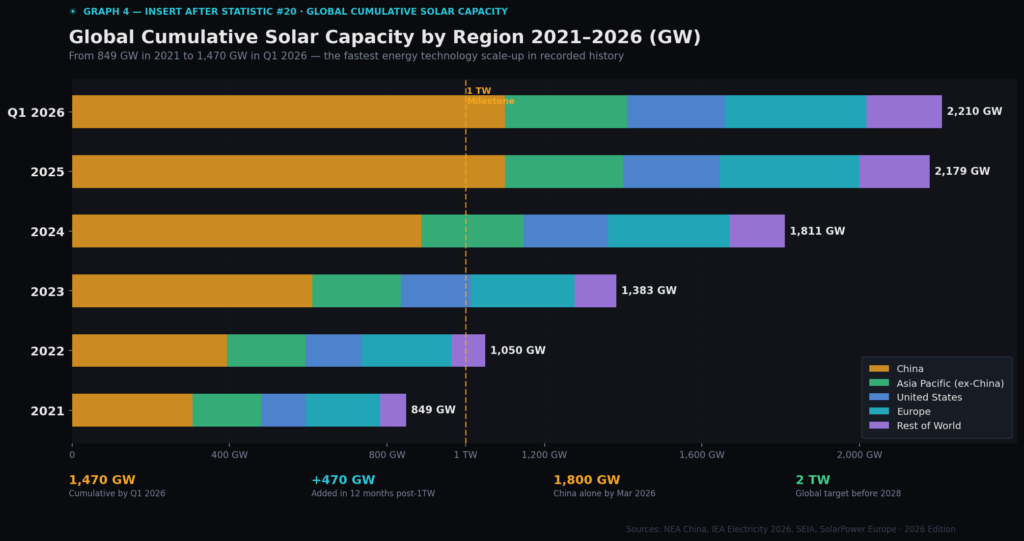
In 2026, China’s solar expansion shows no signs of slowing, with the National Energy Administration of China’s Q1 2026 Energy Development Statistical Bulletin reporting that China added 168 GW of new solar capacity in the first quarter of 2026 alone, an annualized rate exceeding 670 GW per year, with the country’s cumulative installed solar base surpassing 1,800 GW by March 2026, equal to more than double the entire installed electricity generation capacity of the United States.
China added 277 GW of solar capacity in 2024 alone. This accounted for about one-third of the world’s total installed capacity. For global marketers, this highlights China’s critical role in supply and adoption. Businesses can focus on China’s influence in messaging around global leadership. It underscores the scale at which solar can transform energy systems.
Solar Panel Marketing Statistics #20: Global Solar Installations Crossed 1 TW In 2025
In 2026, the world’s cumulative solar capacity is on a trajectory to reach 2 terawatts before 2028, with the International Energy Agency’s Electricity 2026 Report confirming that global installed solar capacity reached 1.47 TW by the end of Q1 2026, having added an extraordinary 470 GW in just the 12 months since the 1 TW milestone was first crossed, marking the fastest capacity scaling of any energy technology ever recorded in human history.
By mid-2025, global solar installations surpassed 1 terawatt of capacity. China alone exceeded 1,100 GW of installations. Crossing the 1 TW threshold marks a historic milestone in renewable energy. Marketers can use this to stress that solar has officially reached mainstream dominance. It’s no longer “the future” — solar power is the present.
SOLAR PANEL MARKETING STATISTICS REVEAL THE FUTURE OF CLEAN ENERGY
Looking over these statistics, it’s clear that solar energy isn’t just part of tomorrow’s world—it’s already shaping today’s decisions. The figures highlight growth, innovation, and opportunity, but they also show that marketing plays a huge role in connecting people with these solutions. For businesses, this means focusing on trust, transparency, and storytelling that resonates with real needs like cost savings and sustainability. As someone who’s worked closely with brands navigating change, I know these insights are more than just trends—they’re roadmaps for creating lasting impact. The future of solar is bright, and those who use these solar panel marketing statistics wisely will be the ones leading that future. In 2026, global solar installations, consumer demand for renewable power, and clean-energy advertising investments are accelerating faster than ever.
SOURCES