



21 Sep TOP 20 ST. PATRICK’S DAY MARKETING STATISTICS 2025
When I look at how brands prepare for seasonal campaigns, one holiday that always stands out is St. Patrick’s Day. There’s something about the mix of tradition, community, and celebration that makes it such a powerful moment for marketers. That’s why I decided to dig into the latest St. Patrick’s Day marketing statistics—not just to share numbers, but to uncover real insights you can apply to your campaigns. Partnering with a micro influencer marketing agency during this time can help brands tap into niche audiences and create authentic, festive content that drives engagement and conversions. As someone who works closely with a leading marketing agency in New York, I’ve seen how these seasonal opportunities can transform into meaningful customer connections when approached strategically. My goal here is to break down the data in a way that feels actionable, relatable, and maybe even sparks a few creative ideas for your own St. Patrick’s Day promotions.
Top 20 St. Patrick’s Day Marketing Statistics 2025 (Editor’s Choice)
🍀 Top 20 St. Patrick's Day Marketing Statistics 2025 🍀
Unlock the Pot of Gold: Consumer Insights & Spending Trends
| # | Category | Key Statistic |
|---|---|---|
| 💚 Consumer Participation & Overall Spending | ||
| 1 | Celebration Rate | 61% of consumers plan to celebrate St. Patrick's Day in 2025 — matching last year's record high |
| 2 | Total Spending | Expected to reach $7 billion in total spending for 2025 |
| 3 | Average Per Person | Consumers will spend an average of $43.64 per person |
| 4 | Growth Trend | Up from 55% in 2019 — showing 6-point increase in participation |
| 5 | Total Celebrators | 162 million Americans celebrated in 2024 — more than 20x Ireland's population! |
| 🛒 Shopping Behavior & Purchase Categories | ||
| 6 | Food Purchases | 50% of celebrators purchase food for St. Patrick's Day |
| 7 | Beverage Purchases | 41% purchase beverages as part of their celebration |
| 8 | Apparel & Accessories | 31% buy apparel or accessories for the holiday |
| 9 | Decorations | 26% purchase decorations to mark the occasion |
| 10 | Grocery Shopping | 38% shop at grocery stores for St. Patrick's Day items |
| 11 | Discount Stores | 31% shop at discount stores for holiday purchases |
| 🎉 How Consumers Celebrate | ||
| 12 | Wearing Green | 83% wear green to show Irish pride — the most popular way to celebrate! |
| 13 | Special Dinner | 31% plan to make a special St. Patrick's Day dinner |
| 14 | Bars & Restaurants | 27% will attend a party at a bar or restaurant |
| 15 | Home Decorating | 27% decorate their homes or offices with an Irish theme |
| 16 | Parade Attendance | 15% plan to attend a St. Patrick's Day parade |
| 👥 Demographics & Beverage Insights | ||
| 17 | Young Adults Lead | 77% of 18-24 year olds celebrate — highest participation rate by age |
| 18 | Top Spenders | 35-44 year olds spend the most at an average of $45.76 per person |
| 19 | Beer Preferences | 50% choose American lagers, while 31% opt for stouts like Guinness |
| 20 | Guinness Boost | Guinness rises from #17 beer annually to #9 in March — beer category sees 2.3-point household penetration increase |
Top 20 St. Patrick’s Day Marketing Statistics 2025
St. Patrick’s Day Marketing Statistics #1 – 61% of U.S. Consumers Plan to Celebrate
St. Patrick’s Day remains one of the most widely celebrated cultural events in the U.S., with 61% of consumers joining in. This shows the holiday’s unique ability to reach a broad audience across generations. Marketers can leverage this enthusiasm by creating campaigns that feel inclusive and festive. From retail to hospitality, this large participation rate signals opportunities across industries. The sheer scale of celebration means brands that ignore it may miss out on valuable seasonal engagement.
St. Patrick’s Day Marketing Statistics #2 – Average Spend Per Person is $44
On average, consumers spend about $44 for St. Patrick’s Day celebrations. While this may not seem massive compared to Christmas or Valentine’s Day, it adds up significantly across millions of shoppers. The spending often covers food, drinks, decorations, and apparel, making it a multi-category opportunity. For marketers, this steady per-person spend highlights predictable returns if campaigns are well targeted. Consistency in spending also makes forecasting easier for seasonal product planning.
St. Patrick’s Day Marketing Statistics #3 – $7.2 Billion Total Spending in 2024
In 2024, U.S. consumers spent a staggering $7.2 billion celebrating St. Patrick’s Day. This level of spending proves the holiday is more than just cultural—it’s economic. Businesses across food, beverage, and retail industries saw measurable boosts during the holiday season. It’s a reminder that even one-day celebrations can rival larger holidays when it comes to sales. Marketers who build themed campaigns early can claim their share of this multi-billion-dollar market.
St. Patrick’s Day Marketing Statistics #4 – Celebration Participation Has Been Rising
After pandemic-era declines, participation in St. Patrick’s Day activities has been climbing back steadily. More people are returning to parades, bars, and family gatherings, which strengthens the overall market. This return to community celebrations shows that consumers are craving shared cultural experiences again. For brands, tapping into this renewed enthusiasm can drive stronger connections. Offering both in-person and online experiences ensures broader engagement.
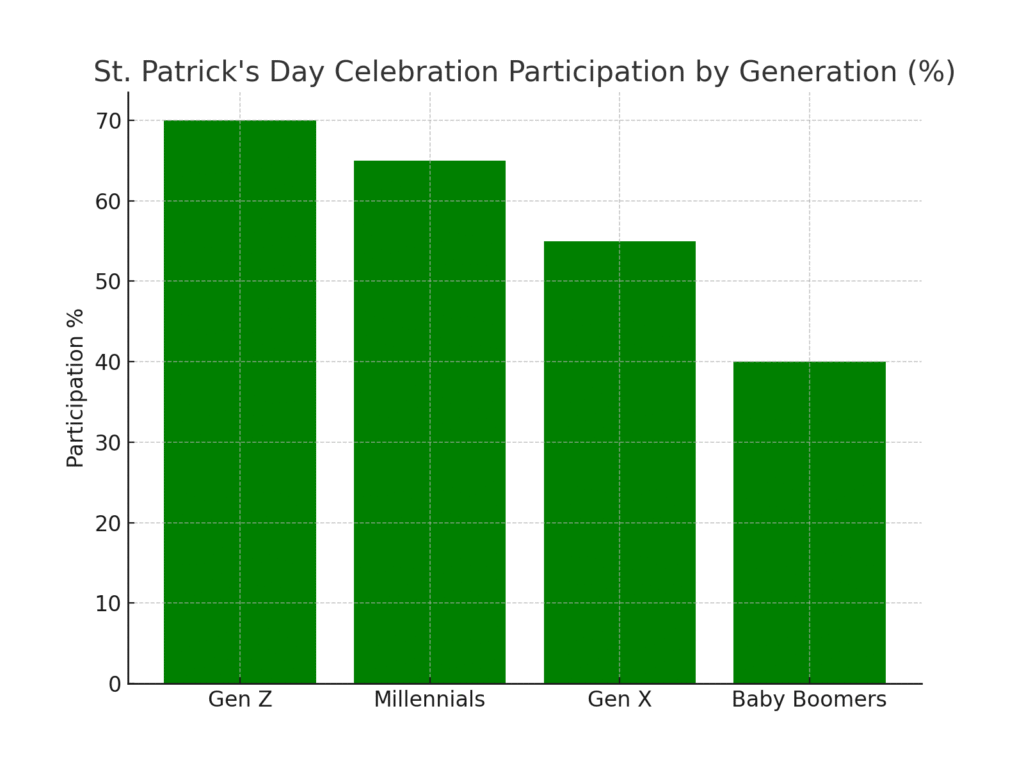
St. Patrick’s Day Marketing Statistics #5 – Younger Generations Lead in Celebration
Gen Z and Millennials are more likely to celebrate St. Patrick’s Day compared to older generations. Their energy fuels social media content, themed events, and experiential campaigns. This demographic is also highly receptive to creative digital promotions. Marketers can benefit by designing campaigns that appeal to younger tastes, from memes to Instagram-worthy visuals. Engaging these groups not only boosts sales but also builds long-term loyalty.
St. Patrick’s Day Marketing Statistics #6 – 79% Wear Green to Celebrate
Wearing green is the most common way consumers participate, with nearly 8 in 10 doing so. This tradition makes apparel and accessories an easy win for brands. Retailers offering affordable green-themed fashion and accessories can quickly capture attention. For marketers, it’s a reminder that even small, symbolic items can drive large-scale sales. The ritual of wearing green keeps St. Patrick’s Day culturally vibrant year after year.
St. Patrick’s Day Marketing Statistics #7 – 28% Make a Special Dinner
Roughly 28% of celebrators mark the occasion with a special meal. This creates opportunities for grocery brands, meal kit services, and restaurants. Campaigns that highlight Irish-inspired recipes can resonate strongly with this group. Marketers should focus on convenience and authenticity to maximize appeal. Food-related promotions often drive higher engagement because they tie directly to the holiday’s cultural traditions.
St. Patrick’s Day Marketing Statistics #8 – 26% Attend Bars or Restaurant Parties
About one-quarter of celebrators enjoy bar or restaurant events during St. Patrick’s Day. These outings often involve themed menus, drinks, and entertainment. For hospitality marketers, this is a chance to create memorable in-person experiences. Limited-edition drinks or Irish-inspired specials can attract both regulars and new customers. The social nature of these events also fuels organic promotion through social media sharing.
St. Patrick’s Day Marketing Statistics #9 – 24% Decorate Homes or Offices
Nearly a quarter of consumers decorate their homes or workplaces for the holiday. This behavior supports demand for themed décor, party supplies, and novelty products. Brands that provide affordable, creative, and festive items can stand out in this space. Digital campaigns highlighting decoration ideas often perform well in the weeks leading up to March 17th. Marketers should target both families and offices preparing group celebrations.
St. Patrick’s Day Marketing Statistics #10 – 52% Spend on Food
More than half of celebrators spend on food, making it the top category. Grocery stores, meal services, and food brands all see spikes during this season. Marketers can capitalize by offering Irish-inspired promotions and bundles. This spending also creates opportunities for cross-promotion with beverages and décor. Food-centered campaigns tend to resonate because they anchor the holiday in tradition.
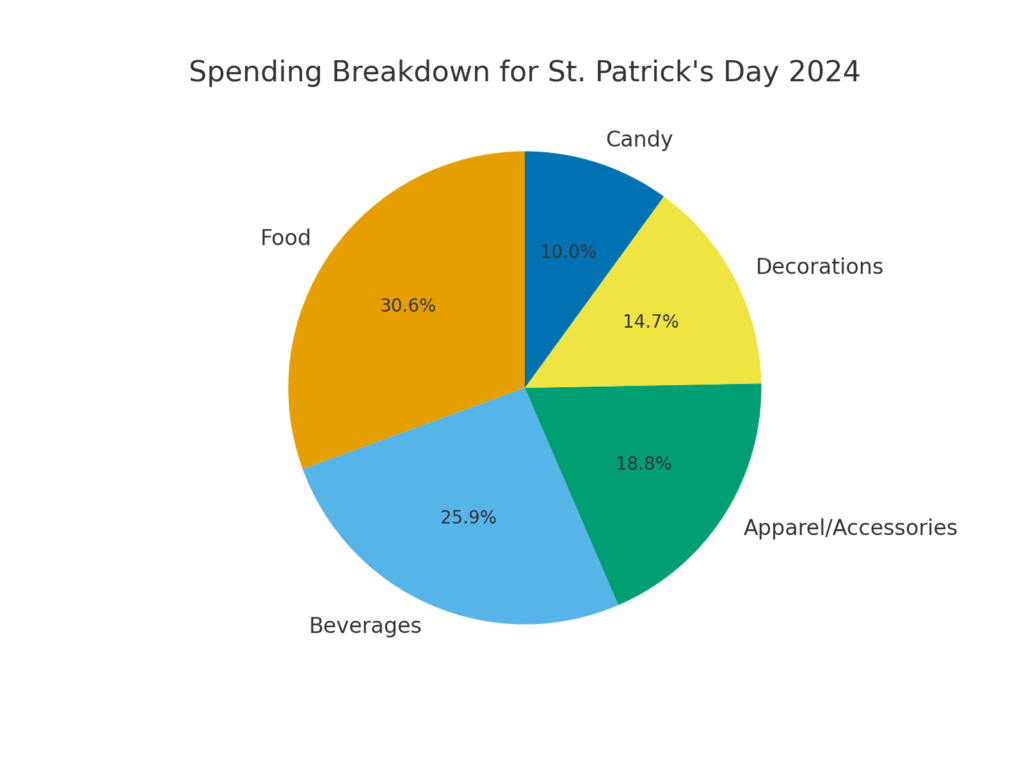
St. Patrick’s Day Marketing Statistics #11 – 44% Spend on Beverages
Beverages, particularly alcohol, are a core part of St. Patrick’s Day celebrations for nearly half of consumers. Bars, breweries, and retailers often see significant spikes in sales. Green-colored drinks, beer promotions, and cocktails all drive customer interest. For marketers, aligning with this tradition is almost mandatory in the beverage sector. Seasonal beverage promotions not only generate revenue but also create cultural relevance.
St. Patrick’s Day Marketing Statistics #12 – 32% Spend on Apparel and Accessories
Roughly one-third of celebrators buy themed apparel or accessories for the day. This reflects the strong influence of “wearing green” as a social expectation. Fashion and accessory brands can boost sales with affordable themed collections. Limited-time offerings also encourage urgency in purchases. By focusing on fun and inclusivity, apparel campaigns can capture both young and family audiences.
St. Patrick’s Day Marketing Statistics #13 – 25% Spend on Decorations
One in four celebrators purchase decorations to mark the holiday. This creates opportunities for party stores, online retailers, and home brands. Seasonal promotions for green-themed décor can perform especially well online. Marketers should use visuals heavily, as decorations are driven by aesthetic appeal. Consumers are eager to showcase festive spirit in both personal and professional spaces.
St. Patrick’s Day Marketing Statistics #14 – 17% Spend on Candy
About 17% of celebrators buy candy for St. Patrick’s Day. While not as dominant as food or beverages, it’s still a meaningful segment. Green-wrapped or shamrock-shaped treats have strong visual appeal for children and families. Marketers can package candy as part of gift bundles or party kits. Seasonal candy promotions can also drive impulse purchases in-store.
St. Patrick’s Day Marketing Statistics #15 – Grocery Stores Dominate Purchases at 39%
The majority of St. Patrick’s Day shopping takes place in grocery stores. These outlets provide easy access to food, drinks, and decorations. For marketers, in-store promotions are key during this period. Strategic product placement and themed displays can significantly boost sales. Grocery channels remain the cornerstone of holiday shopping activity.
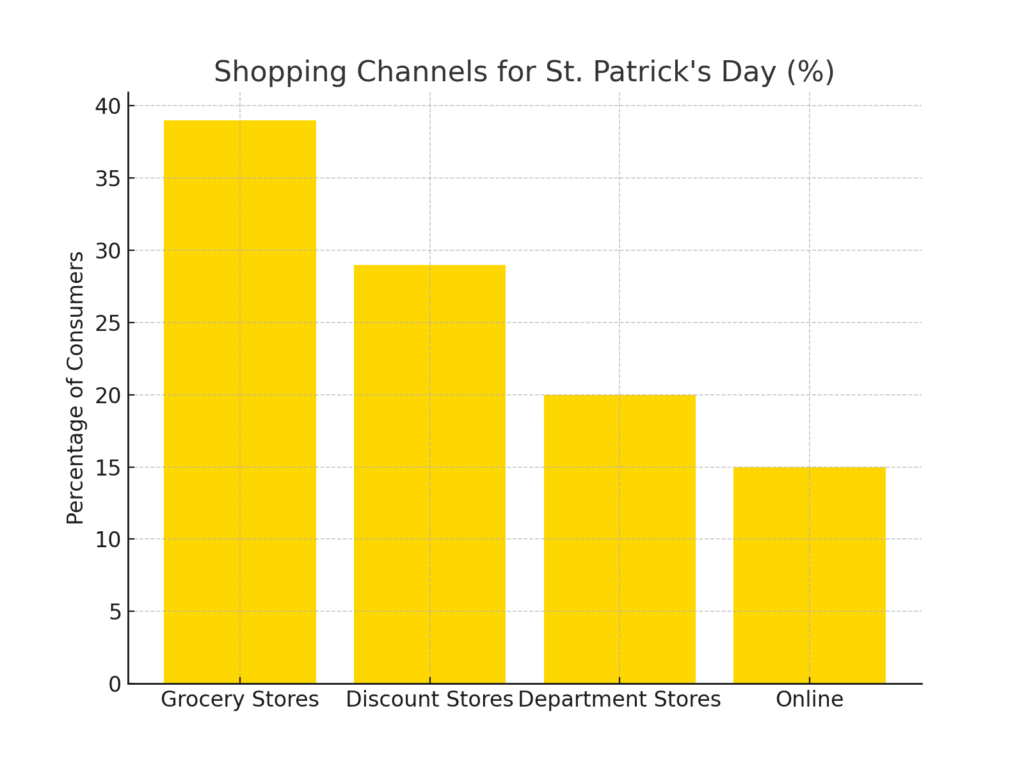
St. Patrick’s Day Marketing Statistics #16 – Online Shopping Accounts for 15%
About 15% of celebrators shop online for their St. Patrick’s Day needs. This segment is growing as ecommerce becomes more mainstream. Online retailers can use themed email campaigns and social media ads to capture attention. Limited-time discounts and fast shipping options are especially appealing. While smaller than grocery or discount stores, online channels offer strong margins and scalable reach.
St. Patrick’s Day Marketing Statistics #17 – Beer Sales Spike on March 17
Beer consistently experiences one of its biggest sales surges during St. Patrick’s Day. Bars and retailers report higher volume sales, particularly for imported and craft beers. For marketers, this is the time to push beer promotions aggressively. Seasonal packaging, bundle deals, and experiential events amplify visibility. The beer surge underscores how central drinking culture is to the holiday.
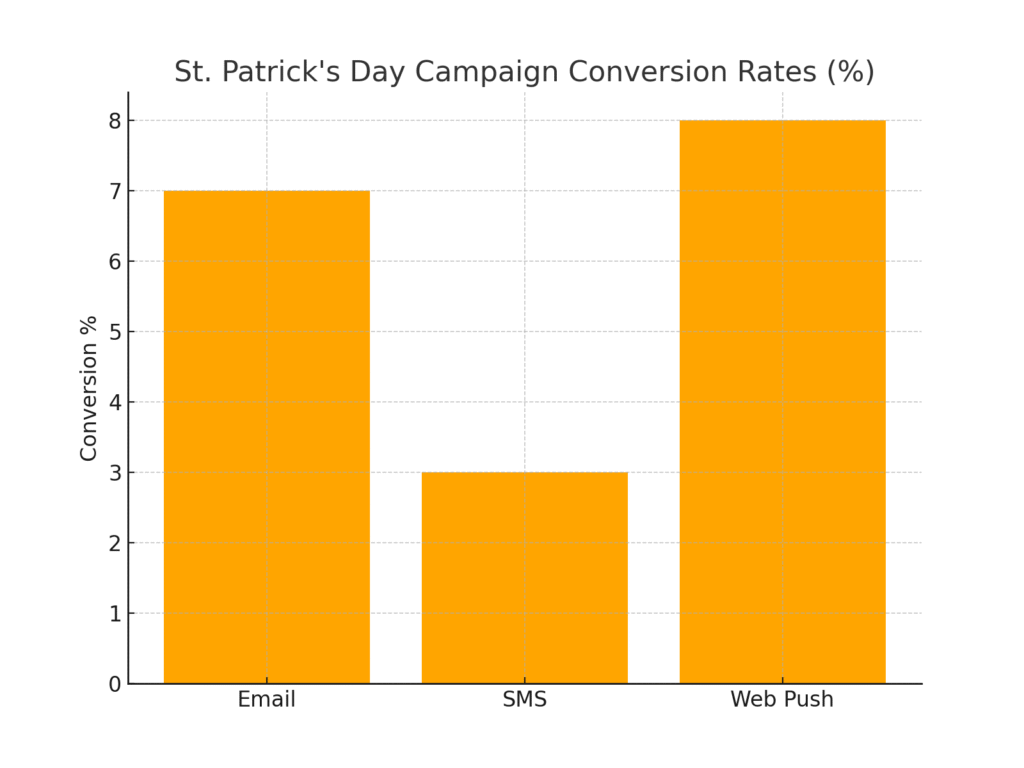
St. Patrick’s Day Marketing Statistics #18 – Email Campaign Conversion Rates Hit 5–9%
Email remains one of the strongest digital marketing tools during St. Patrick’s Day. Conversion rates average between 5–9%, higher than many other seasonal periods. Marketers can maximize this by crafting festive subject lines and timely offers. Automated campaigns, such as abandoned cart reminders, further improve results. Consistency in messaging across email and SMS boosts overall effectiveness.
St. Patrick’s Day Marketing Statistics #19 – Households with Children Celebrate More
Families with children are more likely to participate in St. Patrick’s Day traditions. This group tends to spend on decorations, candy, and family activities. Marketers should consider family-friendly campaigns with inclusive messaging. Promotions that highlight shared experiences often resonate with these households. For brands, this demographic represents a reliable and enthusiastic audience.
St. Patrick’s Day Marketing Statistics #20 – Social Media Engagement Peaks During the Holiday
Social media platforms see significant spikes in St. Patrick’s Day content. From memes to parade photos, users actively share their experiences online. Marketers can leverage this by encouraging user-generated content with hashtags and contests. Campaigns that align with trends on Instagram and TikTok gain additional traction. The high engagement proves that St. Patrick’s Day is both a cultural and digital phenomenon.
Turning Insights Into Action
After going through these statistics, I can honestly say that St. Patrick’s Day offers more than just a green-themed marketing boost—it’s a chance to truly connect with audiences in ways that feel festive, authentic, and memorable. What stands out most to me is how people aren’t just buying products; they’re looking for experiences, traditions, and a sense of community. That’s a powerful reminder for all of us as marketers: the campaigns that work best are the ones that tap into that human side of celebration. Personally, I see these numbers as both a guide and an invitation to get creative—because when done right, St. Patrick’s Day marketing can deliver results that last far beyond March 17th.
SOURCES
https://www.nrf.com/research-insights/holiday-data-and-trends/st-patricks-day
https://www.snipp.com/blog/st-patricks-day-marketing-strategies-trends-examples
https://spiegel.medill.northwestern.edu/stpatricksdayconsumers/
https://www.omnisend.com/blog/st-patricks-day-marketing-statistics-tips/
https://sociallypowerful.com/post/st-patricks-day-social-media-campaigns
https://foxecom.com/blogs/all/st-patricks-day-marketing-ideas
https://www.junglescout.com/blog/st-patrick-day-consumer-trends/