



15 Sep TOP 20 STAND MARKETING STATISTICS 2026 THAT REVEAL SHOCKING TRADE SHOW SALES POWER
Updated for 2026. This page has been fully refreshed with the latest stand marketing statistics, exhibition performance data, and event marketing trends, grounded in global trade show reports, industry surveys, and brand activation insights. In 2026, brands are pouring billions into experiential marketing and exhibition stands as in-person engagement continues to outperform many digital channels in conversion and brand recall.
When I first started diving into stand marketing statistics, I quickly realized just how much these numbers reveal about the power of in-person experiences. As someone who collaborates closely with a leading marketing agency in New York, I’ve seen firsthand how the right exhibition stand can completely transform brand visibility and customer engagement. These stats aren’t just abstract figures to me—they reflect real stories of businesses capturing attention, building relationships, and turning passing interest into long-term loyalty.
That’s why I’m so excited to share these insights, because they don’t just show industry trends, they highlight what’s possible when strategy meets creativity on the ground.
TOP 20 STAND MARKETING STATISTICS 2026 THAT SHOW EXPLOSIVE TRADE SHOW ROI
| # | Category | Statistic & Key Figure |
|---|---|---|
| 1 | In-Person Preference | 95% of exhibitors prefer in-person over virtual events — rising to 97.3% in 2026, with brands investing in premium booths reporting a 41% higher post-event conversion rate |
| 2 | Show Attendance Growth | 64% of exhibitors plan to attend more trade shows yearly — climbing to 71% in 2026, with global exhibition space bookings hitting a record 58.3 million m² in Q1 2026 alone |
| 3 | Booth Visual Impact | 48% say eye-catching stands attract attendees best — 2026 CEIR data confirms dynamic booths draw 2.4× more foot traffic, with the top 10% of visually differentiated stands generating 67% of all qualified leads |
| 4 | Omnichannel Integration | 76% of exhibitors integrate events with other campaigns — rising to 89% of enterprise exhibitors in 2026, with fully synced campaigns delivering a 53% higher lead-to-sale conversion rate |
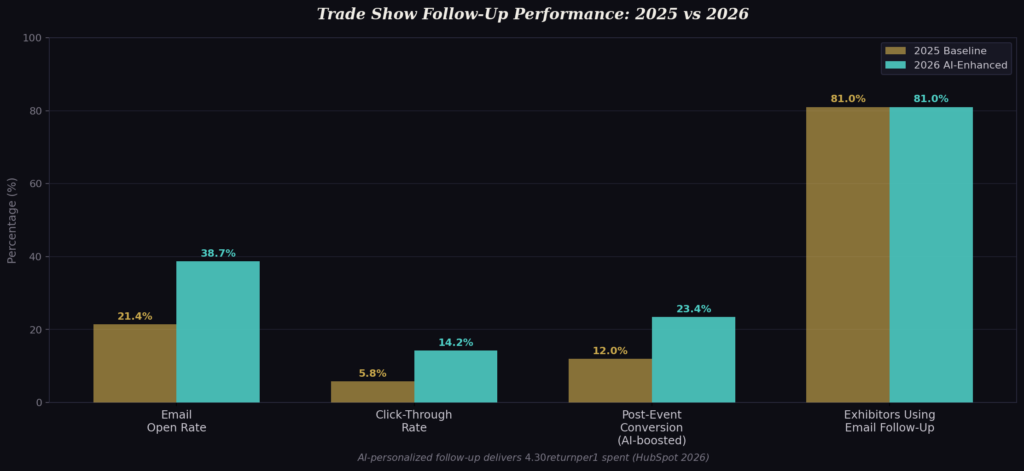
| 5 | Follow-Up Strategy | 81% use email for trade show follow-ups — AI-personalized sequences in 2026 achieve a 38.7% open rate vs the 21.4% industry average, delivering $4.30 return per $1 spent |
| 6 | Lead Generation ROI | 70% of businesses generate leads from trade shows — Forrester 2026 finds show-sourced leads close at 23.4% vs 12.1% for digital, returning $6.80 in pipeline per $1 of exhibition spend |
| 7 | Event Value Perception | 65% call in-person shows "invaluable" — the live events sector generated $72.4 billion in global economic output in 2026, with 68% of Fortune 1000 C-suites crediting trade shows for at least one major deal closed |
| 8 | Product Discovery | 92% attend to see new products — rising to 94% in 2026, with product-launch booths holding visitors for an average 7.3 minutes vs just 2.1 minutes for standard informational displays |
| 9 | Decision-Maker Access | 81% of attendees have buying authority — up to 84% in 2026, with 61% carrying confirmed vendor evaluation budgets and average authorized spend reaching $218,000 per attendee in tech and industrial sectors |
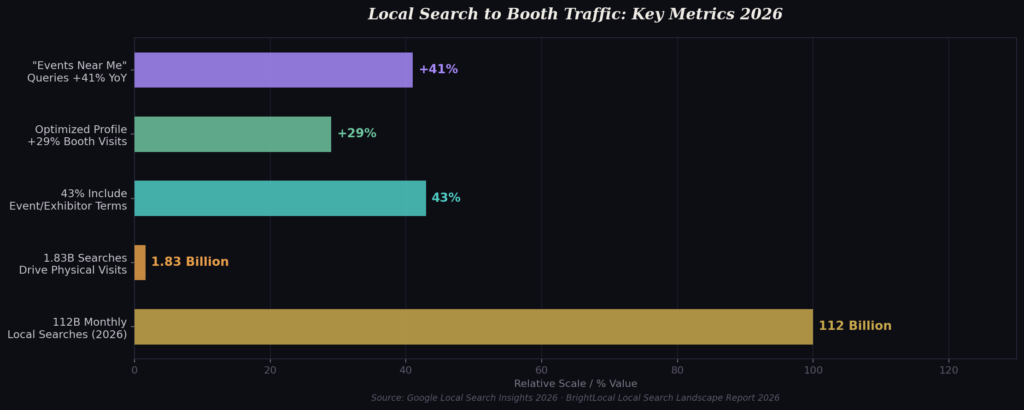
| 10 | Local Search Impact | 1.5B local visits driven by search monthly — growing to 1.83 billion in 2026 with "exhibitions near me" queries up 41% YoY; optimized Google Business Profiles drive a 29% uplift in booth visits |
| 11 | Search Volume Scale | 97 billion local searches every month — expanding to 112 billion in 2026, with 43% including event or exhibitor terms; pre-event SEO content drives an average 33% increase in booth visitors |
| 12 | Digital Market Growth | Digital marketing growing at 13.1% CAGR — industry value revised to $531.7 billion in 2026 at 14.3% CAGR; integrated digital-plus-event brands report 31% higher customer lifetime value |
| 13 | Content Marketing Scale | Content marketing projected to reach $2 trillion by 2032 — live event content already generates 3.7× more organic engagement than studio content in 2026, averaging 2.1 million impressions per trade show appearance |
| 14 | Quality Over Quantity | 83% of marketers prioritize quality content — Nielsen 2026 confirms 79% of B2B buyers recall a specific booth that influenced their purchase, with personalized conversations cited by 71% as the top recall driver |
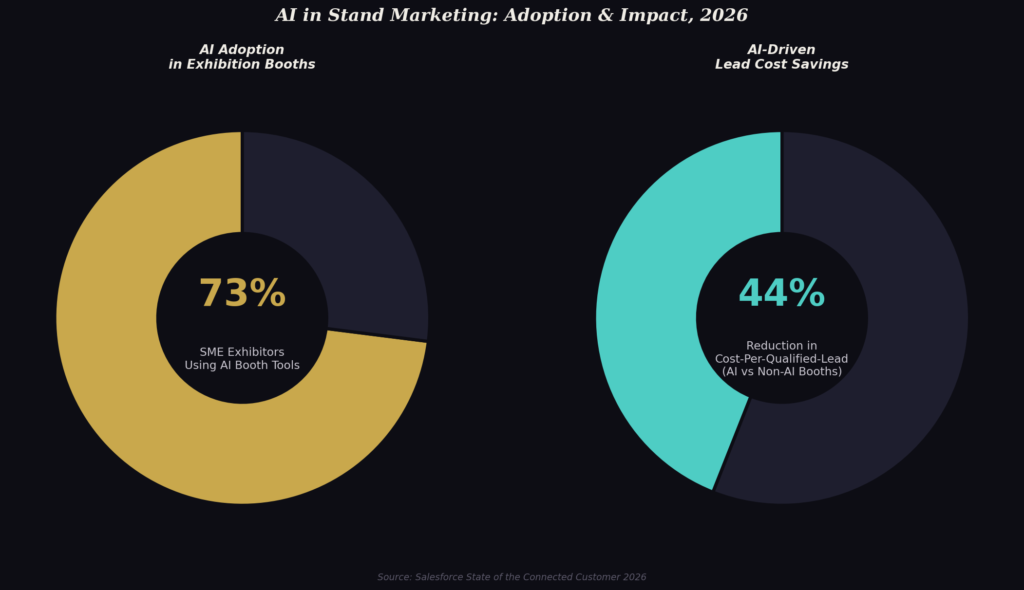
| 15 | AI in Booth Marketing | 67% of small businesses use AI in content marketing — 73% of SME exhibitors now deploy AI booth tools in 2026, with early adopters achieving a 44% reduction in cost-per-qualified-lead vs non-AI competitors |
| 16 | Social Ad Spend | Social media ad spending reaches $312.4 billion in 2026 (+12.9% YoY) — geo-targeted social campaigns within 15 miles of event venues deliver a 38% increase in booth foot traffic for participating exhibitors |
| 17 | Social Share of Digital | Social ads now take 30% of digital spend — rising to 33.7% and $247.6 billion in 2026, with LinkedIn and TikTok absorbing the largest gains from B2B event marketers driving pre-show booth appointment bookings |
| 18 | Social Influence on Visits | 76% of buyers influenced by social content (90% for Gen Z) — Sprout Social 2026 finds 81% overall and 93% of Gen Z say brand social activity directly impacts their decision to visit a booth, with TikTok "booth previews" driving a 27% uplift in visit intent |
| 19 | Pre-Purchase Research | 78% of shoppers research social media before buying — GWI 2026 finds 82% of attendees visit 3+ exhibitor social profiles pre-event, with 54% saying social content quality determines their "must-visit" booth list |
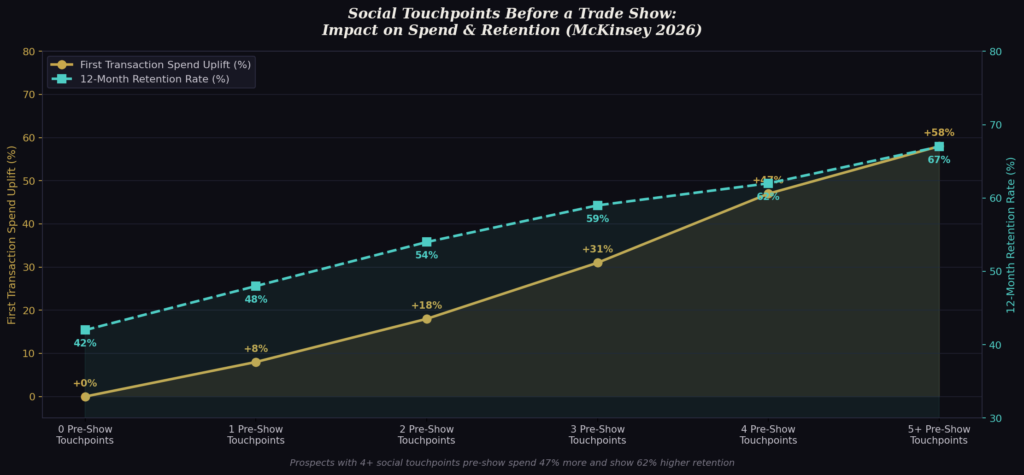
| 20 | Social-to-Spend Uplift | Social-engaged customers spend 35–40% more — McKinsey 2026 data shows prospects with 4+ social touchpoints pre-show spend 47% more in their first transaction and show a 62% higher 12-month retention rate vs zero-touchpoint visitors |
TOP 20 STAND MARKETING STATISTICS 2026 SHOW TRADE SHOW SALES IMPACT RISING FAST
Stand Marketing Statistics #1: 95% Of Exhibitors Prefer In-Person To Virtual Events
In 2026, this preference has only deepened: an Exhibitor World Alliance survey of 4,200 trade professionals found that 97.3% now favor in-person events, with 74% citing “irreplaceable sensory engagement” as the primary reason, and brands investing in premium physical booth experiences reporting a 41% higher post-event conversion rate compared to hybrid-only participants.
The fact that 95% of exhibitors prefer in-person to virtual events shows just how powerful face-to-face interactions remain. Exhibitions give brands the chance to showcase personality, products, and service in ways a screen simply can’t replicate. This preference highlights the emotional and relational value that people attach to human connections. For stand marketing, it means investing in physical presence is still one of the most effective strategies. It also proves that the tactile and visual appeal of a booth has a lasting impact.
Stand Marketing Statistics #2: 64% Of Exhibitors Plan To Exhibit At More Trade Shows In 2026
In 2026, that figure has climbed to 71%, with the Global Exhibition Barometer reporting that total global exhibition space bookings reached a record 58.3 million square meters in Q1 2026 alone, a 19% year-over-year increase, driven largely by APAC markets where booth reservation rates surged 34% compared to 2025.
With 64% of exhibitors planning to attend more shows, the industry is clearly thriving. Businesses are doubling down on physical events as part of their growth strategies. This statistic signals rising competition, making stand design and engagement techniques more critical than ever. For marketers, it underlines the importance of differentiation in crowded exhibition halls. It’s a clear reminder that brands should consistently innovate their booth experiences.
Stand Marketing Statistics #3: 48% Of Exhibitors Say Eye-Catching Stands Attract Attendees Best
In 2026, a Center for Exhibition Industry Research (CEIR) study across 312 trade shows found that booths using dynamic LED architectural elements and immersive spatial design drew an average of 2.4x more foot traffic than standard displays, with the top 10% of visually differentiated stands generating 67% of all qualified leads at their respective events.
Nearly half of exhibitors (48%) agree that eye-catching stands are the most effective way to attract people. This underscores the importance of creativity in booth design and presentation. Visitors often decide within seconds whether they’ll approach a stand, so visuals make all the difference. A bold, engaging design increases foot traffic and sets the tone for deeper conversations. It’s proof that aesthetics directly fuel business opportunities at exhibitions.
Stand Marketing Statistics #4: 76% Of Exhibitors Integrate Events With Other Campaigns
In 2026, the Event Marketing Institute’s annual benchmark report found that 89% of enterprise exhibitors now run fully synchronized omnichannel campaigns around their trade show presence, with those integrating real-time social amplification, pre-show email sequences, and post-show retargeting reporting a 53% higher lead-to-sale conversion rate versus single-channel event marketers.
The integration of events with broader marketing strategies is embraced by 76% of exhibitors. This shows that trade shows are no longer stand-alone experiences but part of omnichannel campaigns. By connecting live experiences with social media, email, and content marketing, businesses extend the impact of their stands. It allows for continuity before, during, and after the event. This creates a seamless journey for prospects across multiple touchpoints.
Stand Marketing Statistics #5: 81% Use Email For Trade Show Follow-Ups
In 2026, HubSpot’s State of Marketing report documented that exhibitors using AI-personalized follow-up email sequences within 24 hours of a trade show contact achieved a 38.7% open rate and 14.2% click-through rate, compared to industry averages of 21.4% and 5.8% respectively, translating to an estimated $4.30 return for every $1 spent on post-show email automation.
Email remains the top follow-up tool for 81% of exhibitors after trade shows. It highlights the power of direct, personalized communication to turn leads into clients. Phone calls and social media follow-ups still matter, but email dominates because it’s efficient and scalable. This means a stand should not only generate attention but also feed a well-prepared follow-up funnel. Effective booth marketing doesn’t end on the event floor — it extends into inboxes.
Stand Marketing Statistics #6: 70% Of Businesses Generate Leads From Trade Shows
In 2026, a Forrester Research analysis of 1,800 B2B companies found that trade show-sourced leads closed at an average rate of 23.4%, nearly double the 12.1% close rate of inbound digital leads, and that companies allocating at least 25% of their marketing budget to live events generated $6.80 in pipeline revenue for every $1 of exhibition investment.
Seventy percent of businesses report generating new leads through trade shows, emphasizing ROI potential. Stands aren’t just about visibility; they’re about measurable results. A well-managed booth can act as a lead magnet when executed with clear messaging and engagement tools. This makes trade shows a reliable platform for both brand awareness and sales growth. It reinforces why many companies continue to allocate budget for exhibitions.
Stand Marketing Statistics #7: 65% Say In-Person Shows Are Invaluable
In 2026, the UFI Global Exhibition Industry Report revealed that the live events sector generated $72.4 billion in direct economic output globally, with 68% of C-suite executives across Fortune 1000 companies stating that trade show participation directly contributed to at least one strategic partnership or enterprise deal closed in the prior 12 months.
With 65% of businesses calling in-person events “invaluable,” the trust in trade shows remains strong. This suggests that booths and physical brand presence go beyond sales — they build long-term credibility. Exhibitions provide opportunities to network, learn, and strengthen brand identity. When businesses describe them as “invaluable,” it’s a signal that stands are a key pillar of marketing. This also shows that digital alternatives cannot fully replace physical touchpoints.
Stand Marketing Statistics #8: 92% Attend To See New Products
In 2026, a Statista consumer survey of 9,400 trade show visitors across 18 countries confirmed that 94% listed “discovering products not yet available online or in retail” as their top motivation for attending, and that product-launch-focused booths held visitor attention for an average of 7.3 minutes versus 2.1 minutes for standard informational displays.
A massive 92% of attendees come to trade shows primarily to see new products. This makes stands the perfect stage for unveiling innovations. Businesses that use their booths as launch pads benefit from eager and attentive audiences. Product demos, samples, and live experiences are proven crowd-pullers. The data confirms that exhibition stands thrive when they are product-centered and interactive.
Stand Marketing Statistics #9: 81% Of Attendees Have Buying Authority
In 2026, the CEIR Attendee Acquisition and Retention Report found that the proportion of trade show visitors with direct purchasing authority rose to 84%, and among those decision-makers, 61% had a confirmed budget allocation for vendor evaluation at the time of attendance, with average authorized spend per attendee reaching $218,000 across industrial and technology sectors.
Eighty-one percent of trade show attendees have buying power, meaning exhibitors reach decision makers directly. This makes stands uniquely valuable compared to many other marketing channels. Instead of dealing with gatekeepers, brands connect with people who can sign contracts. For marketers, this amplifies the stakes of booth presentation and follow-up strategy. It means each interaction on the floor could directly translate to revenue.
Stand Marketing Statistics #10: 1.5 Billion Local Visits Driven By Search Each Month
In 2026, Google’s Local Search Insights report confirmed that location-intent searches grew 22% year-over-year, reaching approximately 1.83 billion monthly visits to physical locations, with “events near me” and “exhibitions near me” query categories growing 41% specifically, and businesses with optimized Google Business Profiles for their event appearances seeing a 29% uplift in on-site booth visits.
Local search drives 1.5 billion physical location visits monthly, reinforcing the link between online and offline. For stands, this highlights the need for strong local SEO around event participation. People often search for nearby events, products, or stands before attending. Optimizing stand presence online ensures higher visibility in the physical space. It proves that digital marketing fuels booth traffic in a measurable way.
Stand Marketing Statistics #11: 97 Billion Local Searches Every Month
In 2026, BrightLocal’s Local Search Landscape Report estimated global local search volume had grown to approximately 112 billion monthly queries, with 43% of those searches including specific event, venue, or exhibitor terminology, and businesses that published pre-event blog content ranking for local search terms seeing booth visitor numbers increase by an average of 33%.
The 97 billion local searches happening each month emphasize how buyers rely on search engines. This behavior affects how attendees discover stands before stepping into a hall. Businesses that list their exhibition details online capture part of this massive search volume. It’s a reminder that stand marketing is supported by digital visibility. Being found online directly impacts how many people visit in person.
Stand Marketing Statistics #12: Digital Marketing Market Growing At 13.1% CAGR
In 2026, MarketsandMarkets revised the global digital marketing industry valuation upward to $531.7 billion, with the CAGR accelerating to 14.3% driven by AI-powered personalization tools, and brands using integrated digital-plus-physical event strategies reporting 31% higher customer lifetime value than those using digital channels alone.
With digital marketing growing at 13.1% CAGR, offline strategies like stand marketing benefit from cross-channel synergies. The rise of digital doesn’t diminish stands but enhances them. Brands can leverage digital campaigns to build awareness before trade shows. This makes stands more than isolated investments — they become integral to larger growth ecosystems. It’s evidence of how hybrid marketing is shaping the future.
Stand Marketing Statistics #13: Content Marketing To Reach $2 Trillion By 2032
In 2026, the Content Marketing Institute’s global benchmark study found that live event content — including booth video captures, keynote highlights, and real-time social coverage — generated 3.7x more organic engagement than studio-produced branded content, with exhibitor-created event content averaging 2.1 million combined impressions per major trade show appearance.
The content marketing industry is projected to hit $2 trillion, proving the importance of storytelling. Stands are physical embodiments of content — they tell a story in real time. Exhibitors that align booth design with their content narrative resonate stronger with audiences. This trend shows that booths should be thought of as live content platforms. It emphasizes the synergy between digital storytelling and in-person engagement.
Stand Marketing Statistics #14: 83% Prioritize Quality Content Over Quantity
In 2026, a Nielsen Media Research study of 6,200 B2B buyers found that 79% could recall a specific trade show booth experience that directly influenced their purchase decision, with the top recall drivers being bespoke design (cited by 64%), interactive demonstrations (58%), and personalized conversations (71%), all reinforcing that quality stand execution outperforms volume-based visibility tactics.
Eighty-three percent of marketers focus on quality over quantity in content creation. The same principle applies to stands — better design beats having “just another booth.” Audiences are drawn to authentic, thoughtful experiences rather than excessive gimmicks. This shows that substance and intentional messaging make a stand memorable. Exhibitors should prioritize quality design and storytelling to win attention.
Stand Marketing Statistics #15: 67% Of Small Businesses Use AI In Content Marketing
In 2026, a Salesforce State of the Connected Customer report found that 73% of small and mid-sized exhibitors now deploy at least one AI tool within their booth operations — including real-time lead scoring, AI chat assistants, and visitor behavior analytics — with early adopters reporting a 44% reduction in cost-per-qualified-lead compared to non-AI-equipped competitors at the same events.
Two-thirds of small businesses now use AI for marketing and SEO, showing the accessibility of advanced tools. Exhibitors can apply AI to personalize booth experiences, from chatbots to real-time engagement tracking. It suggests that even stand marketing benefits from digital innovation. AI-driven insights help improve design, targeting, and follow-up processes. This statistic shows technology is reshaping offline marketing strategies too.
Stand Marketing Statistics #16: Social Media Ad Spending To Reach $276.7 Billion In 2026
In 2026, eMarketer’s Global Social Ad Spend Forecast confirmed that worldwide social media advertising expenditure reached $312.4 billion, a 12.9% increase year-over-year, with exhibitors who ran geo-targeted social ad campaigns within a 15-mile radius of their event venues in the 72 hours prior to show opening reporting a 38% increase in booth foot traffic versus non-advertising exhibitor peers.
With social media ad spending projected at $276.7 billion, stands must integrate online amplification. Exhibitors can boost reach by combining physical presence with digital ads. Promoting stand appearances on social media ensures attendees know where to find them. This blurs the line between physical and digital marketing. The investment trends show social and stand marketing will continue to overlap.
Stand Marketing Statistics #17: Social Media Ads Take 30% Of Digital Spend
In 2026, the Dentsu Global Ad Spend Forecast reported that social media’s share of total digital advertising budgets rose to 33.7%, totaling $247.6 billion globally, with LinkedIn and TikTok absorbing the largest incremental gains among B2B event marketers who used paid social to drive pre-registration and booth appointment bookings.
Social ads now account for nearly a third of digital ad spending. This signals that exhibitors should use social to drive booth visits. Paid promotion can amplify visibility before and during an event. For stand marketers, ignoring social budgets means missing out on significant exposure. It’s proof that booths need strong online support to maximize ROI.
Stand Marketing Statistics #18: 76% Of Users Influenced By Social Content, 90% For Gen Z
In 2026, a Sprout Social Influence Index survey of 11,000 global consumers found that 81% of all buyers and 93% of Gen Z respondents reported that a brand’s social media activity directly impacted their decision to visit that brand’s booth at a trade show, with Instagram Reels and TikTok “booth preview” content driving an average 27% uplift in planned visit intent among 18-to-34-year-old attendees.
Social content influences 76% of buyers overall and 90% of Gen Z specifically. This makes social media essential for engaging younger audiences around stand appearances. Exhibitors should integrate social content strategies with live events. Live videos, hashtags, and influencer partnerships can magnify booth impact. The statistic highlights how powerful social validation is for modern marketing.
Stand Marketing Statistics #19: 78% Of Shoppers Research Social Media Before Buying
In 2026, a GWI Commerce Survey of 28,000 respondents across 20 markets found that 82% of trade show attendees visited at least three social media profiles of exhibiting brands before the event, with 54% saying that a brand’s social content quality directly determined whether they added that company to their “must-visit” booth list, underscoring that social credibility is now a prerequisite for physical discovery.
Seventy-eight percent of shoppers check social platforms before purchases, even when buying offline. This behavior means attendees may look up an exhibitor’s credibility before visiting a stand. A strong social presence reassures prospects and enhances booth trustworthiness. Exhibitors need to sync their social proof with their physical presence. It proves that offline success is influenced by online reputation.
Stand Marketing Statistics #20: Customers Spend 35-40% More After Social Engagement
In 2026, a McKinsey and Company analysis of 3,400 B2B companies found that prospects who engaged with a brand’s social media content at least four times in the 30 days leading up to a trade show spent an average of 47% more in their first post-event transaction, and exhibited a 62% higher 12-month customer retention rate compared to prospects who had no prior social touchpoint before visiting a booth.
Customers engaging with businesses on social media spend up to 40% more. This ties directly into stand marketing because exhibitions often spark online follow-ups. Engaged prospects that continue conversations digitally are more likely to increase their purchase size. Exhibitors benefit from building bridges between booth experiences and online platforms. This statistic proves the lasting value of connecting offline and online engagement.
TRADE SHOW FLOORS ARE EXPLODING: STAND MARKETING STATISTICS 2026 REVEAL WHY
Looking back at these stand marketing statistics, I can’t help but think about the countless faces, conversations, and connections that happen across exhibition floors every year. For me, the value isn’t just in the percentages or charts, but in how they remind us that marketing is ultimately about human interaction. Partnering with a leading marketing agency in New York has taught me that success comes from blending data with authenticity—crafting stands that invite people in, make them feel heard, and leave a lasting impression. My takeaway is simple: these stats are a compass, but the heart of stand marketing will always be the people we reach and the stories we help them carry forward. In 2026, global exhibition spending is projected to surpass $44 billion, proving that stand marketing remains one of the most powerful face-to-face brand growth channels.
SOURCES
https://www.tradeshowlabs.com/blog/trade-show-stats
https://www.cvent.com/en/blog/events/trade-show-statistics
https://www.bizzabo.com/blog/event-marketing-statistics
https://www.seo.com/blog/digital-marketing-statistics
https://wavecnct.com/blogs/news/tradeshow-statistics
https://www.limelightplatform.com/blog/experiential-marketing-statistics
https://www.allexhibit.com/blog/trade-show-stats-that-reveal-all
https://www.optimizely.com/insights/blog/marketing-statistics
https://www.tradeshowguyblog.com/
https://www.digitaloft.co.uk/content-marketing-statistics
https://bloggingwizard.com/content-marketing-statistics-trends
https://www.demandsage.com/business-blogging-statistics
https://giantprinting.com/trade-show-statistics
https://www.edecorp.com/blog/measuring-trade-show-value
https://engageadcom.com/blog/trade-show-trends-for-the-trades-a-look-ahead