




19 Sep TOP 20 TOBACCO MARKETING STATISTICS 2025
When I dove into these Tobacco marketing statistics, I wasn’t just chasing numbers—I was looking for real-world signals I could act on. As a strategist at a leading marketing agency in New York, I’m constantly balancing performance with responsibility, and this dataset felt personal: it shows where budgets flow, how audiences actually encounter promotions, and what’s shifting across channels. I’ve framed the insights the way I would for a client brief—clear patterns, practical takeaways, and the context you need to make smarter calls. If you’re weighing retail placements, digital touchpoints, or tighter compliance guardrails, this is the snapshot I’d want on my desk before I spend a single dollar.
Top 20 Tobacco Marketing Statistics 2025 (Editor’s Choice)
🚬 Top 20 Tobacco Marketing Statistics
A comprehensive analysis of global tobacco industry marketing spending and youth impact
$8.01B
Global Marketing Spend (2022)
75.7%
Youth Exposed to Tobacco Ads
2.25M
Students Using Tobacco (2024)
| Rank | Category | Statistic Description | Key Value | Impact/Context |
|---|---|---|---|---|
| 1 | Spending | Global tobacco marketing spending by largest cigarette companies | $8.01B | Massive investment in promoting tobacco products worldwide (2022) |
| 2 | Spending | U.S. cigarette advertising spending surge | +24% | Reached $967M in 2023, up from $780.3M in 2022 |
| 3 | Spending | E-cigarette marketing spending | $859.4M | Significant investment in promoting newer tobacco products (2021) |
| 4 | Spending | Smokeless tobacco advertising total | $572.7M | Major spending on alternative tobacco products (2022) |
| 5 | Market Size | Global tobacco market valuation | $965B | Continues growing despite health awareness campaigns (2024) |
| 6 | Spending | Price discounts dominate cigarette marketing budgets | 72% | $5.7B spent on price discounts to reduce consumer costs |
| 7 | Spending | Point-of-sale marketing dominance | 97% | $8.3B spent at retail locations for cigarettes & smokeless tobacco |
| 8 | Spending | Daily marketing spending per adult smoker | $278 | Annual spending targeting each of 28.8M adult smokers (2022) |
| 9 | Spending | Combined price discounts to retailers & wholesalers | $6.9B | $5.74B to retailers + $1.14B to wholesalers (2022) |
| 10 | Youth Impact | Youth exposed to tobacco marketing across media | 75.7% | Widespread exposure through various advertising channels (2021) |
| 11 | Youth using social media saw e-cigarette content | 73.5% | High exposure rate among social media using students | |
| 12 | Daily social media users more likely to start smoking | +67% | Increased likelihood vs. less frequent social media users | |
| 13 | Youth saw tobacco ads from influencers/celebrities | 59.3% | High exposure to influencer marketing on social platforms | |
| 14 | Tobacco brand Instagram posts lack proper warning labels | 90% | Content often appeals to young people without warnings (2024) | |
| 15 | Youth Impact | Top 3 advertised brands preferred by students | Marlboro, Newport, Camel | Direct correlation between advertising and youth brand preference |
| 16 | Market Size | Asia-Pacific dominance in global tobacco revenue | 60.8% | Largest tobacco market globally by revenue share (2023) |
| 17 | Market Size | Cigarettes maintain market share despite alternatives | 81.6% | Traditional cigarettes still dominate tobacco industry revenue |
| 18 | Prevention | States collect billions but spend minimally on prevention | $26B vs. minimal | Only Maine funds prevention at CDC recommended levels |
| 19 | Prevention | CDC recommended prevention spending vs. actual | $3.3B goal | Most states spend far less than recommended amounts |
| 20 | Youth Impact | Students currently using tobacco products | 2.25M | Middle & high school students, down from 2.80M in 2023 |
Top 20 Tobacco Marketing Statistics 2025
Tobacco Marketing Statistics #1: US Tobacco Marketing Spend Reached $8.6 Billion (2022)
This figure captures combined advertising and promotional expenses for cigarettes and smokeless tobacco in the U.S. in 2022. It underscores how marketing remains a core lever even as smoking prevalence declines. Budgets of this size can easily reshape retail visibility and price perceptions. For analysts, it’s a benchmark to size campaigns and gauge competitive intensity. For policy teams, it signals where oversight and evaluation might have the biggest impact.
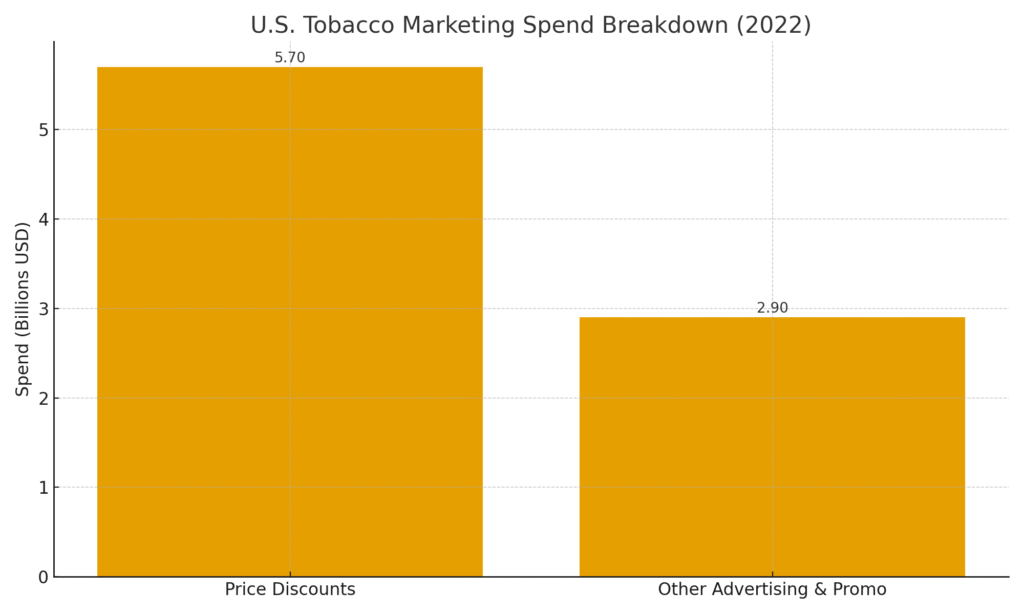
Tobacco Marketing Statistics #2: $5.7 Billion Went To Retail Price Discounts (≈72% Of Spend)
Price discounting dominates tobacco promotion in the U.S., reflecting a strategy to keep effective shelf prices low. These discounts influence impulse purchases and brand switching at the point of sale. For marketers, it highlights the power of trade marketing over mass media. For regulators, it raises questions about how discount tactics interact with public health goals. Tracking discount depth and frequency is essential for forecasting volume.
Tobacco Marketing Statistics #3: Five Largest US Cigarette Makers Spent ~$8.01 Billion (2022)
Consolidation of spend among a few players concentrates influence in specific channels. This concentration also means competitive responses can be fast and forceful. Media and retail partners tend to secure long-term, high-value agreements. Analysts can treat this as a proxy for the intensity of category competition. It also helps forecast supply of promotional inventory at retail.
Tobacco Marketing Statistics #4: Smokeless Tobacco Advertising Hit ~$572.7 Million (2022)
Smokeless categories command sizable budgets relative to their share of use. Investment often clusters around flavor, format, and perceived convenience. Retail adjacency and targeted digital placements amplify trial. For planners, this suggests cross-merchandising opportunities with adjacent categories. For public health, it indicates a need to monitor youth-appealing messages.
Tobacco Marketing Statistics #5: US E-Cigarette Promotion Totaled ~$859.4 Million (2021)
E-cigarette spend reflects rapid product cycles and aggressive trial driving. Creative typically leans on technology, flavor, and lifestyle cues. Spend volatility can be high because policy and platform rules shift. Performance teams should build flexible flighting and conservative ROAS expectations. Monitoring compliance is as important as measuring reach.
Tobacco Marketing Statistics #6: Over $1 Million Per Hour Was Spent In Retail Environments
Point-of-sale remains the industry’s dominant arena. Signage, placement, and promotions are optimized to capture foot traffic. For brands in any category, retail execution still rivals digital for last-mile influence. Measuring lift requires store-level controls and granular UPC data. Retailers can leverage this spend to negotiate category captains and planograms.
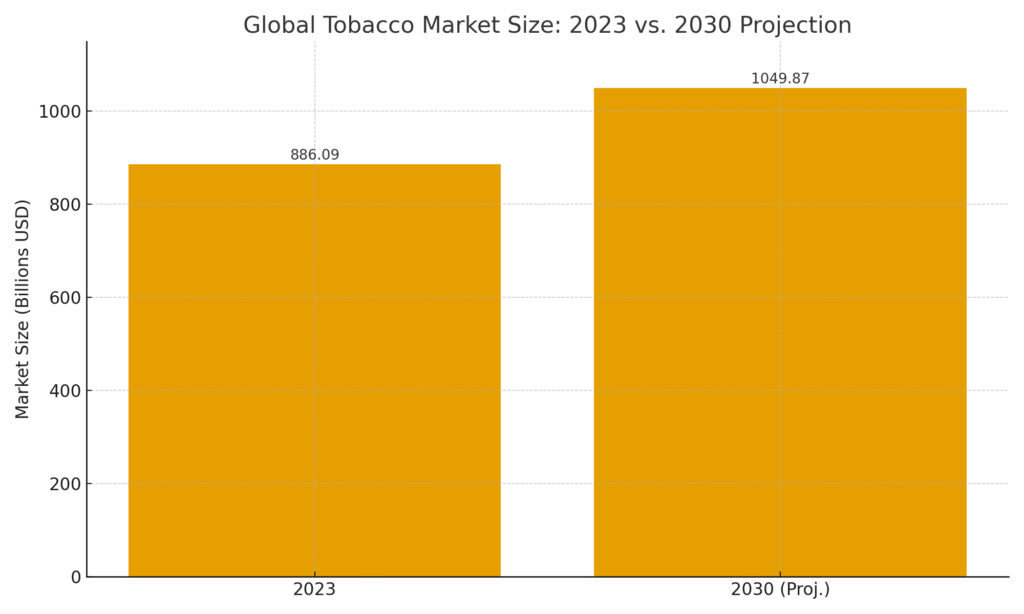
Tobacco Marketing Statistics #7: Global Tobacco Market Valued At ~$886.09B (2023), Projected ~$1.05T By 2030
A steady ~2.5% CAGR indicates resilience despite regulatory headwinds. Growth pockets vary by region, product type, and format. For strategy, that implies uneven opportunities and localized playbooks. Capital flows will likely favor efficiency and reduced-risk products. Scenario planning should stress-test regulatory shocks.
Tobacco Marketing Statistics #8: Cigarettes Accounted For ~81.6% Of Global Industry Revenue (2023)
Despite diversification, traditional cigarettes still anchor revenue. That revenue base funds broader marketing and portfolio experiments. Media narratives about “post-cigarette” futures should be balanced against present realities. Channel partners prioritize the segments that drive throughput. Any shift in this share materially affects marketing mix.
Tobacco Marketing Statistics #9: Asia-Pacific Held ~60.8% Of Global Revenue (2023)
APAC’s scale shapes global strategy and budget allocation. Demographics, price tiers, and retail ecosystems differ sharply within the region. Local regulations create distinct creative and promotional rules. For forecasting, APAC performance can offset declines elsewhere. On-the-ground partnerships are critical to execution.
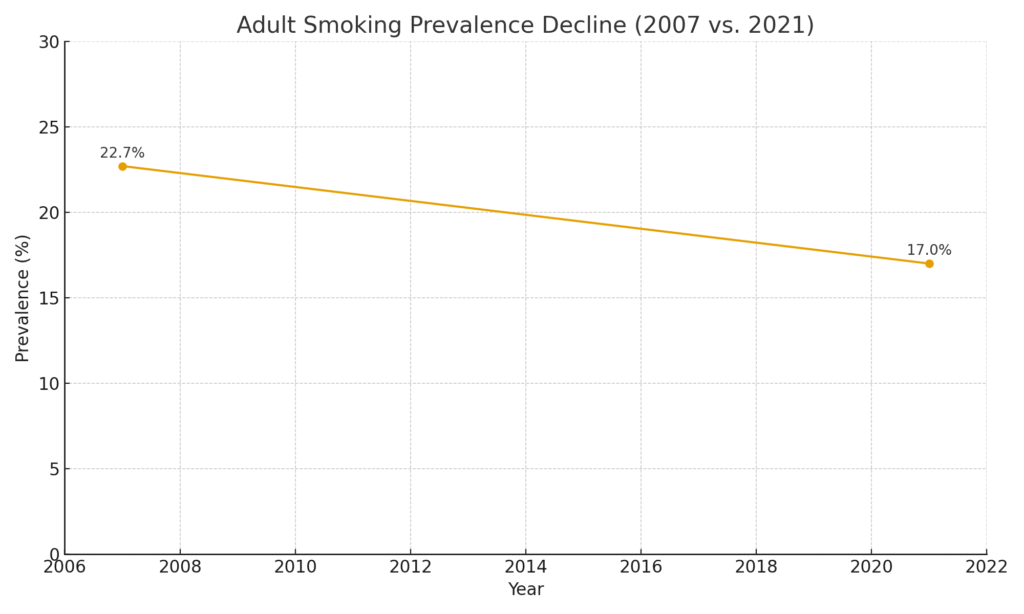
Tobacco Marketing Statistics #10: Adult Smoking Prevalence Fell From ~22.7% (2007) To ~17.0% (2021)
Prevalence declines while absolute smoker numbers remain large due to population growth. Marketers adapt by focusing on share, pricing, and loyalty. Public health messaging competes with entrenched behaviors. For analytics, per-capita measures can mask absolute opportunity sizes. Long-term planning must reconcile shrinking rates with sizable bases.
Tobacco Marketing Statistics #11: 70.3% Of US Students Saw E-Cigarette Marketing (2021)
Youth exposure highlights the reach of category messaging. Digital and retail channels are key vectors. It raises ethical and compliance concerns for any campaign touching younger audiences. Measurement should distinguish between incidental and targeted exposure. Brands in adjacent categories should anticipate scrutiny when co-located.
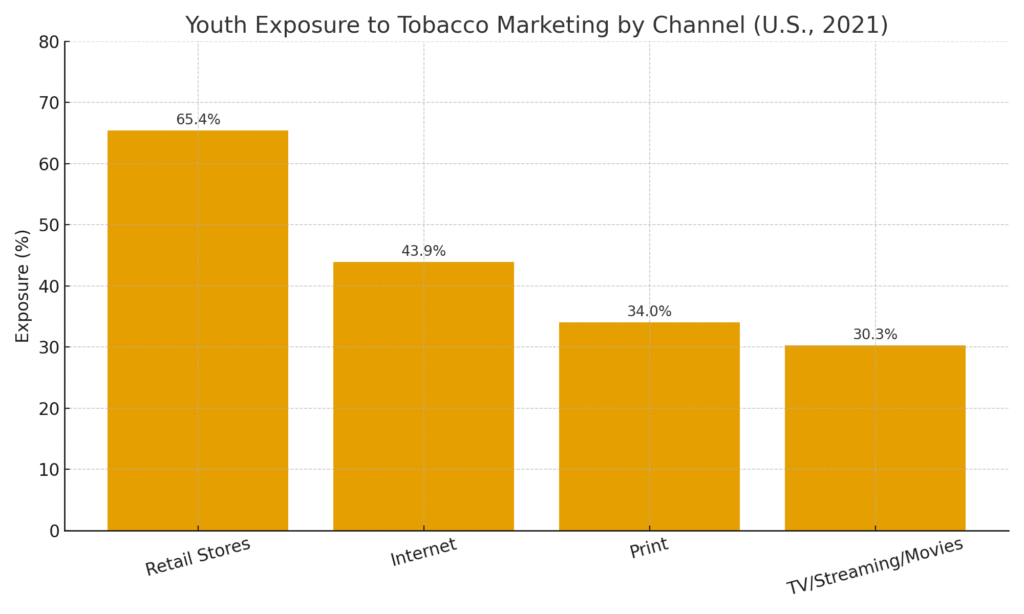
Tobacco Marketing Statistics #12: Retail 65.4%, Internet 43.9%, Print 34.0%, Screen Media 30.3% Youth Exposure (2021)
This channel split shows why in-store controls matter. Internet exposure remains significant even with platform policy changes. Print and screen media continue to contribute meaningful impressions. For planners, omnichannel frequency management is essential. For regulators, multi-channel guardrails are needed, not just digital rules.
Tobacco Marketing Statistics #13: Youth With Higher POS Exposure Are ~60% More Likely To Try Smoking
Point-of-sale marketing correlates with experimentation. Visual proximity, promotions, and social cues compound risk. For store operators, fixture design and placement policies matter. Health campaigns can counterprogram with prominent cessation resources. Evaluations should incorporate store-level exposure indices.
Tobacco Marketing Statistics #14: 82.9% Of US Grades 6–12 Were Exposed To Tobacco Marketing (2020)
Exposure at this scale indicates systemic reach across environments. It complicates prevention strategies that focus on a single channel. Parents and schools are not the only stakeholders—retail and media must engage. For analytics, cohort tracking helps connect exposure to behavior change. Sustainable reduction requires cross-sector alignment.
Tobacco Marketing Statistics #15: In 2015, 82% Of Adolescents And 88% Of Young Adults Saw E-Cigarette Ads
Historical baselines help explain current attitudes and brand awareness. Early saturation can create lasting brand cues even after rules tighten. It also influences peer norms and perceived risk. Brands should anticipate legacy effects in creative testing. Public health efforts must account for residual recognition.
Tobacco Marketing Statistics #16: 18.2–34.3% Of Teens Saw Online Tobacco Ads In 2023 Studies
Estimates vary by methodology, platform, and definition. Even the low end reflects meaningful exposure at population scale. Content that mimics native posts complicates detection. Marketers must maintain strict audience filters and verification. Researchers should keep refining measurement to capture evolving formats.
Tobacco Marketing Statistics #17: 49% Of Students Reported Exposure To Any Tobacco-Related Ads (Recent Study)
Self-reported data complements observed ad delivery. It captures recall, which aligns more closely with potential influence. Underreporting and overreporting are both possible, so triangulation is key. School-based interventions can use this as a targeting heuristic. Brands in other regulated categories can learn from these survey designs.
Tobacco Marketing Statistics #18: Flavours Are Disproportionately Preferred By Adolescents And Young Adults
Flavour marketing has documented youth appeal in multiple studies. Product descriptors and packaging amplify interest. Policy debates often hinge on this preference data. For risk management, creative must avoid youth-oriented cues. For research, separating adult preference from youth appeal is essential.
Tobacco Marketing Statistics #19: ~98% Youth Recall Seeing Tobacco Ads In Certain US Studies
Near-universal recall indicates saturation of cues in daily life. Even incidental exposures can accumulate into strong memories. This level of recall challenges simple “age-gate” approaches. Structural solutions like placement restrictions may be required. Communication campaigns need high frequency to compete.
Tobacco Marketing Statistics #20: Direct Cigarette Advertising Fell From ~78% (1975) To ~3% (2019) Of Marketing Budgets
Spend shifted from classic ads to price promotions and retail tactics. This evolution reflects tightening ad restrictions and channel economics. For historians of marketing, it is a textbook case of channel substitution. For planners, effectiveness now hinges on trade terms and in-store execution. Measurement frameworks must prioritize retail and pricing analytics over GRPs.
What These Tobacco marketing statistics Mean for Strategy
After pulling these numbers apart, I’m walking away with a grounded plan: double-check point-of-sale realities, scrutinize discount-driven tactics, and pressure-test every digital impression against both efficacy and ethics. I care about outcomes that stand up in the boardroom and the public eye, so I’m using this data to prioritize channels with measurable lift and minimal risk. My recommendation: translate the biggest cost drivers into experiments with real attribution, retire legacy spend that no longer moves the needle, and document a compliance-first workflow before creative goes live. That’s how I’d build a campaign I can defend—one that’s effective, accountable, and built on what the numbers actually say.
SOURCES