




27 Sep TOP 20 TRUCK DELIVERY MARKETING STATISTICS 2025
When I first started researching truck delivery marketing statistics, I realized how powerful these insights are for anyone trying to understand the future of logistics, advertising, and consumer expectations. As someone who values data-driven decision-making, I wanted to put together numbers that not only show where the trucking industry stands today but also where it’s heading in the coming years. Partnering with a leading marketing agency in New York has taught me how essential it is to interpret these figures with a practical, creative lens—turning data into actionable strategies that resonate with both businesses and consumers. In this blog, I’m excited to share the top 20 stats that shed light on growth, technology adoption, cross-border activity, and even truckside advertising opportunities. These aren’t just numbers—they’re a story about how trucking continues to fuel economies and deliver marketing potential on wheels.
Top 20 Truck Delivery Marketing Statistics 2025 (Editor’s Choice)
🚚 Top 20 Truck Delivery Marketing Statistics 2025
Essential insights driving the logistics and delivery industry forward
| # | Category | Key Statistic |
|---|---|---|
| 1 | Market Size | Global trucking industry valued at $2.2 trillion in 2025, expected to reach $3.4 trillion by 2030 |
| 2 | Market Revenue | U.S. trucking market generates $940.8 billion in gross freight revenue |
| 3 | Market Growth | Truck volumes expected to grow 1.6% in 2025, rising to nearly 14 billion tons by 2035 |
| 4 | Freight Volume | Total truck tonnage will rise from 11.27 billion tons in 2024 to 13.99 billion tons in 2035 |
| 5 | Market Dominance | Trucking industry moves over 72% of the nation's freight by weight, hauling 11+ billion tons annually |
| 6 | Last-Mile Delivery | Global last-mile delivery market growing from $176.99 billion in 2025 to $373.92 billion by 2033 (CAGR 9.8%) |
| 7 | Delivery Costs | Last-mile delivery accounts for 53% of total delivery costs in logistics |
| 8 | Consumer Expectations | 66% of consumers now expect same-day delivery, especially for online shopping |
| 9 | Delivery Priority | Over 40% of American consumers prioritize fast and reliable delivery when shopping online |
| 10 | Brand Loyalty | 98% of consumers say delivery experience impacts their brand loyalty |
| 11 | Electric Trucks | Electric truck market jumping from $5.9 billion in 2025 to nearly $39 billion by 2032 |
| 12 | Autonomous Delivery | Autonomous last-mile delivery market projected to reach $4.96 billion by 2030 |
| 13 | Delivery Software | Last-mile delivery software market growing from $4.1 billion (2024) to $7.4 billion by 2032 (CAGR 7.26%) |
| 14 | EV Adoption | Electric trucks expected to make up about 2% of all vehicles on the road by 2025 |
| 15 | Failed Deliveries | Approximately 5% of last-mile deliveries fail, costing an average of $17.78 each |
| 16 | Driver Shortage | Over 3 million driver positions left unfilled globally due to severe shortages |
| 17 | Fleet Orders | Class 8 tractor orders down -42.7% year-over-year in Q2 2025, indicating financial strain |
| 18 | Customer Satisfaction | Less than 50% of digital shoppers say retailers meet their delivery expectations |
| 19 | E-Commerce Growth | E-commerce market revenue projected at $4,117 billion in 2024, growing 9.49% annually through 2029 |
| 20 | Delivery Performance | Amazon delivered over 9 billion items same/next day in 2024; Prime members saved $95 billion on delivery |
Top 20 Truck Delivery Marketing Statistics 2025
Truck Delivery Marketing Statistics #1: Global Freight Trucking Market Size At $2.2 Trillion In 2025
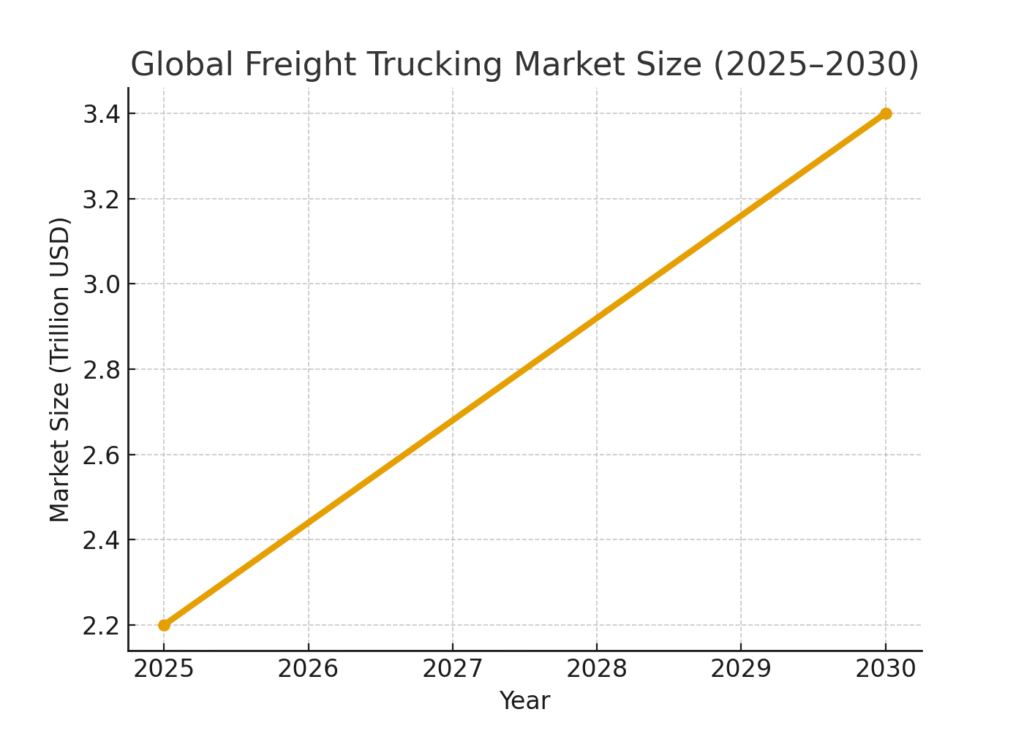
The global freight trucking market is valued at $2.2 trillion in 2025, showcasing just how massive the industry has become. This figure reflects the essential role trucking plays in keeping global supply chains running smoothly. With a projected rise to $3.4 trillion by 2030, the market is growing at a CAGR of around 5.4%. These numbers highlight the steady demand for trucking services across industries worldwide. For marketers, this scale signals a powerful opportunity to position trucking not just as transportation, but as a global business enabler.
Truck Delivery Marketing Statistics #2: U.S. Trucking Market Valued At $532.7 Billion In 2025
The U.S. trucking market is estimated at $532.7 billion in 2025, making it one of the largest trucking sectors in the world. This massive figure underscores the dominance of trucking in North America’s logistics ecosystem. As one of the biggest consumers of goods, the U.S. heavily relies on trucks to move freight efficiently. This level of economic weight also means brands in the trucking sector have unmatched reach. For delivery marketing, tapping into such a large market presents a direct link to consumer spending patterns.
Truck Delivery Marketing Statistics #3: Trucks Move 72.7% Of U.S. Freight By Weight
In 2024, trucks were responsible for moving 72.7% of all freight by weight in the United States. This statistic demonstrates the trucking industry’s irreplaceable role in logistics. Despite advancements in rail, sea, and air, trucking remains the backbone of U.S. transportation. The ability of trucks to reach remote areas ensures inclusivity in freight delivery. Marketers should recognize that this dominance makes trucking a critical point for both B2B and consumer-facing strategies.
Truck Delivery Marketing Statistics #4: 96% Of Fleets Operate With 10 Or Fewer Trucks
Nearly 96% of U.S. trucking fleets operate with 10 or fewer trucks. This reflects how fragmented the trucking market is, dominated by small businesses and independent operators. For marketers, it means strategies must often be designed to appeal to smaller players, not just massive corporations. It also shows how local entrepreneurs power this vital sector. The importance of small fleets cannot be understated when considering the reach and diversity of the trucking industry.
Truck Delivery Marketing Statistics #5: Electric Truck Industry Valued At $5.92 Billion In 2025
The electric truck industry is valued at $5.92 billion in 2025, with projections to hit nearly $38.8 billion by 2032. This growth represents a huge shift toward sustainability in logistics. Electric trucks not only reduce emissions but also reshape operational cost structures. Companies that embrace electric fleets are positioning themselves as environmentally responsible while saving in the long run. For marketers, these figures show a growing narrative that combines eco-friendliness with profitability.
Truck Delivery Marketing Statistics #6: Same-Day Delivery Market Worth $14.7 Billion In 2025
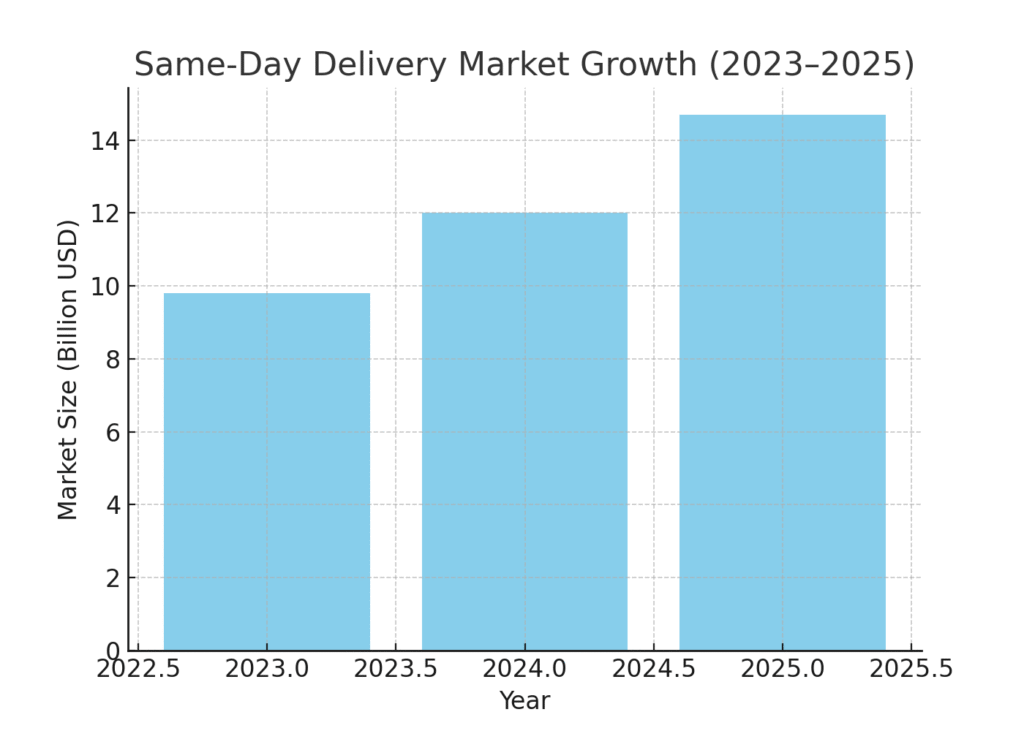
Globally, the same-day delivery market is projected to reach $14.7 billion in 2025. This figure highlights the rising expectations of consumers who demand speed and efficiency. The CAGR of over 20% emphasizes the pace of change in consumer behavior. Businesses investing in faster trucking solutions are aligning with this demand. For marketers, the key is connecting convenience with reliability in messaging strategies.
Truck Delivery Marketing Statistics #7: Last-Mile Delivery Market Growth Expected
The last-mile delivery sector is experiencing explosive growth, driven by e-commerce demand. This part of the supply chain has become one of the most expensive and challenging to manage. Innovations like route optimization and real-time tracking are helping ease costs. Still, last-mile remains a critical focus for both logistics firms and brands. For marketers, it’s an opportunity to highlight efficiency, transparency, and customer satisfaction.
Truck Delivery Marketing Statistics #8: 63% Of Logistics Professionals Report Higher Demand
Around 63% of logistics professionals reported increased demand for trucking services in the past year. This reflects the booming need for freight delivery as economies recover and e-commerce grows. Rising demand often puts pressure on pricing and capacity. It also pushes companies to scale up quickly. For marketers, showcasing reliability in high-demand conditions builds trust with customers.
Truck Delivery Marketing Statistics #9: 85% Of Logistics Businesses Operate At Or Near Full Capacity
Nearly 85% of logistics businesses are running at or near full capacity. This indicates how stretched resources in the trucking industry have become. High utilization rates suggest growing opportunities but also operational stress. For marketers, the challenge is balancing efficiency with realistic promises. Full-capacity statistics reinforce the need for smarter solutions in delivery logistics.
Truck Delivery Marketing Statistics #10: 43% Of Firms Cite Reliable Delivery As Top Pressure
For 43% of logistics companies, ensuring reliable delivery is the greatest pressure point. Customers expect deliveries to be on time, regardless of market challenges. This adds significant stress to trucking firms managing routes and deadlines. Marketing campaigns that emphasize reliability resonate strongly with customer concerns. It’s a clear signal that trust in delivery speed and accuracy is a competitive advantage.
Truck Delivery Marketing Statistics #11: U.S. Truckload Spot Rates Up 6.5% YoY In Q2 2025
In Q2 2025, U.S. truckload spot rates increased 6.5% year-over-year. Rising rates reflect increased demand and sometimes capacity shortages. Spot market rates are often more volatile than contract rates. For trucking businesses, this creates both opportunities and risks. Marketers can leverage this data to showcase value-added services that offset price fluctuations.
Truck Delivery Marketing Statistics #12: Contract Trucking Rates Up 1.1% YoY In Q2 2025
In the same period, contract trucking rates rose 1.1% compared to the previous year. These smaller increases reflect the relative stability of long-term agreements. Contract rates offer predictability for both shippers and carriers. The contrast with spot rates shows why contracts remain attractive in volatile markets. Marketers can highlight contract stability as a reassurance to clients.
Truck Delivery Marketing Statistics #13: U.S. Cross-Border Freight Hits $144.8 Billion In March 2025
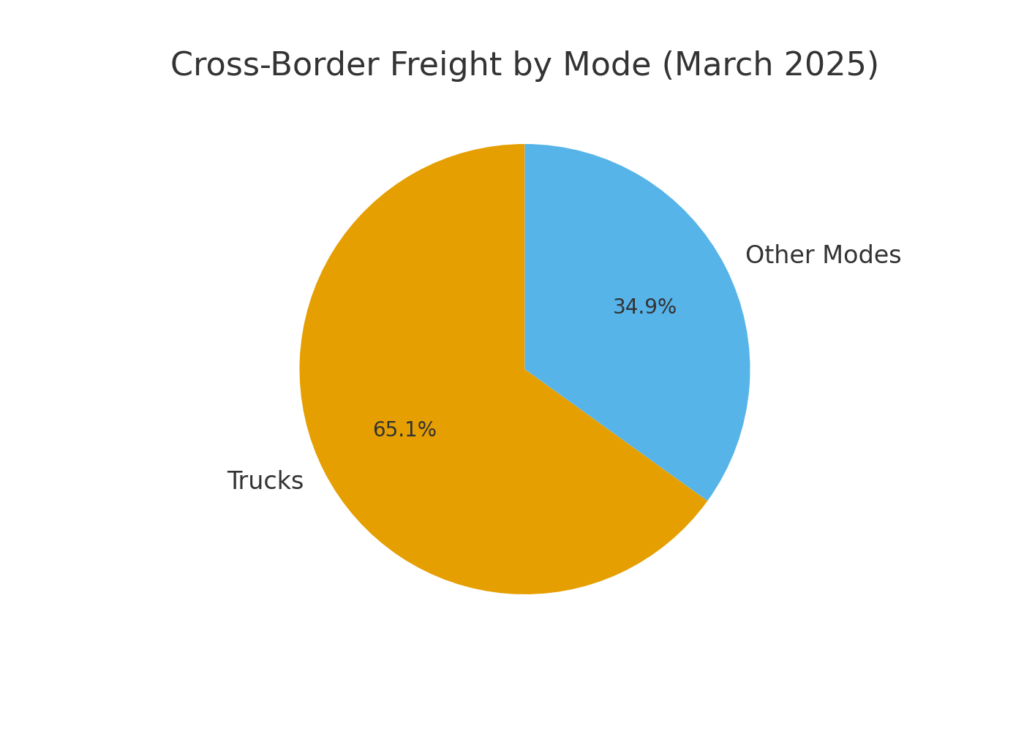
Cross-border U.S. freight shipments with Canada and Mexico reached $144.8 billion in March 2025. This was an 8.4% increase compared to the same month in 2024. Trucks played a massive role in these exchanges. Strong cross-border trucking highlights the importance of regional trade partnerships. For marketers, it proves trucking is critical in international commerce.
Truck Delivery Marketing Statistics #14: Trucks Moved $94.2 Billion Of Cross-Border Freight In March 2025
In March 2025, trucks moved $94.2 billion worth of cross-border freight. This accounted for over 65% of U.S. trade with Canada and Mexico. The figure emphasizes how trucks dominate cross-border trade flows. Dependence on trucks for international trade shows the industry’s strategic importance. Marketers can leverage this to highlight trucking’s role in keeping economies interconnected.
Truck Delivery Marketing Statistics #15: Trucking Companies’ Profit Margins 7–18%
For-hire trucking companies often operate with profit margins ranging between 7% and 18%. This range reflects both the competitiveness and profitability of the sector. Margins vary depending on market conditions, fleet efficiency, and contracts. While not as high as tech industries, these margins remain solid for transportation. For marketers, showing value-added services can help trucking companies expand margins.
Truck Delivery Marketing Statistics #16: Global E-Commerce To Reach $7.4 Trillion By 2025
Global e-commerce sales are expected to hit $7.4 trillion by 2025. This surge directly fuels the trucking and delivery industries. With more goods being sold online, trucks remain the essential last step in fulfillment. The connection between e-commerce and trucking is inseparable. Marketers must tie delivery reliability into the consumer’s online shopping journey.
Truck Delivery Marketing Statistics #17: 80% Of Logistics Firms Adopting AI And Visibility Tools By 2025
By 2025, 80% of logistics companies will be using AI and real-time visibility solutions. These tools are helping optimize routes, predict delays, and improve customer experiences. AI adoption represents a significant tech shift in an industry once considered traditional. Companies that don’t adapt risk being left behind. For marketers, highlighting smart tech adoption helps attract modern clients.
Truck Delivery Marketing Statistics #18: 41% Of Logistics Firms Plan To Expand Facilities By 2028
About 41% of logistics and distribution firms plan to expand into new facilities within three years. Another 37% expect to increase their workforce significantly. This reflects optimism and confidence in market growth. Expansions also show that trucking capacity must continue to evolve. For marketers, this represents a chance to position brands as growth enablers.
Truck Delivery Marketing Statistics #19: Truckside Ads Cost $0.81 CPM Vs $10.40 For TV
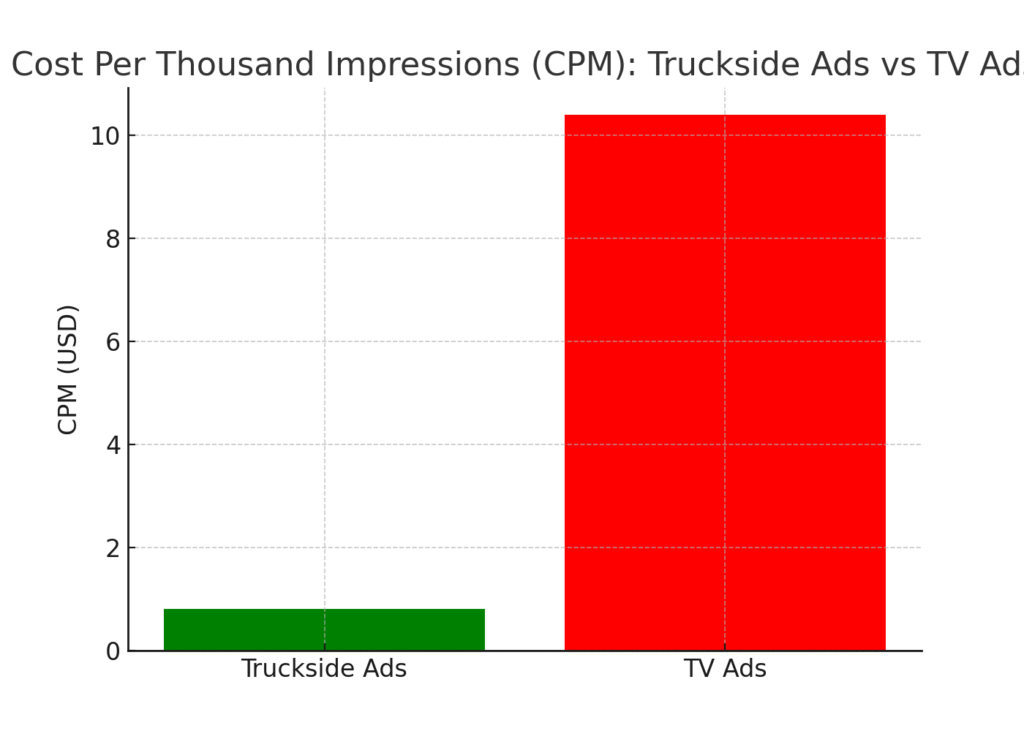
Truckside ads offer an extremely low cost per thousand impressions (CPM) at $0.81. By comparison, TV advertising costs around $10.40 per thousand impressions. This dramatic difference makes truck advertising highly cost-effective. It allows brands to reach massive audiences at a fraction of traditional costs. For marketers, these figures make a strong case for truckside branding.
Truck Delivery Marketing Statistics #20: Truck Advertising Recall Reaches 94%
Studies show that 91% of people notice graphics on trucks and up to 94% recall mobile billboards. This demonstrates just how impactful truck advertising can be. People don’t just notice trucks—they remember them. Such recall rates rival or even surpass many digital ads. Marketers should recognize truck advertising as a high-ROI channel for brand visibility.
Wrapping It All Together
Looking at these numbers, it’s clear that vinyl is more than a passing trend—it’s a movement that speaks to community, identity, and the tactile joy of music. As I reflect on these insights, I’m reminded of conversations I’ve had with young collectors who buy vinyl not only for the sound but for the story each record carries. For me, that’s where the power of marketing really shines—bridging data with human emotion. If you’re in this space, these statistics aren’t just figures on a page; they’re opportunities to connect with audiences in ways streaming alone never could. And as I continue exploring this journey alongside passionate brands and music lovers, I can’t help but feel excited about where vinyl’s story goes next.
SOURCES