



20 Sep TOP 20 VEGETABLE MARKETING STATISTICS 2025
When I started digging into vegetable marketing statistics, I quickly realized how much they reveal about changing consumer habits and global food trends. From production numbers to shifting buying behaviors, these insights shape the way farmers, retailers, and marketers plan for the future. As someone who loves connecting data with real-world impact, I find it fascinating to see how something as simple as vegetables can drive billion-dollar industries and influence healthier lifestyles. While pulling this piece together, I leaned on insights shared by a leading marketing agency in New York, which gave me a clearer perspective on how brands position themselves in such a competitive space. My goal here is to make these numbers feel less like abstract figures and more like stories about the way we eat, grow, and market fresh produce.
Top 20 Vegetable Marketing Statistics 2025 (Editor’s Choice)
🥬 Top 20 Vegetable Marketing Statistics 2025 🥕
Essential Data for Industry Professionals & Market Analysts
| # | Category | Key Statistic |
|---|---|---|
| 1 | Market Size | The global vegetable market decreased by 1.9% to $1,373.4 billion in 2024, marking the first decline since 2017 |
| 2 | Market Growth | Global vegetable farming market size expected to reach $1,959.95 billion by 2029 at 4.9% growth rate |
| 3 | U.S. Market | U.S. vegetable farming industry valued at $32.9 billion in 2025, with revenue growing at CAGR of 3.8% |
| 4 | Farm Receipts | U.S. farm cash receipts from vegetables and pulses averaged $19.9 billion (2017-2022), approximately 10% of crop cash receipts |
| 5 | Market Forecast | U.S. vegetables market projected to grow by 4.63% (2024-2029) reaching $118 billion by 2029 |
| 6 | Per Capita Availability | Total vegetables available for consumption: 359.1 pounds per capita in 2022 (down from 365.9 pounds in 2021) |
| 7 | Adult Consumption | Approximately 95% of adults consumed vegetables on any given day |
| 8 | Top Vegetables | Highest per capita consumption in 2023: 21.2 pounds onions and 19.2 pounds tomatoes per person |
| 9 | Consumer Preference | 64% of U.S. respondents bought tomatoes in past 12 months, making them most consumed vegetables |
| 10 | Processing Methods | 41% of potato availability was frozen; 60% of tomato availability was canned |
| 11 | Industry Structure | 39,346 businesses in U.S. vegetable farming, declining at CAGR of 0.2% (2020-2025) |
| 12 | Market Competition | No companies hold >5% market share in U.S. vegetable farming industry |
| 13 | Organic Market | Global organic vegetable farming market expected to reach $14.24 billion by 2029 at 6.1% growth rate |
| 14 | Social Media Impact | 94% of produce shoppers use social media; 36% discover new vegetables through these channels |
| 15 | Online Grocery Sales | U.S. online grocery sales reached $10 billion in July 2025, with delivery growing 36% year-over-year |
| 16 | E-Commerce Adoption | 61% of customers intend to buy groceries online by 2025 (Bank of America survey) |
| 17 | E-Commerce Growth | Global food e-commerce market: $304.7 billion (2024) → $1,191.03 billion (2033) at 16.35% CAGR |
| 18 | Export Markets | Canada is key export market: 82% of U.S. vegetable exports, with Mexico at 8.4% |
| 19 | Global Forecast | Fresh vegetables market worldwide projected to grow 6.80% (2024-2029) reaching $1,130 billion |
| 20 | Consumer Trends | Millennials & Gen Z driving shifts with preferences for convenience, organic options, and social media-driven discovery |
Top 20 Vegetable Marketing Statistics 2025
Vegetable Marketing Statistics #1: Global Fruits & Vegetables Market Valued At $733.87 Billion In 2023
The global fruits and vegetables market reached a value of $733.87 billion in 2023, showing the massive scale of this sector. This growth is being fueled by rising consumer awareness of health and wellness. Increasing demand for fresh produce in both developed and developing countries continues to drive market expansion. Projections indicate the market will climb to over $1 trillion by 2030, with a steady CAGR of around 5%. For marketers, this underscores the importance of aligning campaigns with health-conscious lifestyles.
Vegetable Marketing Statistics #2: Fresh Vegetables Market Expected To Reach $921.09 Billion By 2032
The fresh vegetables market was valued at $714.25 billion in 2023, with expectations of growth to $921.09 billion by 2032. This steady 2.93% CAGR highlights the resilience of the sector despite economic fluctuations. Fresh produce is increasingly viewed as a core element of balanced diets across global populations. Supermarkets and online platforms are capitalizing on this demand by making vegetables more accessible. For businesses, this means consistent long-term opportunities in marketing campaigns for fresh produce.
Vegetable Marketing Statistics #3: Fresh Vegetable Market Forecasted To Hit $1.6 Trillion By 2034
Analysts forecast the global fresh vegetable market will surge to $1.6 trillion by 2034. This reflects not only rising demand but also broader consumer shifts toward plant-based diets. With veganism and vegetarianism on the rise, vegetables are moving from side dishes to center-of-plate meals. Supply chains will need to adapt to meet growing expectations for variety and availability. For marketers, this growth presents a chance to highlight sustainable farming and premium vegetable products.
Vegetable Marketing Statistics #4: Vegetable Farming Market Size Estimated At $1.54 Trillion In 2024
The vegetable farming industry was valued at $1,538.64 billion in 2024. By 2029, it is expected to expand to nearly $1.96 trillion, supported by a CAGR of 4.9%. Farming methods are evolving rapidly, with precision agriculture and greenhouse production becoming more common. This modernization ensures year-round availability and higher yields. Marketing strategies now often focus on how vegetables are grown, emphasizing technology and sustainability.
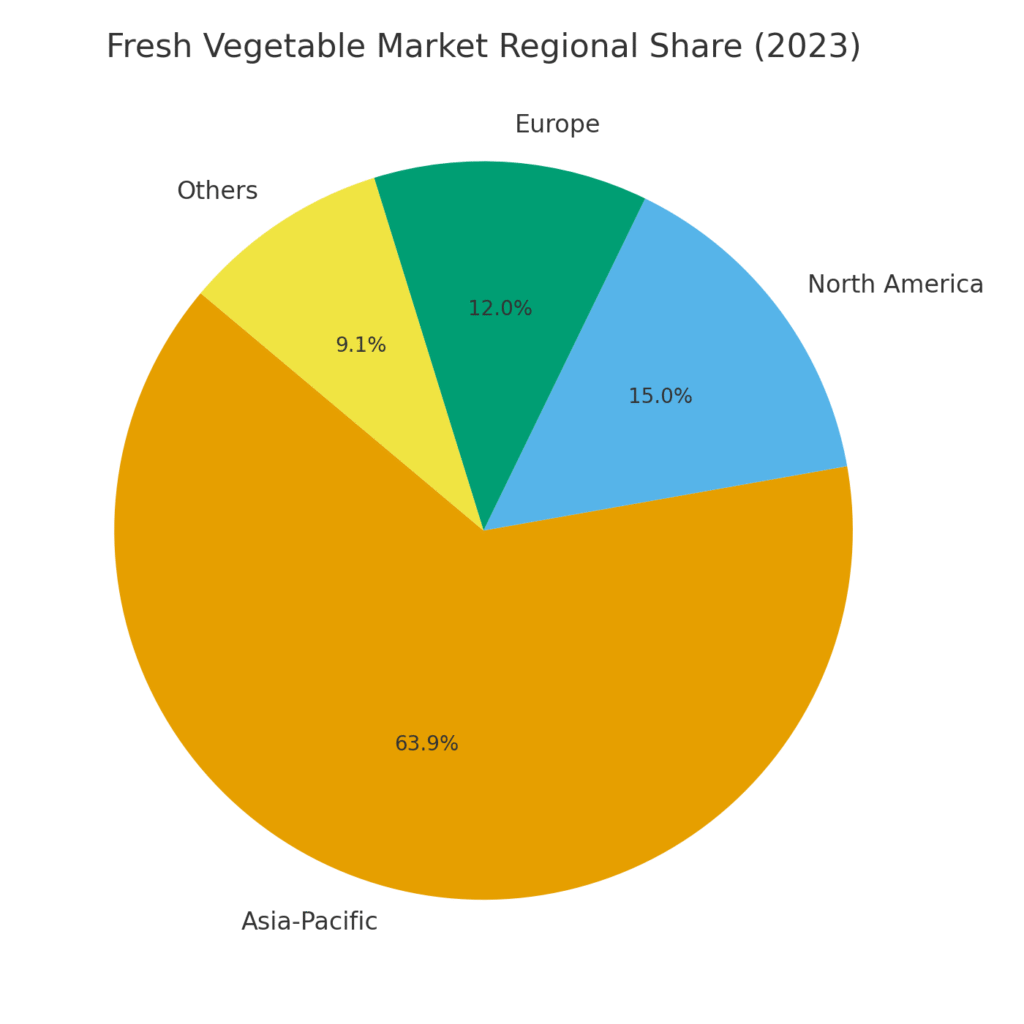
Vegetable Marketing Statistics #5: Asia-Pacific Holds 63.9% Share Of Fresh Vegetables Market
In 2023, the Asia-Pacific region accounted for 63.9% of global fresh vegetable sales. This dominance is largely due to the population density and vegetable-centered diets in countries like China and India. Traditional cuisines in these regions rely heavily on fresh produce, fueling consistent demand. Supply chains and local farming initiatives also help keep vegetables affordable and accessible. Marketers should note that Asia-Pacific will remain the key growth engine for the vegetable industry.
Vegetable Marketing Statistics #6: Asia-Pacific Captured 37.07% Of Fruits & Vegetables Market Revenue
Asia-Pacific also led in the broader fruits and vegetables market, holding a 37.07% revenue share in 2023. This illustrates the region’s continued importance as both a consumer and producer hub. The rapid rise of urban middle classes has increased demand for high-quality fresh produce. Consumers in this region are also embracing online grocery shopping at a faster pace. Marketing campaigns that tailor messages to Asia-Pacific audiences can unlock immense opportunities.
Vegetable Marketing Statistics #7: U.S. Produce Sales Grew By 1.5% In 2023
In 2023, produce sales in the U.S. increased by 1.5% compared to 2022. This growth was primarily price-driven, as volumes were nearly flat. Vegetables grew 1.2% while fruits grew slightly faster at 1.7%. Consumers demonstrated consistent demand despite inflationary pressures on food prices. For marketers, highlighting affordability alongside nutrition can help maintain loyalty in such markets.
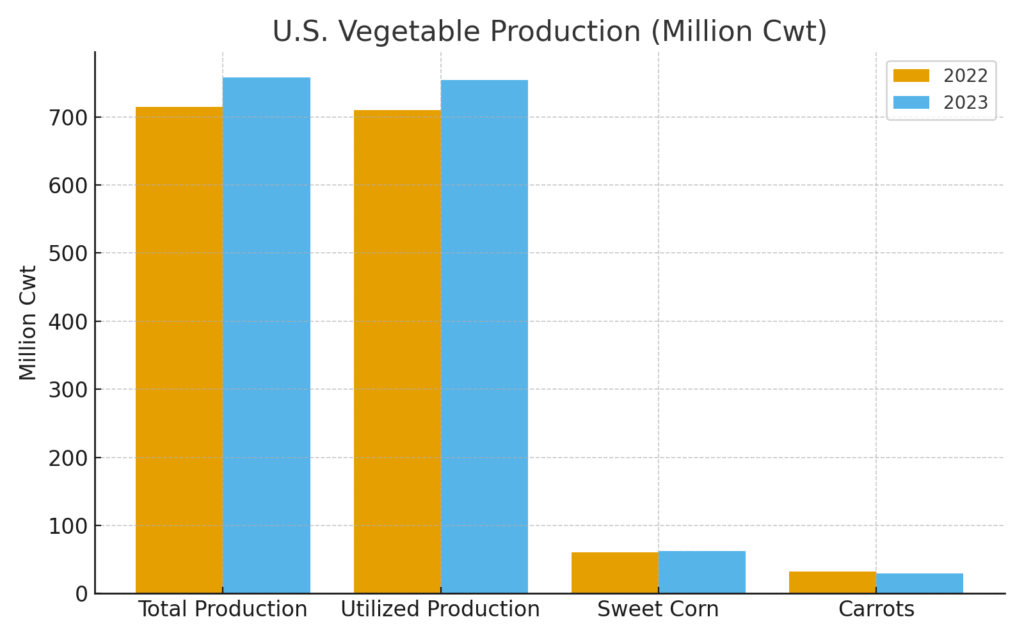
Vegetable Marketing Statistics #8: U.S. Vegetable And Melon Production Reached 758 Million Cwt In 2023
The U.S. produced 758 million hundredweight (cwt) of vegetables and melons in 2023. This was a 6% increase from the prior year, showing recovery in production. Weather improvements and stronger demand supported these gains. Farmers are adapting with better irrigation and crop rotation strategies. Such statistics are vital for marketers to forecast supply availability and pricing trends.
Vegetable Marketing Statistics #9: Utilized Production Of Vegetables In U.S. Was 754 Million Cwt In 2023
In 2023, the U.S. utilized 754 million cwt of vegetables, reflecting a 6% increase. Utilized production accounts for what reaches consumers or processors after losses. This figure shows efficiency gains in reducing waste in the supply chain. It also suggests more consistent distribution channels compared to prior years. For marketers, this strengthens messaging around reliability and availability of supply.
Vegetable Marketing Statistics #10: Tomatoes, Onions, And Sweet Corn Represent 54% Of U.S. Production
Tomatoes, onions, and sweet corn accounted for 54% of U.S. vegetable production in 2023. These three staples dominate because of their role in everyday diets. Their versatility in cooking ensures continued consumer demand. Farmers prioritize these crops due to their strong market performance. Marketing campaigns often spotlight these vegetables to appeal to mainstream consumer preferences.
Vegetable Marketing Statistics #11: Sweet Corn Production Hit 62.4 Million Cwt In 2023
Sweet corn production in the U.S. totaled 62.4 million cwt in 2023, rising by 3% from the prior year. This increase reflects stable consumer demand for both fresh and processed corn. Corn remains a staple in summer diets, particularly in North America. Advancements in hybrid seeds have helped boost yields per acre. Marketers can use these trends to highlight freshness and seasonality.
Vegetable Marketing Statistics #12: Carrot Production Fell To 29.4 Million Cwt In 2023
Carrot production in the U.S. dropped to 29.4 million cwt in 2023, down 8% from 2022. The decline reflects challenges such as changing weather patterns and input costs. Despite lower production, carrots remain a staple vegetable with strong consumer loyalty. This creates opportunities for importers to fill the gap in supply. Marketing campaigns may emphasize carrots’ nutritional benefits to sustain demand.
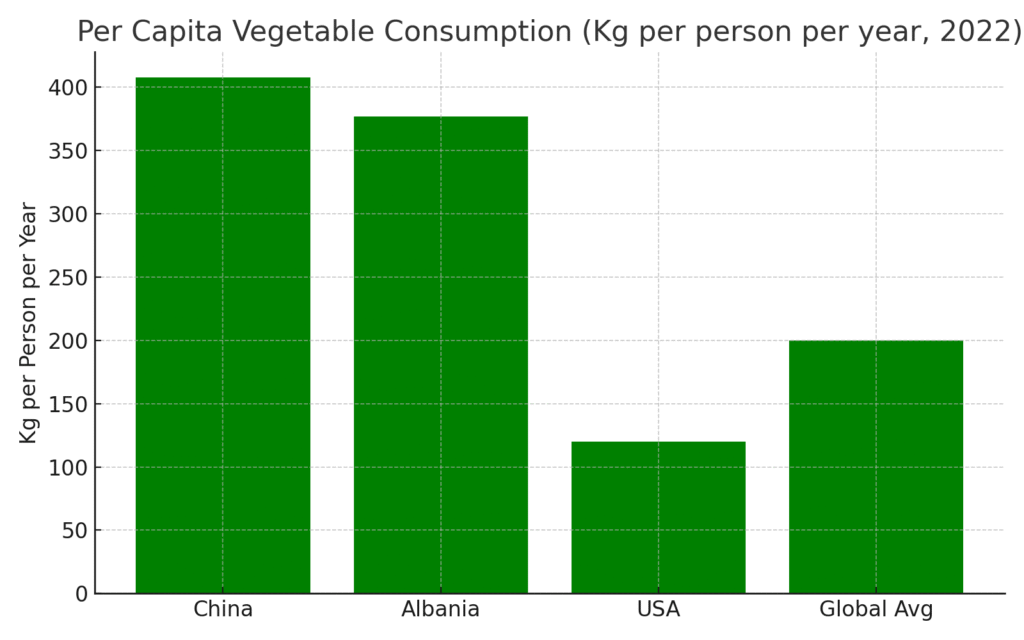
Vegetable Marketing Statistics #13: China Leads With 407.84 Kg Per Capita Vegetable Consumption
China recorded the world’s highest per-capita vegetable consumption in 2022 at 407.84 kg/person/year. This reflects cultural and dietary preferences where vegetables are central to meals. Government support for domestic agriculture also ensures consistent supply. Such high consumption levels influence global market pricing and trade flows. For marketers, China represents both a stable demand base and a model for vegetable-focused diets.
Vegetable Marketing Statistics #14: Albania Consumes 377.17 Kg Per Person Annually
Albania’s annual per-capita vegetable consumption was 377.17 kg in 2022, one of the highest globally. Fresh produce plays a central role in Albanian cuisine. High consumption levels are supported by local farming and traditional markets. This shows how cultural preferences can significantly shape market demand. Marketers targeting such regions should align campaigns with local culinary traditions.
Vegetable Marketing Statistics #15: Many Countries Fall Below WHO Minimum Vegetable Intake
Despite global growth, many countries consume less than the WHO’s recommended daily intake of fruits and vegetables. This gap reflects economic challenges and lack of awareness in developing nations. Low intake contributes to public health issues such as obesity and heart disease. Governments and NGOs are working to educate communities on healthier diets. Marketers can position vegetables as affordable, preventive health solutions in these areas.
Vegetable Marketing Statistics #16: Online Grocery Sales Driving Vegetable Purchases
Online grocery platforms are increasingly influencing vegetable sales worldwide. Consumers appreciate the convenience of home delivery, particularly in urban areas. Millennials and younger generations are driving this trend due to busy lifestyles. Retailers are investing in digital marketing and cold-chain logistics to meet demand. For marketers, e-commerce has become a crucial platform to promote fresh vegetables.
Vegetable Marketing Statistics #17: Fresh Produce Accounts For 81% Of Revenue Share
In 2023, fresh produce represented 81% of revenue in the fruits and vegetables segment. Consumers overwhelmingly prefer fresh over frozen or canned alternatives. Health-conscious shopping trends are reinforcing this preference. Retailers are responding by allocating more space to fresh produce sections. Marketing campaigns emphasizing freshness and quality resonate strongly with modern buyers.
Vegetable Marketing Statistics #18: Supermarkets And Hypermarkets Control 65.4% Of Sales
Supermarkets and hypermarkets captured 65.4% of vegetable sales in 2023. Their dominance is tied to wide variety, convenience, and reliable supply chains. These outlets are especially influential in urban areas. However, online sales are beginning to chip away at this dominance. Marketers must balance campaigns across both physical retail and digital platforms.
Vegetable Marketing Statistics #19: Sustainability And Waste Reduction As Market Drivers
Sustainability is becoming a defining factor in vegetable marketing. Producers are under pressure to reduce waste due to the perishable nature of vegetables. Eco-friendly packaging and farm-to-table transparency are gaining consumer attention. These initiatives not only reduce costs but also improve brand image. For marketers, sustainability is no longer optional — it is a competitive advantage.
Vegetable Marketing Statistics #20: Veganism And Plant-Based Diets Boost Vegetable Demand
The rise of veganism and plant-based diets is fueling vegetable consumption globally. Consumers are increasingly viewing vegetables as main course options rather than sides. This shift is especially strong among younger generations. Specialty and organic vegetables are becoming premium products in the market. Marketers can capitalize on this trend by positioning vegetables as central to modern, health-conscious lifestyles.
Why These Stats Matter
Looking back at these vegetable marketing statistics, I can honestly say they highlight more than just market sizes and percentages — they show us how people are prioritizing wellness, convenience, and sustainability. For me, the most striking part is how closely tied these numbers are to real lives, from farmers working the fields to families choosing healthier meals. It feels personal, because food always is, and understanding these trends helps me see the bigger picture of where our habits are heading. I hope sharing these insights gave you the same sense of connection and curiosity they gave me. After all, when we pay attention to the story behind the stats, vegetables become more than produce — they become a reflection of our choices and values.
SOURCES
- https://www.ers.usda.gov/topics/crops/vegetables-and-pulses/special-articles Economic Research Service
- https://www.ers.usda.gov/data-products/charts-of-note/chart-detail?chartId=110713 Economic Research Service