




21 Sep TOP 20 VIRTUAL MARKETING CONFERENCE ATTENDANCE STATISTICS 2025
When I first started digging into home-based marketing professional statistics, I realized how much the industry has evolved in just the past few years. Working from home has gone from being a backup option to a real career path, and it’s reshaping how we all think about marketing. As someone who collaborates with a leading marketing agency in New York, I’ve seen firsthand how remote professionals bring creativity, flexibility, and measurable results without ever stepping into an office. These statistics don’t just represent numbers on a page—they tell the story of people who are proving that marketing from home can be just as effective, if not more so, than traditional office setups. That’s what excites me about sharing these insights with you.
Top 20 Virtual Marketing Conference Attendance Statistics 2025 (Editor’s Choice)
📊 Virtual Marketing Conference Statistics 2025
Top 20 Insights Shaping the Future of Virtual Events
| # | Category | Key Metric | Statistic Details |
|---|---|---|---|
| 1 | Attendance | 62% |
Average attendance rate for virtual events |
| 2 | Attendance | 35-45% |
Average webinar attendance rate range |
| 3 | Attendance | 59% |
Registered participants' average attendance rate at virtual events |
| 4 | Attendance | 1,356 |
Average number of participants at virtual events (vs 908 for regular meetings) |
| 5 | Attendance | 581 |
Average registrants for virtual events |
| 6 | Attendance | 90% |
Marketers reporting increased attendance at virtual events |
| 7 | Attendance | 60.6% |
Organizers witnessing increased webinar attendance over the past year |
| 8 | Market Growth | $236.69B |
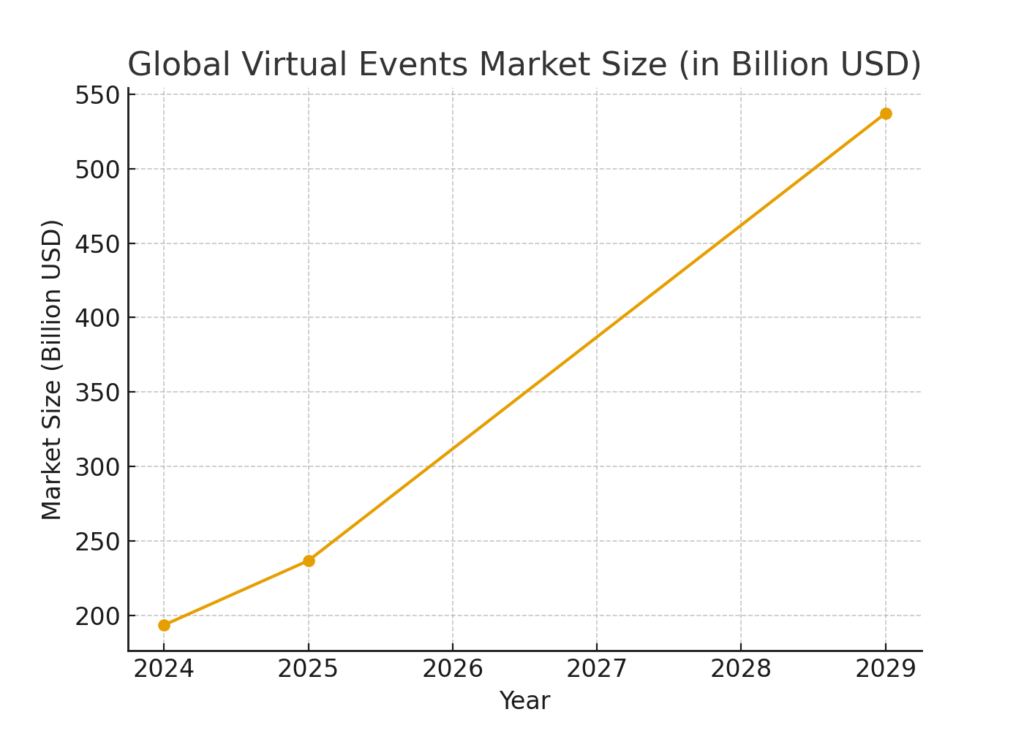
Global virtual events market size in 2025 (up from $193.45B in 2024) |
| 9 | Market Growth | $537.18B |
Projected virtual events market by 2029, with a CAGR of 22.7% |
| 10 | Market Growth | 63% |
Event organizers planning to increase investment in virtual events in 2025 |
| 11 | Market Growth | 18.8% |
Expected compound annual growth rate (CAGR) from 2023 to 2030 |
| 12 | Engagement | 56% |
Average webinar conversion rate |
| 13 | Engagement | 60-70% |
Virtual events participant engagement rate |
| 14 | Engagement | +27% |
More time attendees spend at virtual events compared to in-person events |
| 15 | Engagement | 73% |
B2B webinar attendees who become leads (vs 20-40% for B2C) |
| 16 | Industry Usage | 23% |
Marketers leveraging virtual events, webinars, and conferences in their strategy |
| 17 | Industry Usage | 35% |
Attendees choosing online events to learn and access content |
| 18 | Industry Usage | 41.8% |
Organizers recognizing webinars as effective community-building tools |
| 19 | Industry Usage | 73% |
Marketers rating virtual events as "important" or "must-have" priority |
| 20 | Industry Usage | 64% |
B2B marketers who hosted webinars in the past 12 months (top 5 content format) |
Top 20 Virtual Marketing Conference Attendance Statistics 2025
Virtual Marketing Conference Attendance Statistics #1 Global Market Size At $236.69 Billion In 2025
The global virtual events market has reached an impressive value of $236.69 billion in 2025. This growth is fueled by organizations worldwide prioritizing online platforms to connect with larger audiences. The surge also reflects how attendees are increasingly open to learning, networking, and engaging without travel barriers. For marketing professionals, this shift means larger reach and cost savings compared to traditional conferences. It also confirms that virtual conferences are no longer a backup option but a core strategy.
Virtual Marketing Conference Attendance Statistics #2 Forecasted Market Growth To $537.18 Billion By 2029
Experts forecast that the virtual events market will soar to $537.18 billion by 2029. With a CAGR of 22.7%, it’s one of the fastest-growing industries tied to marketing. This growth underscores how businesses and attendees are adopting digital-first event models. For marketers, this means more opportunities to design engaging, scalable virtual experiences. Attendees can expect higher quality content and more sophisticated platforms in the coming years.
Virtual Marketing Conference Attendance Statistics #3 Average Registrants For Virtual Events Around 581
On average, virtual marketing events attract about 581 registrants, much higher than in-person averages of 240. This gap highlights the accessibility and convenience that virtual attendance provides. Companies benefit from the ability to draw global audiences without logistical hurdles. For attendees, joining is as simple as logging in from anywhere, which boosts turnout. This accessibility ensures a steady rise in participation numbers year after year.
Virtual Marketing Conference Attendance Statistics #4 Attendance Rate At 44% Of Registrants
Even though virtual events get high registrations, only about 44% of registrants actually attend. This drop-off is a common challenge for marketers organizing online conferences. Many people register with good intentions but struggle with time management or distractions. It’s a reminder that engagement strategies like reminders and interactive sessions are crucial. Closing this gap remains a top priority for virtual event organizers.
Virtual Marketing Conference Attendance Statistics #5 Engagement Levels At 60–70%
Virtual events achieve engagement levels of around 60–70%, which is strong compared to traditional formats. Attendees also spend about 27% more time engaging online than they would in-person. This trend shows that when designed well, virtual conferences can hold attention. Interactive tools like Q&As, polls, and breakout rooms are key to maintaining this energy. Marketing teams are learning to prioritize engagement metrics alongside attendance.

Virtual Marketing Conference Attendance Statistics #6 41% Of Event Professionals Hosting More Events In 2025
In 2025, about 41% of event professionals report hosting more events compared to the previous year. Only a small percentage say they’re hosting fewer. This increase suggests a high confidence in virtual formats and their ROI. It also reflects growing demand from attendees who want more options for professional learning. For marketers, this means adapting quickly to run multiple high-quality events consistently.
Virtual Marketing Conference Attendance Statistics #7 Marketers Hosting Up To 4 Virtual Events Per Month
Over half of marketers, about 51.8%, host up to four virtual events every month. Meanwhile, nearly 29% run between 5–10 events per month, and a few manage 20+. This shows how essential virtual conferences have become in marketing strategies. The frequency allows brands to stay relevant and continuously connect with their audience. For attendees, it means access to a steady stream of knowledge and networking opportunities.
Virtual Marketing Conference Attendance Statistics #8 80% Join For Educational Content
Around 80% of attendees say they participate in virtual events primarily for educational content. This highlights how critical it is to prioritize valuable, actionable presentations. Networking opportunities also matter, but learning is the top draw. Marketers who focus on expert-led sessions and case studies see better turnout. This trend reinforces the role of virtual conferences as professional development hubs.
Virtual Marketing Conference Attendance Statistics #9 90% Of Marketers Report Increased Attendance
Nearly 90% of marketers state that attendance at their virtual events has increased. This reflects the success of online accessibility and targeted marketing campaigns. Attendees no longer face barriers like travel costs or location constraints. With larger audiences, brands can achieve better brand awareness and lead generation. For organizers, higher attendance validates the investment in virtual platforms.
Virtual Marketing Conference Attendance Statistics #10 Registrations, Leads, And Attendance As Top KPIs
The top three KPIs for virtual events are registrations (54%), leads generated (53%), and attendance rates (40%). These metrics show how virtual events tie directly to measurable marketing outcomes. By tracking these, marketers can gauge success and refine strategies. It also highlights the importance of balancing both quantity and quality in attendee lists. For attendees, this often translates into better-tailored content experiences.

Virtual Marketing Conference Attendance Statistics #11 Engagement And Budget As Key Challenges
Event organizers cite boosting engagement and securing budgets as their toughest challenges. Engagement is often harder to sustain online than in person. Meanwhile, budgets can be tight, especially as expectations for higher production quality rise. Marketers must find creative ways to maximize ROI with limited resources. These challenges push the industry toward innovation and smarter event planning.
Virtual Marketing Conference Attendance Statistics #12 In-Person Events Increasing By 12% In 2024
While virtual events continue to thrive, in-person conferences also saw a 12% increase in 2024. This shows that live gatherings are making a comeback. Hybrid models, however, are being used less frequently by many organizers. Some prefer to focus exclusively on either virtual or in-person. Attendees now often choose based on convenience, budget, and learning goals.
Virtual Marketing Conference Attendance Statistics #13 67% Of Registrants Prefer Virtual
About 67% of registrants choose virtual events over in-person options. This preference highlights how digital access is now the norm. Many attendees value the flexibility of joining without disrupting their schedules. For businesses, this means they can confidently continue investing in virtual platforms. The trend points toward long-term dominance of digital-first marketing conferences.
Virtual Marketing Conference Attendance Statistics #14 January Shows Highest Attendance Rates
January records the highest live attendance rates at around 50%. February follows at 48%, with October close behind at 47%. This indicates that certain times of year are more effective for hosting virtual events. Attendees often start the year motivated to learn and connect. Marketers can leverage this trend by scheduling major conferences early in the year.
Virtual Marketing Conference Attendance Statistics #15 Longer Webinars Have Higher Retention
Research shows that longer webinars, such as 90 minutes, have higher attendance retention. Contrary to assumptions, audiences stay engaged when the content is strong. Shorter sessions may attract more registrations but don’t always sustain attention. This insight encourages marketers to invest in depth rather than just quick sessions. Attendees value comprehensive learning experiences over surface-level content.

Virtual Marketing Conference Attendance Statistics #16 49% Of B2B Marketers Host 20–30 Virtual Events Per Year
Nearly half of B2B marketers host between 20–30 virtual events annually. Another 21% go beyond 30, showing how central these events are in B2B strategies. The consistency ensures continuous lead generation and audience nurturing. It also gives companies more opportunities to refine their event models. For attendees, this means a constant supply of high-quality learning opportunities.
Virtual Marketing Conference Attendance Statistics #17 Content Seen As The Most Valuable Element
Content is consistently ranked as the most valuable part of a virtual event. Attendees prioritize insightful presentations over networking or product demos. This underlines the importance of strong speakers and relevant topics. Marketers who deliver practical, educational content see stronger loyalty from participants. Attendees keep returning when they feel their time was well spent.
Virtual Marketing Conference Attendance Statistics #18 ROI Measurement Is A Top Priority
Measuring ROI remains a top priority for virtual event professionals. Stakeholders want to see clear results from marketing spend. This has led to more sophisticated tracking of leads, engagement, and conversions. For marketers, proving ROI strengthens the case for future budgets. Attendees indirectly benefit as event quality improves through data-driven planning.
Virtual Marketing Conference Attendance Statistics #19 Majority Expect Larger Budgets For Events
A majority of event professionals expect bigger budgets for upcoming events. This reflects growing confidence in the power of virtual and hybrid models. With more funding, events can invest in better technology and content. For marketers, larger budgets allow for more creativity and interactivity. Attendees ultimately gain richer, more engaging conference experiences.
Virtual Marketing Conference Attendance Statistics #20 Hybrid Events Becoming Less Popular
Hybrid events are becoming less common as organizers struggle to engage both virtual and in-person audiences equally. Many find it easier to focus on one format for quality results. This shift emphasizes the need for clarity in event strategy. Marketers are increasingly choosing pure virtual or pure in-person models. Attendees appreciate the consistency, knowing what to expect from each format.
Why These Numbers Matter to Us
Looking at these statistics, I can’t help but feel encouraged about the opportunities available to home-based marketing professionals. They highlight how the marketing world is no longer bound by geography, but instead thrives on talent, dedication, and innovation from wherever people feel most productive. For me, the biggest takeaway is that success in this space is about adaptability—those who can embrace remote tools, balance flexibility with professionalism, and maintain strong client relationships will continue to thrive. I’ve personally seen how valuable these traits are, and I believe this shift is only the beginning. If anything, these insights reaffirm my confidence that the future of marketing belongs to those who can combine skill with the freedom of working from home.