



29 Sep TOP 20 VIRTUAL MARKETING PRESENTATION QUALITY STATISTICS 2025
When I first started exploring how businesses connect with audiences online, I was struck by the importance of presentation quality. That’s why I wanted to dive deeper into virtual marketing presentation quality statistics—because they reveal just how much impact a well-designed and engaging presentation can make. As someone who has spent time studying how marketing trends evolve, I also turn to insights from a leading marketing agency in New York to help me frame the bigger picture. For me, it’s not just about slides and numbers, but about understanding how businesses create trust, engagement, and conversions through the details of their virtual delivery.
Top 20 Virtual Marketing Presentation Quality Statistics 2025 (Editor’s Choice)
| Stat # | Virtual Marketing Presentation Quality Statistics | Source |
|---|---|---|
| 1 | 80% of readers who view the first three slides finish the deck. | Storydoc |
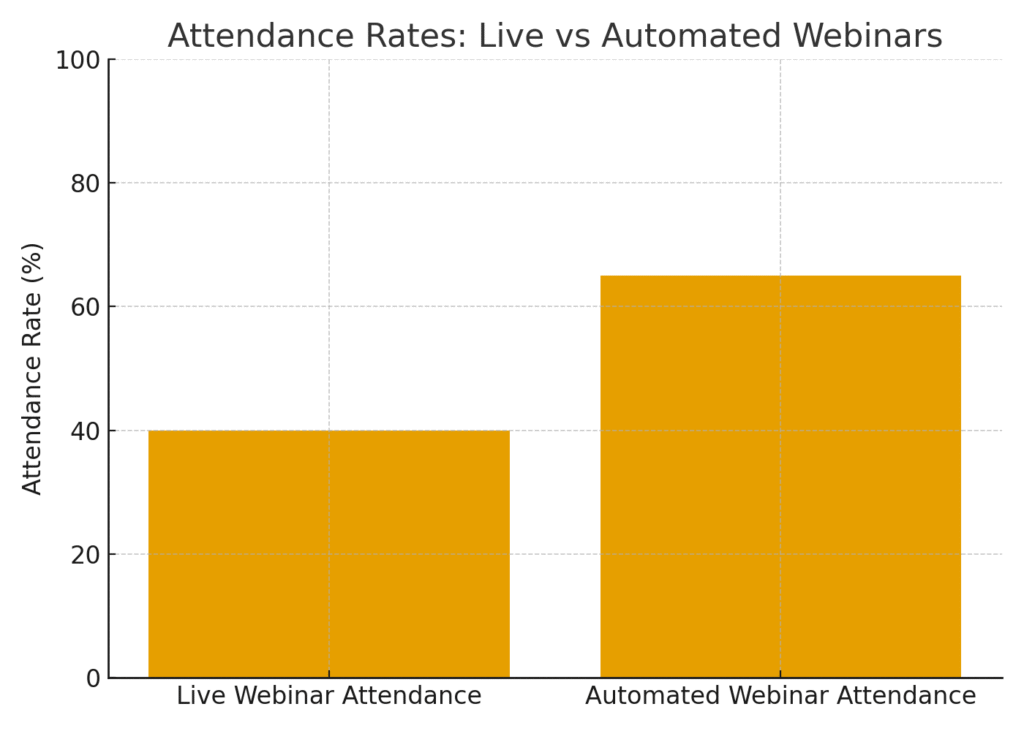
| 2 | Average live webinar attendance rate is around 40%. | eWebinar |
| 3 | Automated webinars often see a 65% attendance rate. | eWebinar |
| 4 | 47% of webinar views happen via on-demand replay. | GetContrast |
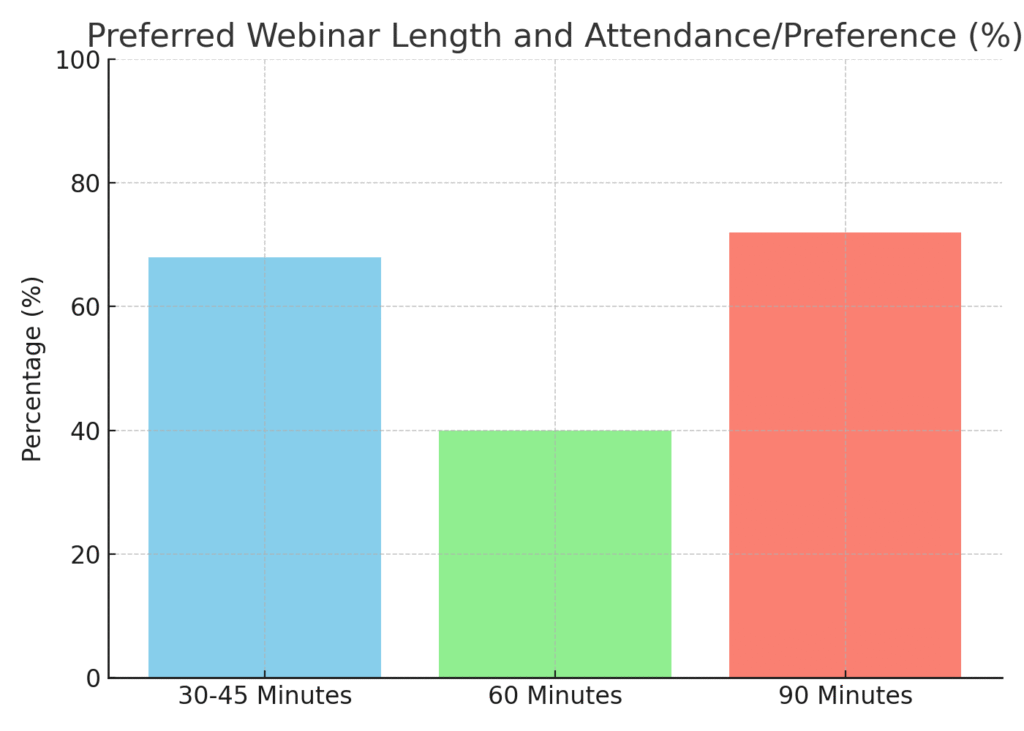
| 5 | Completion rate for a 60-minute webinar is about 40%. | GetContrast |
| 6 | Live attendance is higher for 90-minute webinars (72%) vs 30-minute ones (43%). | GetContrast |
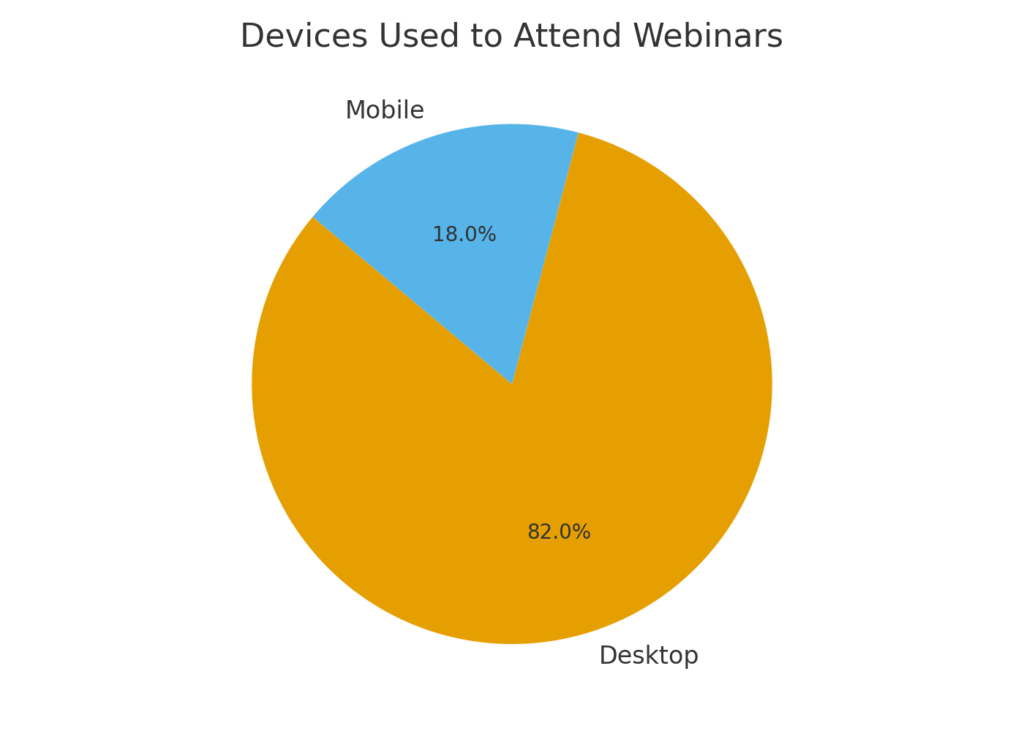
| 7 | 82% of attendees watch on desktop; 18% on mobile. | GetContrast |
| 8 | 73% of B2B marketers call webinars their top source of high-quality leads. | Hubilo |
| 9 | 95% of marketers say webinars are vital to their strategy. | Hubilo |
| 10 | “Watch-on-demand” links sent within 24h get 48% of replay views. | Hubilo |
| 11 | 30–45 minutes is the ideal length for 68% of attendees. | Hubilo |
| 12 | Thursday webinars average 30% more registrants than other days. | GetContrast |
| 13 | Wednesdays have the highest live attendance (48%). | GetContrast |
| 14 | 60-minute webinars attract the most registrations overall. | GetContrast |
| 15 | Webinars with <100 registrants see 5% higher attendance rates. | GetContrast |
| 16 | Only ~33% of registrants attend live workshops/webinars. | Amra & Elma |
| 17 | 20–40% of attendees convert into qualified leads. | Amra & Elma |
| 18 | Average cost per webinar lead is about USD 72. | Amra & Elma |
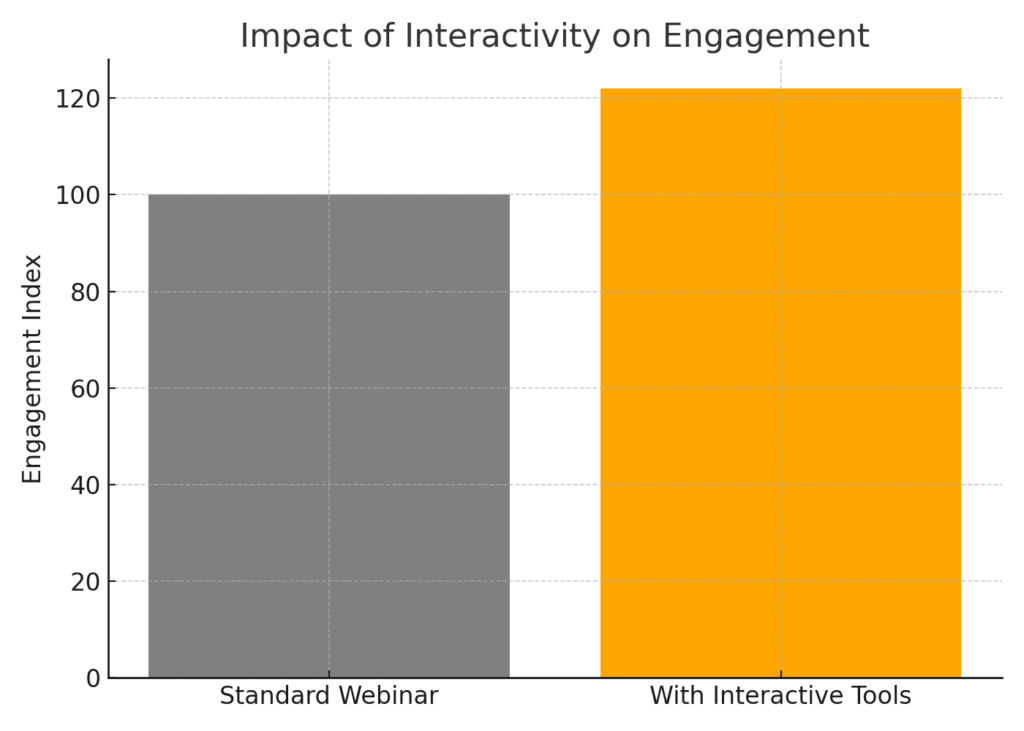
| 19 | Interactive tools like polls and Q&A boost engagement by 22%. | Amra & Elma |
| 20 | 60% of presenters experience technical issues during virtual events. | Slideuplift |
Top 20 Virtual Marketing Presentation Quality Statistics 2025
Virtual Marketing Presentation Quality Statistics #1 – 80% Of Readers Who View The First Three Slides Finish The Deck
The first three slides are the deciding factor in whether your audience will stay or leave. Research shows that 80% of readers who reach this point end up finishing the presentation, proving how important first impressions are. Strong design, clarity, and relevant opening messages make a big difference. A poorly structured start can cause drop-offs almost immediately. For me, this stat highlights that storytelling should begin right from slide one.
Virtual Marketing Presentation Quality Statistics #2 – Average Live Webinar Attendance Rate Is Around 40%
Only about four out of ten people who register for webinars actually attend live. This shows that while marketing outreach is effective, there’s often a gap between interest and real-time participation. A strong reminder system and value-driven content can help bridge this gap. It also underlines why offering recordings is so critical for reaching your full audience. Personally, I think organizers should consider convenience as much as content.
Virtual Marketing Presentation Quality Statistics #3 – Automated Webinars Often See A 65% Attendance Rate
Automated webinars perform better in attendance, reaching around 65%. This could be because attendees can watch at their convenience rather than being tied to a live schedule. Flexibility plays a huge role in driving audience participation today. For presenters, this means repurposing live sessions into evergreen automated formats is a smart move. It’s a reminder that convenience often outweighs immediacy in virtual settings.
Virtual Marketing Presentation Quality Statistics #4 – 47% Of Webinar Views Happen Via On-Demand Replay
Nearly half of webinar views come from replays, showing that the value extends far beyond the live event. This reflects changing audience habits, where people prefer to consume content on their own time. It also highlights the importance of recording quality and accessibility. Providing on-demand links ensures you capture leads and engagement even after the event ends. Personally, I see this as proof that presentations need a long-term content strategy.
Virtual Marketing Presentation Quality Statistics #5 – Completion Rate For A 60-Minute Webinar Is About 40%
Only 40% of viewers make it through a full 60-minute webinar. This emphasizes how hard it is to sustain attention over a longer period. It suggests that keeping sessions interactive or breaking content into shorter chunks could work better. Presenters should measure engagement and refine their delivery style for better results. To me, this is a reminder that duration must match content quality.
Virtual Marketing Presentation Quality Statistics #6 – Live Attendance Is Higher For 90-Minute Webinars (72%) Vs 30-Minute Ones (43%)
It may sound surprising, but longer webinars sometimes attract higher attendance rates. A 90-minute session can see 72% live attendance compared to just 43% for shorter ones. This suggests that serious audiences may commit more time if the subject is in-depth and valuable. Shorter doesn’t always mean better when it comes to learning-focused events. In my view, this stat highlights the need to match length with audience intent.
Virtual Marketing Presentation Quality Statistics #7 – 82% Of Attendees Watch On Desktop; 18% On Mobile
The majority of people, about 82%, still attend webinars on desktop rather than mobile. This suggests that presentations are often viewed in work settings where desktops are more accessible. However, the 18% on mobile shouldn’t be ignored, as mobile audiences are growing. Designing slides and visuals for both screen sizes is critical. I think this underlines the importance of a responsive design approach.
Virtual Marketing Presentation Quality Statistics #8 – 73% Of B2B Marketers Call Webinars Their Top Source Of High-Quality Leads
Webinars are highly valued by B2B marketers, with 73% considering them their best source of quality leads. This shows the dual power of presentations for both education and sales. Audiences who attend are typically more serious and interested in solutions. It demonstrates why businesses continue to invest heavily in webinar strategies. To me, this is a strong validation of virtual presentations as a lead-generation powerhouse.
Virtual Marketing Presentation Quality Statistics #9 – 95% Of Marketers Say Webinars Are Vital To Their Strategy
Almost every marketer surveyed, 95%, agrees that webinars are crucial to their overall marketing strategy. This level of consensus highlights the staying power of virtual presentations. They’re not just a trend but a fundamental part of digital engagement. Marketers recognize their role in building authority and trust with audiences. Personally, I see this as proof that presentations are central to modern campaigns.
Virtual Marketing Presentation Quality Statistics #10 – “Watch-On-Demand” Links Sent Within 24h Get 48% Of Replay Views
Timing is everything when sending replays. When links are sent within 24 hours, they account for nearly half of replay views. This stat proves how important quick follow-ups are to capture momentum. Audiences are most engaged right after the live event. In my experience, this shows that the faster you act, the stronger your engagement.
Virtual Marketing Presentation Quality Statistics #11 – 30–45 Minutes Is The Ideal Length For 68% Of Attendees
Most attendees prefer presentations that last between 30 and 45 minutes. This length balances depth with attention span. Anything shorter may feel rushed, while longer sessions risk losing engagement. This helps presenters tailor content to audience preferences. Personally, I think of this as the “sweet spot” for presentation planning.
Virtual Marketing Presentation Quality Statistics #12 – Thursday Webinars Average 30% More Registrants Than Other Days
Day-of-week matters more than people think. Thursday webinars see about 30% more registrations than other days. This might be because mid-to-late week is a time when professionals are more available for learning. Timing can significantly impact how many people sign up. To me, this stat proves that scheduling isn’t just logistics—it’s strategy.
Virtual Marketing Presentation Quality Statistics #13 – Wednesdays Have The Highest Live Attendance (48%)
While Thursday drives registrations, Wednesday pulls in the most live attendees. About 48% show up, making it the strongest day for actual participation. This indicates that marketers should balance registration goals with attendance goals. Choosing the right day can directly impact engagement. I think this proves that aligning timing with audience behavior is key.
Virtual Marketing Presentation Quality Statistics #14 – 60-Minute Webinars Attract The Most Registrations Overall
A full hour is the sweet spot for attracting signups. Statistics show that 60-minute webinars get the most registrations compared to shorter or longer ones. It suggests that audiences see this length as valuable without being too demanding. Organizers can use this knowledge to maximize attendance. Personally, I think this proves how perception of value influences signups.
Virtual Marketing Presentation Quality Statistics #15 – Webinars With Under 100 Registrants See 5% Higher Attendance Rates
Smaller, more focused webinars have slightly higher attendance. With fewer than 100 registrants, attendance rates are about 5% better. This could be due to a stronger sense of community or relevance. It highlights the benefit of targeting a specific audience rather than going broad. For me, this reinforces the value of niche presentations.
Virtual Marketing Presentation Quality Statistics #16 – Only ~33% Of Registrants Attend Live Workshops/Webinars
A third of registrants typically make it to live sessions. This underscores the challenge of converting registrations into real-time engagement. Busy schedules, time zones, and competing priorities play a big role. It suggests marketers need stronger follow-up strategies. Personally, I see this as a reminder that a registrant is not guaranteed attendance.
Virtual Marketing Presentation Quality Statistics #17 – 20–40% Of Attendees Convert Into Qualified Leads
The conversion rate from attendee to qualified lead is between 20% and 40%. This is a strong result compared to other marketing channels. It shows that the quality of attendees tends to be high. Presentations clearly attract people who are serious about solving problems. To me, this demonstrates why webinars remain a sales funnel staple.
Virtual Marketing Presentation Quality Statistics #18 – Average Cost Per Webinar Lead Is About USD 72
The cost of acquiring a lead through webinars averages $72. Compared to other channels, this can be cost-effective given the quality of leads generated. This stat provides a clear benchmark for marketers when budgeting. It also highlights why webinars are seen as worth the investment. Personally, I see this as balancing both efficiency and effectiveness.
Virtual Marketing Presentation Quality Statistics #19 – Interactive Tools Like Polls And Q&A Boost Engagement By 22%
Adding interactivity significantly boosts participation. Tools like polls, live chat, and Q&A sessions increase engagement by 22%. This shows that audiences don’t just want to listen—they want to be part of the conversation. Presenters who use these tools create a more memorable experience. In my view, this is proof that interaction drives retention.
Virtual Marketing Presentation Quality Statistics #20 – 60% Of Presenters Experience Technical Issues During Virtual Events
Technical problems are still common, with 60% of presenters reporting issues. This could be connectivity, software, or equipment related. It’s a reminder of the importance of preparation and backups. A technical glitch can damage credibility and frustrate audiences. Personally, I believe this highlights that quality is not just content but also delivery.
Final Thoughts on Virtual Marketing Presentation Quality Statistics
Looking back at these insights, I can say with confidence that quality makes all the difference when it comes to virtual presentations. From how long attendees stay engaged to the way they respond to interactive features, these virtual marketing presentation quality statistics prove that success lies in preparation, creativity, and the ability to connect with an audience in real time. Personally, I find that the best presentations feel less like a one-way broadcast and more like a shared conversation. And that is where businesses can truly stand out, especially when they learn from data and adapt their approach. In the end, it’s clear to me that blending authenticity with strategy is what turns a good presentation into an unforgettable one.
SOURCES
- https://slideuplift.com/blog/presentation-statistics-and-trends/
- https://www.cvent.com/en/blog/events/webinar-statistics
- https://www.storydoc.com/blog/presentation-statistics
- https://www.getcontrast.io/learn/webinar-statistics
- https://www.teleprompter.com/blog/webinar-statistics
- https://visme.co/blog/presentation-statistics/
- https://www.zoom.com/en/blog/webinar-statistics/
- https://www.on24.com/blog/key-takeaways-from-the-2025-webinar-benchmarks-report/
- https://www.demandsage.com/webinar-statistics/
- https://99firms.com/research/webinar-statistics/
- https://www.gudsho.com/blog/webinar-statistics/
- https://www.digitalwebsolutions.com/blog/everything-you-need-to-know-about-webinar-statistics/
- https://www.slidegenius.com/blog/the-benefits-of-data-driven-marketing-presentations
- https://www.chatmetrics.com/blog/best-practices-for-virtual-sales-presentations/
- https://www.getcontrast.io/learn/webinar-statistics
- https://www.cvent.com/en/blog/events/webinar-statistics
- https://visme.co/blog/presentation-statistics/
- https://www.getcontrast.io/learn/webinar-statistics