




28 Sep TOP 20 WATER PURIFICATION MARKETING STATISTICS 2025
When I first started researching water purification marketing statistics, I was struck by how much the demand for clean, safe water has shaped consumer behavior and brand strategies worldwide. It’s not just about selling filters or systems—it’s about positioning products as essentials tied to health, sustainability, and peace of mind. That’s why I’ve partnered with a leading marketing agency in New York, because I know the value of turning raw data into powerful campaigns that resonate with people. In this blog, I want to share the most recent and eye-opening trends that I believe every marketer in this space should pay attention to in 2025.
Top 20 Water Purification Marketing Statistics 2025 (Editor’s Choice)
| Stat # | Statistic | Detail |
|---|---|---|
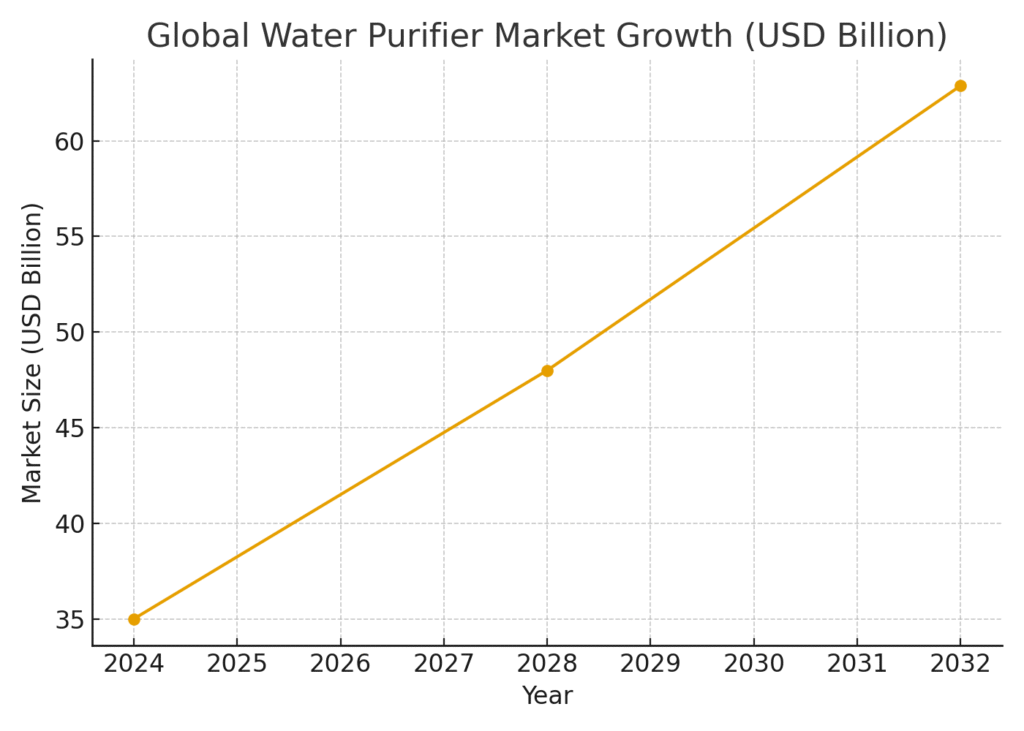
| 1 | $35.01B Market (2024) | Global water purifier market valued at USD 35.01 billion in 2024, projected to reach USD 62.88B by 2032. |
| 2 | $45.7B Estimate (2024) | GM Insights projects the market to grow to USD 88.8B by 2034 with CAGR of 7.1%. |
| 3 | $59.8B Value (2024) | IMARC reports growth to USD 124.6B by 2033, CAGR ~8.5%. |
| 4 | $59.18B Systems (2025) | Water purification systems estimated at USD 59.18B, expected to reach USD 123.24B by 2037. |
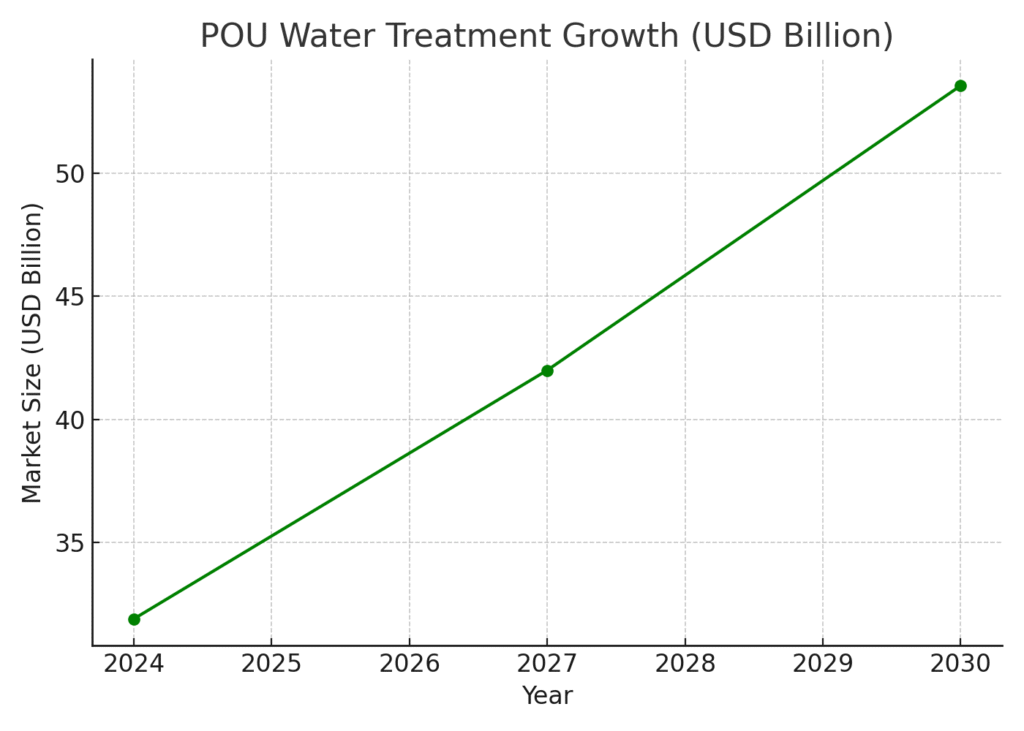
| 5 | $31.90B POU (2024) | Point-of-use water treatment systems projected to grow to USD 53.56B by 2030. |
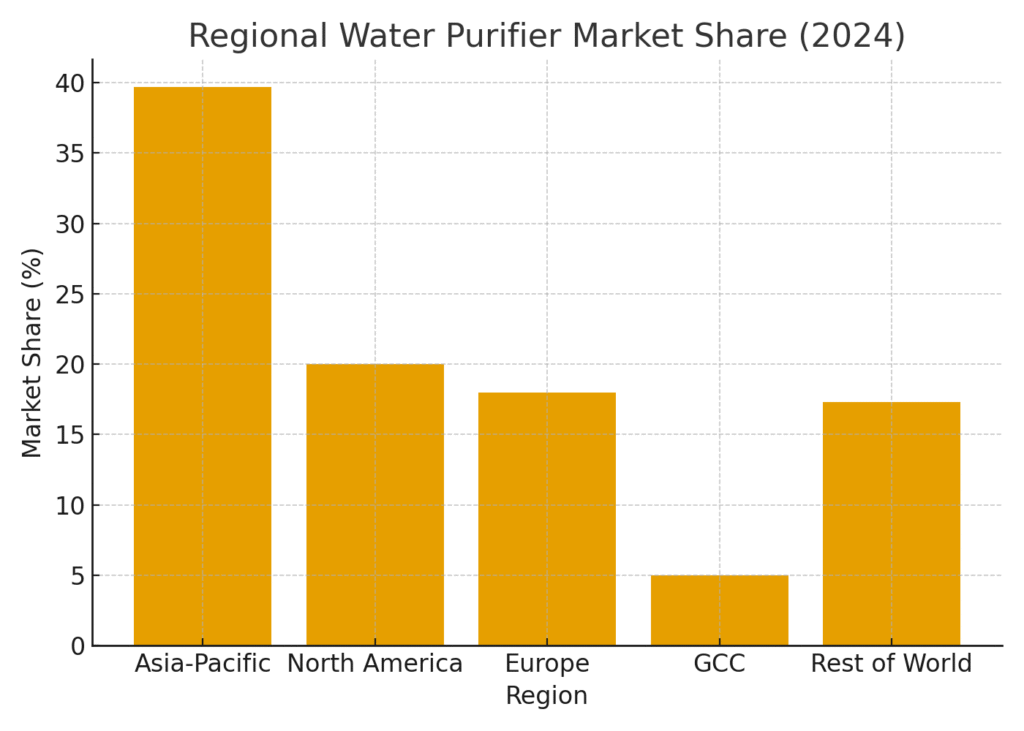
| 6 | Asia-Pacific 39.7% | Region held nearly 40% of the global water purifier market share in 2024. |
| 7 | North America $9.12B | Expected to reach USD 17.93B by 2034 with a CAGR of 7.8%. |
| 8 | GCC $1.9B | Water purifier market in GCC projected to grow steadily at 6.8% CAGR through 2030. |
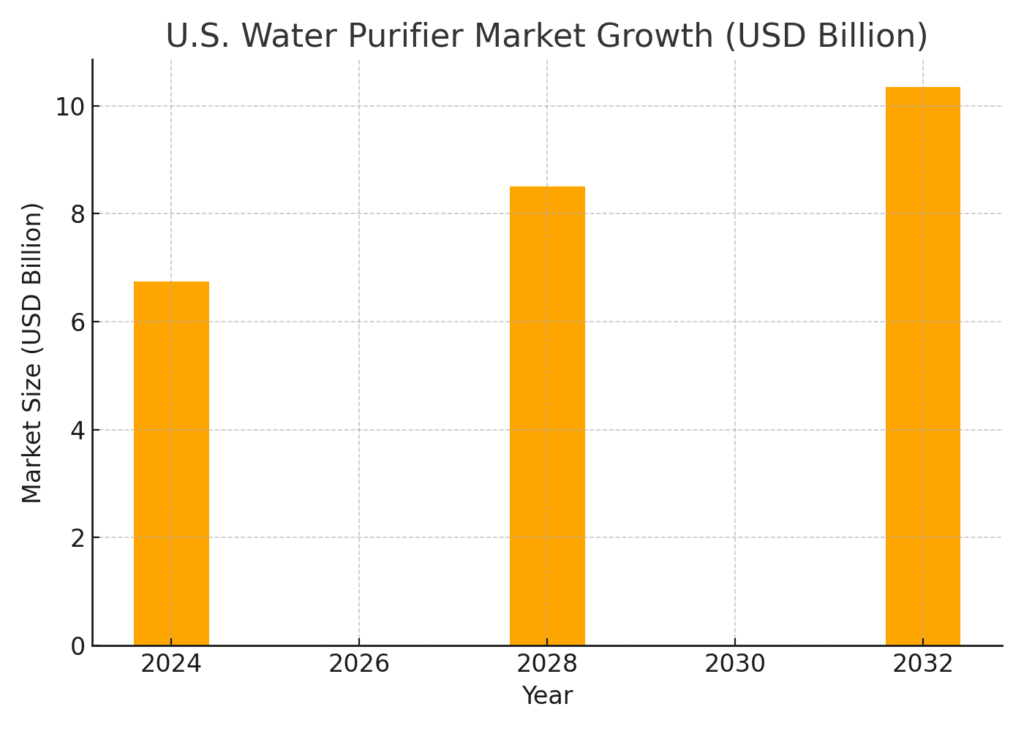
| 9 | U.S. $6.75B (2024) | Forecast to reach USD 10.35B by 2032, CAGR ~5.5%. |
| 10 | U.S. $7.0B (2024) | IMARC projects growth to USD 10.7B by 2033 with CAGR of 4.64%. |
| 11 | RO Systems Lead | Reverse osmosis dominates as the most popular purification technology worldwide. |
| 12 | Tabletop Pitchers | Held the largest product segment share among POU water systems in 2024. |
| 13 | Purifier Bottles $360M | Portable purifier bottle market expected to grow to USD 822M by 2035. |
| 14 | Purification Tablets | Global market forecast to grow at ~5% CAGR from 2023 to 2030. |
| 15 | India +32% Sales | Water purifier sales rise 32% during monsoon season, ~35% of annual sales. |
| 16 | Health Messaging | Consumers strongly respond to health and safety-focused marketing themes. |
| 17 | Smart Purifiers | IoT-enabled purifiers gaining traction in high-income markets. |
| 18 | E-commerce Rising | Online sales channels rapidly growing, though offline remains dominant. |
| 19 | 2B Without Safe Water | About 2 billion people lack access to safe household drinking water globally. |
| 20 | Seasonal Influence | Environmental factors like floods and droughts heavily influence purchase timing. |
Top 20 Water Purification Marketing Statistics 2025
Water Purification Marketing Statistics #1: $35.01B Market (2024)
The global water purifier market reached USD 35.01 billion in 2024, highlighting strong demand worldwide. Consumers are increasingly aware of water safety, which continues to drive adoption. This market is projected to expand further to USD 62.88 billion by 2032, showing healthy growth potential. Brands that emphasize long-term value and safety can benefit from this expanding demand. Marketing strategies should highlight the size and growth trajectory to build credibility with customers.
Water Purification Marketing Statistics #2: $45.7B Estimate (2024)
GM Insights estimated the global water purifier market at USD 45.7 billion in 2024. The forecast suggests growth to USD 88.8 billion by 2034, representing a CAGR of 7.1%. This steady rise reflects both developed and emerging market adoption. Companies that adapt to regional needs, such as compact devices in cities or durable systems in rural areas, will thrive. Marketers should stress adaptability and innovation to align with this broad growth pattern.
Water Purification Marketing Statistics #3: $59.8B Value (2024)
According to IMARC, the market value of water purifiers was USD 59.8 billion in 2024. It is expected to nearly double to USD 124.6 billion by 2033. This demonstrates significant opportunities for both global brands and local players. The CAGR of 8.5% suggests demand will accelerate as awareness and infrastructure improve. Marketers can use these figures to underline the urgency of investment in safe water solutions.
Water Purification Marketing Statistics #4: $59.18B Systems (2025)
The water purification systems market (broader than purifiers) is estimated at USD 59.18 billion in 2025. Forecasts suggest it will grow to USD 123.24 billion by 2037. A CAGR of 6.2% reflects consistent demand across residential, commercial, and industrial segments. This highlights a diversified opportunity for brands targeting multiple customer groups. Marketing campaigns should emphasize the scalability and adaptability of purification systems.
Water Purification Marketing Statistics #5: $31.90B POU (2024)
Point-of-use (POU) water treatment systems were valued at USD 31.90 billion in 2024. They are expected to grow to USD 53.56 billion by 2030, reflecting a CAGR of 9.2%. POU systems are popular because they are affordable and easy to install. Their growth suggests consumers prefer convenient solutions over complex infrastructure. Marketers should focus on convenience, affordability, and everyday usability in campaigns.
Water Purification Marketing Statistics #6: Asia-Pacific 39.7%
In 2024, Asia-Pacific held 39.7% of the global water purifier market. This dominance is due to large populations and water quality concerns in countries like India and China. Rapid urbanization and rising incomes further drive demand. Brands entering this region must tailor solutions to affordability and reliability. Marketing strategies should emphasize accessibility and health benefits for mass-market appeal.
Water Purification Marketing Statistics #7: North America $9.12B
North America’s purifier market was valued at USD 9.12 billion in 2025. It is projected to reach USD 17.93 billion by 2034, at a CAGR of 7.8%. Demand is driven by health-conscious consumers and innovations in smart purifiers. Brands with strong after-sales services are likely to dominate this market. Marketers should emphasize technology, health assurance, and service reliability.
Water Purification Marketing Statistics #8: GCC $1.9B
The Gulf Cooperation Council (GCC) water purifier market stood at USD 1.9 billion in 2024. It is forecasted to grow at a CAGR of 6.8% through 2030. Water scarcity and reliance on desalination make purification systems critical. Brands offering energy-efficient and durable systems have strong opportunities here. Marketers should emphasize sustainability and reliability for GCC consumers.
Water Purification Marketing Statistics #9: U.S. $6.75B (2024)
The U.S. water purifier market was valued at USD 6.75 billion in 2024. Projections suggest growth to USD 10.35 billion by 2032, reflecting a CAGR of 5.5%. Consumers are increasingly investing in advanced RO and smart filtration systems. Health awareness is the major driver of this growth. Marketing strategies should stress premium features and certifications.
Water Purification Marketing Statistics #10: U.S. $7.0B (2024)
Another study placed the U.S. purifier market at USD 7.0 billion in 2024. It is expected to reach USD 10.7 billion by 2033. The CAGR of 4.64% reflects steady but moderate growth. This shows a mature market where brand trust and innovation drive purchases. Marketers should highlight brand credibility and unique features to differentiate.
Water Purification Marketing Statistics #11: RO Systems Lead
Reverse osmosis (RO) systems continue to dominate global water purifier sales. They are highly effective at removing a wide range of contaminants. Consumers prefer RO for its perceived thoroughness and reliability. However, marketers must also address concerns around water wastage. Brands can win by promoting eco-friendly RO systems with strong benefits messaging.
Water Purification Marketing Statistics #12: Tabletop Pitchers
Tabletop water filter pitchers had the largest product share among POU systems in 2024. Their affordability and convenience drive widespread adoption. They appeal to urban consumers seeking quick solutions. Marketers can emphasize affordability and portability in campaigns. This segment is ideal for online promotions and impulse purchases.
Water Purification Marketing Statistics #13: Purifier Bottles $360M
The global portable purifier bottle market was worth USD 360.2 million in 2025. It is expected to grow to USD 822 million by 2035, with an 8.6% CAGR. This reflects growing demand for travel and outdoor hydration solutions. Brands targeting millennials and outdoor enthusiasts will benefit. Marketing should focus on lifestyle, convenience, and eco-consciousness.
Water Purification Marketing Statistics #14: Purification Tablets
The water purification tablet market is projected to grow at ~5% CAGR through 2030. Tablets offer emergency and portable solutions where devices are impractical. They are popular in disaster relief and outdoor activities. Marketers should target NGOs, government buyers, and adventure markets. Campaigns can emphasize portability, low cost, and effectiveness.
Water Purification Marketing Statistics #15: India +32% Sales
In India, purifier sales surge 32% during the monsoon season. Around 35% of annual purchases occur during this period. Seasonal demand reflects consumer concern over water contamination from rains. Brands that run seasonal campaigns benefit the most. Marketers should align promotions with environmental and seasonal triggers.
Water Purification Marketing Statistics #16: Health Messaging
Health and safety-focused marketing strongly influences consumer choices. Messages about bacteria, heavy metals, and chemical removal resonate deeply. Consumers equate purified water with family health and status. Marketers must highlight certifications and scientific validation in campaigns. Building emotional connections around wellness ensures higher brand trust.
Water Purification Marketing Statistics #17: Smart Purifiers
IoT-enabled smart purifiers are gaining traction in high-income markets. Features like filter life tracking and mobile alerts add convenience. Consumers value innovation that makes water safety easier. Marketers should emphasize tech-driven benefits in advertising. Highlighting convenience and long-term savings will attract tech-savvy buyers.
Water Purification Marketing Statistics #18: E-Commerce Rising
Although offline sales dominate, e-commerce channels for water purifiers are expanding rapidly. Online platforms allow for price comparison and wide availability. This growth presents strong opportunities for digital-first brands. Marketers should invest in online campaigns, reviews, and influencer collaborations. Optimizing product listings for SEO is also crucial.
Water Purification Marketing Statistics #19: 2B Without Safe Water
Globally, about 2 billion people lack access to safe drinking water. This creates both a humanitarian issue and a market opportunity. Companies that address affordability and accessibility will lead in emerging markets. Social responsibility messaging resonates strongly with consumers. Marketing campaigns should combine purpose with product promotion.
Water Purification Marketing Statistics #20: Seasonal Influence
Environmental triggers such as floods, droughts, and monsoons influence purchase patterns. These events make consumers prioritize water safety. Seasonal demand spikes allow for targeted promotional campaigns. Brands that plan around these cycles see higher sales. Marketers should adapt strategies to environmental realities.
Final Thoughts on Water Purification Marketing Statistics
As I wrap up this deep dive into water purification marketing statistics, I can’t help but feel excited about how these insights can shape smarter strategies moving forward. Whether it’s tapping into seasonal purchase behaviors, leveraging smart technology, or addressing health-conscious buyers, the opportunities in this industry are bigger than ever. Personally, I’ve learned that the best campaigns don’t just push products—they connect with the urgency and values people hold around clean water. And with the guidance of a trusted leading marketing agency in New York, I’m confident these statistics can be transformed into campaigns that not only sell but also inspire.
SOURCES
- https://www.fortunebusinessinsights.com/us-water-purifier-market-104696
- https://www.fortunebusinessinsights.com/water-purifier-market-103118
- https://www.precedenceresearch.com/north-america-water-purifier-market
- https://www.gminsights.com/industry-analysis/water-purifier-market
- https://www.gminsights.com/industry-analysis/water-purification-systems-market
- https://www.imarcgroup.com/united-states-water-purifier-market
- https://www.imarcgroup.com/water-purifier-market-statistics
- https://www.transparencymarketresearch.com/water-purifier-market.html
- https://www.factmr.com/report/water-purifier-market
- https://www.prnewswire.com/news-releases/point-of-use-water-treatment-systems-market-worth-20-447-5-million-in-2030-exclusive-report-by-marketsandmarkets-302474080.html
- https://www.forbes.com/councils/forbesbusinesscouncil/2023/11/15/growth-trends-in-the-water-purification-industry/
- https://www.techsciresearch.com/report/water-purifiers-market/4025.html
- https://www.researchandmarkets.com/report/united-states-water-purifier-market?srsltid=AfmBOorVAXSNoXZVgZ-8uJ4U6rZpbMNu9rd2_lFGnRfdiuMcbH63yYgG
- https://www.nsf.org/news/new-research-reveals-water-filter-owners-more-likely-trust-independently-certified-water-filter