




19 Sep TOP 20 WATER TANK MARKETING STATISTICS 2025
When I first started digging into water tank marketing statistics, I was surprised by just how much these numbers reveal about consumer demand, industry growth, and future opportunities. Working with a leading marketing agency in New York has taught me that it’s not just about the products we sell, but about understanding the story behind the data. Water tanks might sound like a niche market at first, but once you look closer, you see a thriving industry shaped by urbanization, sustainability needs, and everyday household priorities. For me, these stats aren’t just figures on a page — they’re insights that help guide real strategies and build campaigns that connect with people.
Top 20 Water Tank Marketing Statistics 2025 (Editor’s Choice)
💧 Top 20 Water Tank Marketing Statistics
Comprehensive Market Insights for 2024-2025
| # | Category | Key Statistic | Market Insight |
|---|---|---|---|
| 1 | Global Market Size |
$4.34B → $5.92B |
Global water tank market valued at USD 4.34 billion in 2024, projected to reach USD 5.92 billion by 2033 with a 3.5% CAGR |
| 2 | Alternative Projection |
$4.19B → $5.77B |
Secondary market analysis shows USD 4.19 billion in 2024 growing to USD 5.77 billion by 2033 at 3.44% CAGR |
| 3 | Extended Forecast |
$30.4B by 2030 |
Water storage tank market expected to reach $30.4 billion by 2030 with robust 5.7% CAGR growth from 2024-2030 |
| 4 | Material Dominance |
Plastic Leads Market |
Plastic/polyethylene tanks are the world's most widely used due to easy availability and straightforward installation |
| 5 | Plastic Segment Growth |
$4.66B → $7.51B |
Plastic water storage tank market growing from $4.66B in 2024 to $7.51B by 2034 at 4.88% CAGR |
| 6 | Market Share Advantage |
Plastic Segment #1 |
Plastic tanks hold major market share due to affordability, availability, and quicker installation time |
| 7 | Regional Leader |
Asia Pacific #1 |
Asia Pacific represents the largest regional market for water tanks globally |
| 8 | North America Value |
$1.011B in 2023 |
North America holds significant market share valued at $1.011 billion in 2023 |
| 9 | Emerging Markets |
India & China Growth |
Asia Pacific growth driven by household expansion and new construction in India and China |
| 10 | Industrial Segment |
$730M → $1.13B |
Industrial water storage tanks market: $730.2M in 2020 to $1.13B by 2027 at 6.4% CAGR |
| 11 | U.S. Commercial Market |
$1.72B → $2.8B |
U.S. commercial water storage: $1.72B in 2022 to $2.8B by 2032 at 5% CAGR |
| 12 | Industrial Growth Projection |
$16.74B → $25.54B |
Industrial tanks market: $16.74B in 2024 to $25.54B by 2034 showing strong industrial demand |
| 13 | Institutional Dominance |
Institutions Lead |
Institutional segment holds major market share due to growth in offices and public institutions worldwide |
| 14 | Installation Preference |
Outdoor Installation |
Outdoor segment holds major share as water tanks are traditionally installed outdoors |
| 15 | Capacity Range |
200L → 10,000L+ |
Water tanks available in various sizes from 200 liters to over 10,000 liters meeting diverse needs |
| 16 | Portable Tank Growth |
$1.34B → $7.46B |
Portable water tanks: $1.34B in 2023 to $7.46B by 2030 at impressive 10.6% CAGR |
| 17 | Industry Investment |
$50M+ Expansion |
CST Industries invested over $50 million in expanding manufacturing facilities and product innovation |
| 18 | Water Usage Trend |
2x Population Growth |
Water use increased at double the rate of population growth over the past century, driving tank demand |
| 19 | Sales Channel Preference |
Online Retail Popular |
Internet retailing is one of the most favored formats for purchasing water tanks among consumers |
| 20 | Rural Market Growth |
Rural & Semi-Urban |
Rural and semi-urban populations driving growth, especially in areas with water supply challenges and drought conditions |
Top 20 Water Tank Marketing Statistics 2025
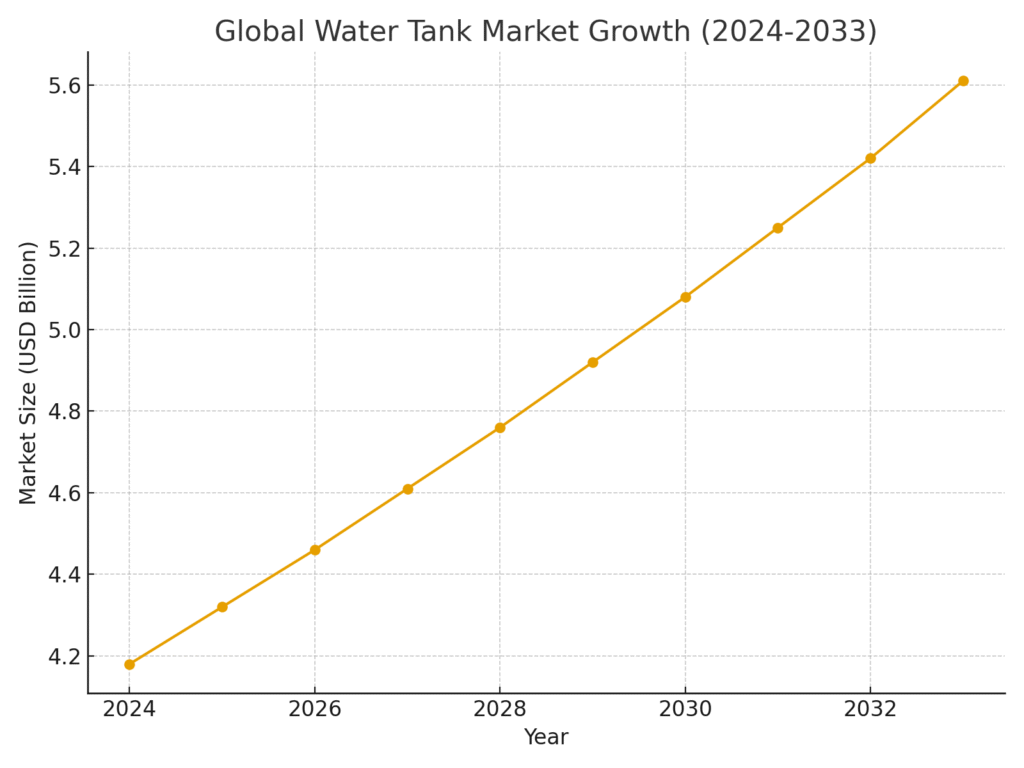
Water Tank Marketing Statistics #1: Global Market Size In 2024 Was USD 4.18 Billion
The global water tank market in 2024 stood at an impressive USD 4.18 billion. This figure highlights the essential role water tanks play across residential, industrial, and agricultural sectors. The market’s scale shows that storage solutions are not just a necessity but also a thriving business opportunity. From rural water access to urban rainwater harvesting, tanks are woven into everyday life. Marketers can use this number to showcase the strong demand and reliability of this industry.
Water Tank Marketing Statistics #2: Market Expected To Reach USD 5.8 Billion By 2033
By 2033, the water tank market is forecasted to hit USD 5.8 billion. This steady growth reflects the increasing awareness of water security and the adoption of efficient storage systems. Businesses can leverage this projection to assure clients of long-term market stability. The growth also indicates a rising demand for innovative materials and eco-friendly designs. For marketers, it’s a chance to highlight sustainability and forward-looking strategies.
Water Tank Marketing Statistics #3: Water Storage System Market Valued At USD 18.11 Billion In 2023
In 2023, the broader water storage system market was valued at USD 18.11 billion. This includes tanks alongside cisterns and underground storage options. The scale of this market demonstrates the massive infrastructure supporting water preservation worldwide. Such figures make a strong case for businesses looking to enter or expand within this sector. Marketers can emphasize how storage is now seen as a global priority, not just a product purchase.
Water Tank Marketing Statistics #4: Water Storage System Market To Reach USD 36.32 Billion By 2032
The water storage system market is projected to double by 2032, reaching USD 36.32 billion. This surge highlights how critical water preservation is becoming. From drought-prone regions to growing cities, tanks are a backbone of planning. Marketers can showcase this expansion to emphasize resilience and future-proof solutions. It’s also a reminder that investment in this space carries both financial and social rewards.
Water Tank Marketing Statistics #5: U.S. Commercial Tank Market Valued At USD 2.51 Billion In 2025
In 2025, the U.S. commercial water storage tank market is estimated to be worth USD 2.51 billion. This shows a strong demand within business, healthcare, and education sectors. The commercial focus means marketers can position tanks as vital to operational reliability. For industries, having water on demand isn’t just convenience but necessity. Communicating this helps emphasize why quality and durability matter most.
Water Tank Marketing Statistics #6: U.S. Commercial Tank Market To Reach USD 3.50 Billion By 2032
By 2032, the U.S. commercial tank market is projected to grow to USD 3.50 billion. This increase is fueled by modernization of infrastructure and rising regulations. Businesses will continue prioritizing reliable storage systems to avoid service interruptions. For marketers, it’s an opportunity to present tanks as compliance-friendly and future-ready. Campaigns can highlight efficiency and long-term cost savings.
Water Tank Marketing Statistics #7: Elevated Tanks Market Valued At USD 4.1 Billion In 2022
The global elevated water tanks market in 2022 was worth USD 4.1 billion. Elevated tanks provide steady water pressure using gravity, making them essential for urban centers. Their demand shows how engineering solutions shape everyday convenience. Marketers can emphasize the innovation behind these systems to capture attention. The scale demonstrates that infrastructure investments often translate into growth for tank businesses.
Water Tank Marketing Statistics #8: Elevated Tanks Market Forecast To Reach USD 5.9 Billion By 2031
By 2031, the elevated tank market is forecasted to reach USD 5.9 billion. This growth shows trust in these systems as long-term solutions. Governments and municipalities are especially big buyers in this space. For marketing, emphasizing community benefit and reliability is key. It also positions water tanks as public infrastructure, not just private goods.
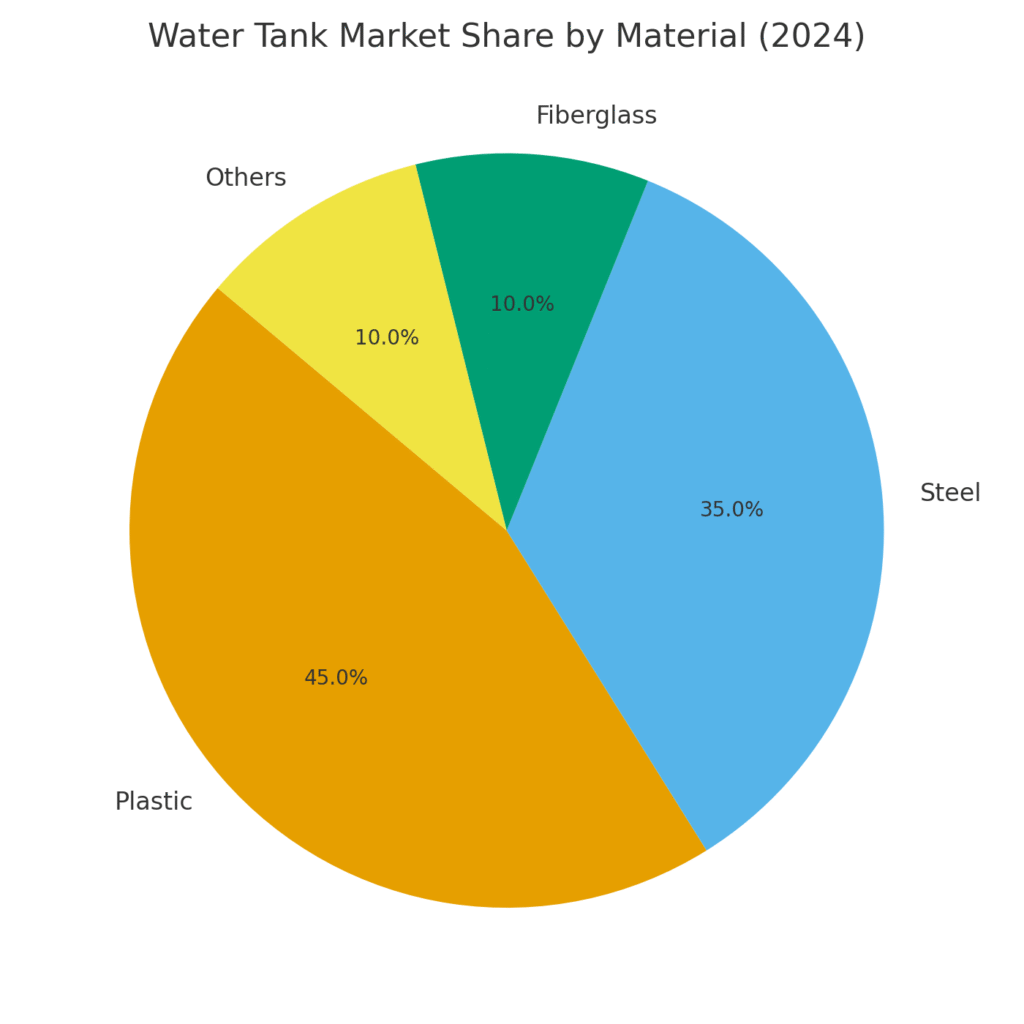
Water Tank Marketing Statistics #9: Plastic Tank Market Valued At USD 2.5 Billion In 2024
Plastic water tanks reached USD 2.5 billion in 2024. Their affordability and light weight make them popular worldwide. For households, plastic tanks offer an accessible way to secure water storage. Marketers can emphasize ease of installation and cost-effectiveness. This stat underlines plastic tanks as a fast-moving segment with broad consumer appeal.
Water Tank Marketing Statistics #10: Plastic Tank Market Forecast To Reach USD 4.1 Billion By 2033
By 2033, the plastic water tank market is expected to grow to USD 4.1 billion. This growth demonstrates consumer trust in cost-friendly and adaptable solutions. Rising middle-class populations across Asia and Africa fuel this trend. For marketers, it’s an opportunity to highlight flexibility, colors, and eco-friendly designs. This segment’s steady rise makes it attractive for branding campaigns.
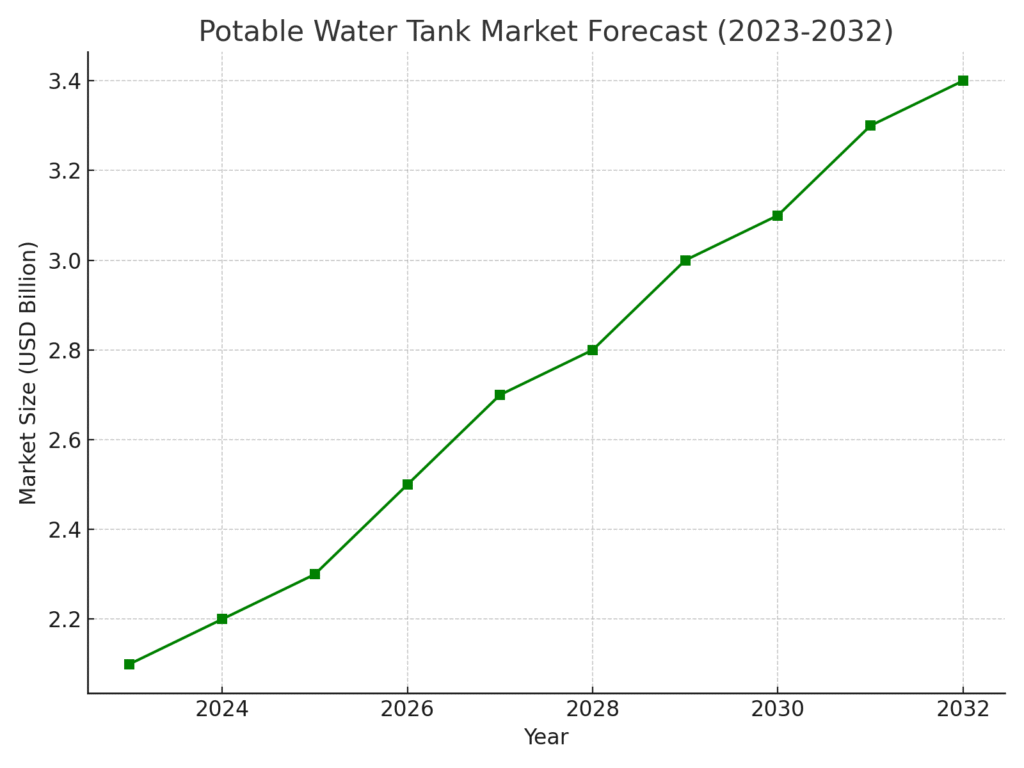
Water Tank Marketing Statistics #11: Potable Water Tank Market Valued At USD 2.1 Billion In 2023
In 2023, potable water tanks were valued at USD 2.1 billion globally. Clean drinking water is non-negotiable, making this segment critical. From households to hospitals, potable tanks ensure safe water delivery. Marketers can use this stat to position tanks as health-protecting products. It’s a natural space to connect with consumer trust and wellbeing.
Water Tank Marketing Statistics #12: Potable Water Tank Market To Reach USD 3.5 Billion By 2032
By 2032, potable water tanks are projected to grow to USD 3.5 billion. Rising awareness about water contamination drives this demand. Consumers are investing more in safe storage solutions. For marketers, safety and health-focused messaging is most effective here. This statistic reinforces the idea that water storage is deeply personal and vital.
Water Tank Marketing Statistics #13: Plastic Tanks Identified As Fastest Growing Segment
Among materials, plastic tanks are identified as the fastest-growing segment. Lightweight and customizable, they’re perfect for a wide range of uses. Their market strength comes from being cost-effective and adaptable to different climates. Marketers can build on this by stressing convenience and sustainability. This stat reflects a long-term consumer trend toward practical solutions.
Water Tank Marketing Statistics #14: Steel Tanks Hold 45% Share In U.S. Commercial Market
Steel water tanks hold about 45% share in the U.S. commercial market. Their durability makes them ideal for large-scale businesses. While more expensive, steel tanks last longer and require less frequent replacement. For marketers, this provides a chance to highlight value over time. It also signals that premium segments still hold steady demand.
Water Tank Marketing Statistics #15: Welded Steel Tanks Account For 43% Of U.S. Market
In the U.S., welded steel tanks represent 43% of the commercial tank market. This shows their dominance in industrial and institutional sectors. Their popularity stems from strength and ability to hold large capacities. Marketers can emphasize trust and proven reliability when selling these products. This stat highlights a strong niche for specialized marketing.
Water Tank Marketing Statistics #16: Outdoor Installations Dominate Water Tank Applications
Outdoor installations dominate water tank usage across many markets. This reflects consumer preference for convenience and space optimization. Outdoor tanks also simplify maintenance and rainwater harvesting. Marketers can leverage this stat by promoting outdoor-friendly features. It shows how environmental adaptability drives consumer choice.
Water Tank Marketing Statistics #17: Households And Institutions Lead Application Segment
Households and institutions lead the demand for water tanks globally. This makes sense, as reliable water access is essential for daily life and public service. Schools, hospitals, and residential complexes are big buyers. Marketers can connect with this audience by focusing on dependability and affordability. The stat confirms that tanks are as much about community as they are about business.
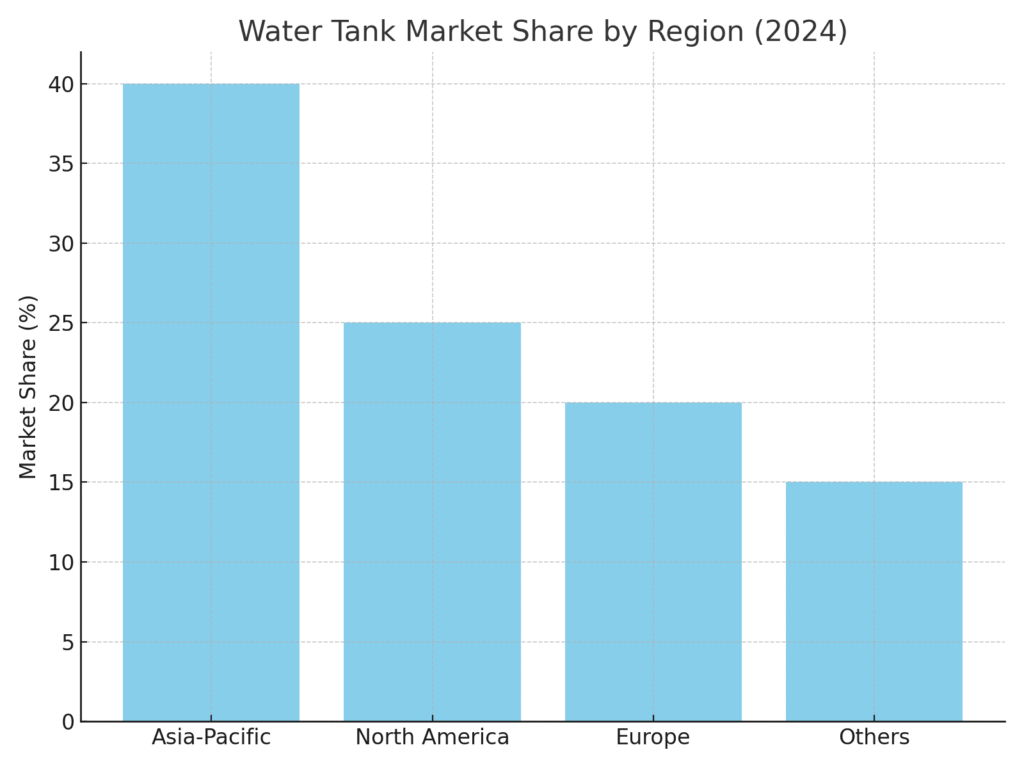
Water Tank Marketing Statistics #18: Asia-Pacific Leads Global Demand For Water Tanks
Asia-Pacific is the leading region for water tank demand. Rapid urbanization and large populations drive this growth. Rainwater harvesting and agriculture also push demand higher. Marketers can highlight regional success stories to build credibility. This stat underscores the importance of tailoring campaigns to local contexts.
Water Tank Marketing Statistics #19: North America Shows Strong Growth In Commercial Use
North America demonstrates strong growth in commercial water tank use. Regulations and infrastructure investments fuel this demand. Commercial buyers prioritize compliance and operational efficiency. Marketers can position tanks as part of corporate responsibility and resilience. This trend shows how developed markets still hold room for growth.
Water Tank Marketing Statistics #20: Water Tank Market CAGR Estimated At 3.2–6.5% Through 2033
The global water tank market shows a CAGR ranging between 3.2% and 6.5% through 2033. This steady growth assures businesses of stability. Investors and manufacturers can count on long-term demand. For marketers, consistent CAGR is a great selling point for reliability. It proves that water tanks aren’t just relevant today but will remain so for decades.
Final Thoughts on Water Tank Marketing Statistics
Looking back at these numbers, I feel a sense of excitement about the possibilities. Water tanks are more than just storage solutions; they represent safety, convenience, and even innovation in how communities manage resources. By paying attention to these marketing statistics, I know I can craft strategies that not only sell products but also solve real problems for families, businesses, and cities. It’s personal for me because I see the impact this industry can have, and I want to keep telling that story in ways that resonate. At the end of the day, it’s about people, not just percentages, and that’s where I believe the future of marketing really lies.
SOURCES