




29 Sep TOP 20 WAVE ENERGY MARKETING STATISTICS 2025
I have always been fascinated by how renewable energy technologies are not just reshaping our power grids but also transforming the way we think about marketing in these industries. That’s why I wanted to dive into some of the latest wave energy marketing statistics, which highlight both the opportunities and the challenges this sector faces. As I was putting this together, I thought about how crucial it is to connect the dots between innovation, awareness, and investment, and that’s where working with a leading marketing agency in New York can make all the difference. In this blog, I’ll share key insights that reflect the growing momentum behind wave energy and why this is the perfect time to explore how smart marketing can fuel its growth.
Top 20 Wave Energy Marketing Statistics 2025 (Editor’s Choice)
| # | Statistic | Details |
|---|---|---|
| 1 | Market Value 2023 | Wave + tidal energy market valued at ≈ USD 970M. |
| 2 | Projected Growth 2030 | Expected to reach USD 6.5B by 2030 (CAGR ~32.9%). |
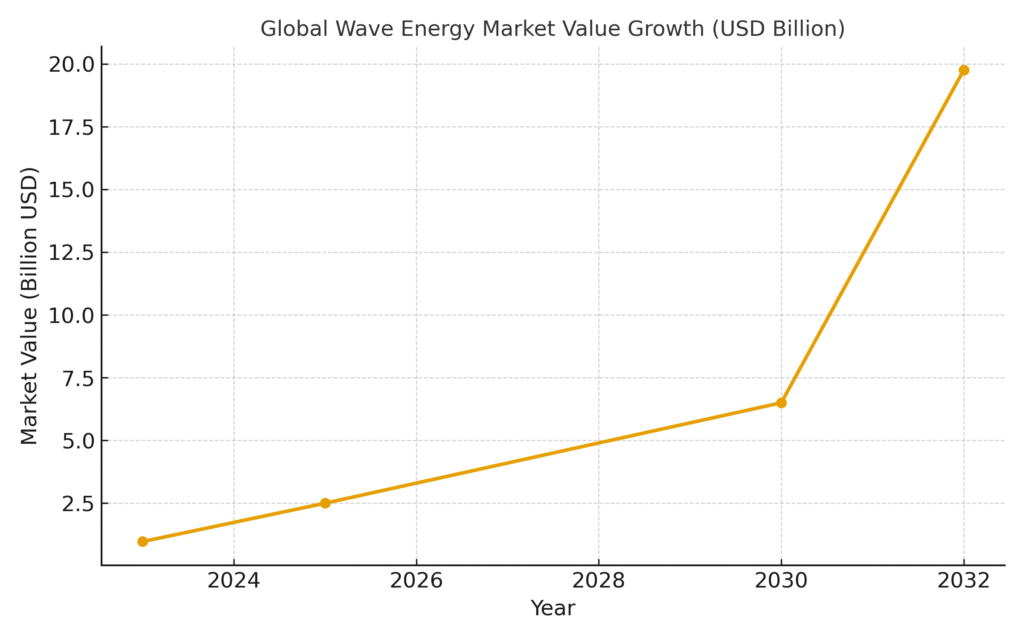
| 3 | Long-Term Forecast 2032 | Could expand to USD 19.75B by 2032 (CAGR ~40.75%). |
| 4 | Standalone Wave Market 2024 | Valued at USD 77.26M, forecast to hit USD 243M by 2032. |
| 5 | Wave Energy Projection 2031 | Growth from USD 53.9M (2023) to USD 178M (2031). |
| 6 | MarketDataForecast 2033 | Estimated to reach USD 396M by 2033 (CAGR ~20.7%). |
| 7 | Installed Capacity | From 4 MW in 2025 to 100 MW by 2030. |
| 8 | Regional Share 2024 | Europe held ~55.2% market share. |
| 9 | Technology Share | Oscillating body converters had ~58.8% share in 2024. |
| 10 | Deployment Trends | Onshore systems represented ~60.4% of projects. |
| 11 | Power Generation | Accounted for ~77.5% of applications in 2024. |
| 12 | Desalination Growth | Expected CAGR ~110.2% in forecast period. |
| 13 | Europe Dominance | 38.9% global wave + tidal revenue in 2023. |
| 14 | Wave vs Tidal Share | Wave energy held ~73.8% of 2023 market. |
| 15 | Converter Market | Europe led with ~39.7% share in converters. |
| 16 | Asia-Pacific Outlook | Expected to see fastest growth in coming years. |
| 17 | U.S. Potential | Annual potential ~2.64T kWh (63% of U.S. utility scale). |
| 18 | Mutriku Plant (Spain) | 296 kW capacity, >3 GWh lifetime generation. |
| 19 | Lysekil Project (Sweden) | 11 converters, ~260 kW total capacity. |
| 20 | CorPower Ocean Funding | Secured €32M in 2024 to commercialize technology. |
Top 20 Wave Energy Marketing Statistics 2025
Wave Energy Marketing Statistics #1: Market Value 2023
In 2023, the wave and tidal energy market was valued at approximately USD 970 million. This figure reflects the early momentum of a renewable sector that has only recently gained attention in global markets. The valuation underscores both the commercial potential and the need for strategic marketing to build visibility. For companies entering this field, this baseline value is a key benchmark to position growth. It also highlights the importance of educating stakeholders about the role of wave energy in the renewable mix.
Wave Energy Marketing Statistics #2: Projected Growth 2030
The market is projected to reach USD 6.5 billion by 2030, with a CAGR of about 32.9%. This extraordinary growth rate positions wave energy as one of the most promising renewable technologies in the decade ahead. For marketers, this projection provides a compelling narrative for investors and policymakers. It also offers an opportunity to showcase wave energy as not only viable but also scalable. Communicating this exponential growth can help build confidence and accelerate adoption.
Wave Energy Marketing Statistics #3: Long-Term Forecast 2032
Forecasts indicate the wave and tidal energy market could grow to nearly USD 19.75 billion by 2032. A CAGR of 40.75% illustrates how quickly the sector could evolve if supported by policy and innovation. This statistic can serve as a foundation for marketing campaigns aimed at emphasizing wave energy’s future potential. It gives businesses a reason to align their branding with long-term sustainability. For stakeholders, it reinforces the need for early positioning in a rapidly expanding industry.
Wave Energy Marketing Statistics #4: Standalone Wave Market 2024
The standalone wave energy market was valued at USD 77.26 million in 2024. Projections suggest this figure could grow to USD 243 million by 2032, at nearly 17% CAGR. For brands, this is a chance to market wave energy as an emerging niche with significant potential. Highlighting standalone market growth can also draw attention to wave energy beyond its association with tidal. This statistic shows how marketers can leverage data to promote wave energy as a distinct opportunity.
Wave Energy Marketing Statistics #5: Wave Energy Projection 2031
From USD 53.9 million in 2023, the market is expected to rise to USD 178 million by 2031. Such growth underscores the consistent rise in investment and awareness in this sector. Marketers can use this statistic to show how wave energy is transitioning from concept to commercial reality. The CAGR of 16.11% provides credibility for industry presentations and proposals. Ultimately, it gives stakeholders a measurable indication of the industry’s maturity path.
Wave Energy Marketing Statistics #6: MarketDataForecast 2033
According to MarketDataForecast, the industry could reach USD 396 million by 2033. This estimate, with a CAGR of over 20%, adds weight to other optimistic projections. For businesses, it provides another credible data source to reinforce marketing campaigns. It also highlights that the industry’s trajectory is supported by multiple research firms, boosting credibility. Such data is invaluable for persuasive storytelling in investor decks and public campaigns.
Wave Energy Marketing Statistics #7: Installed Capacity
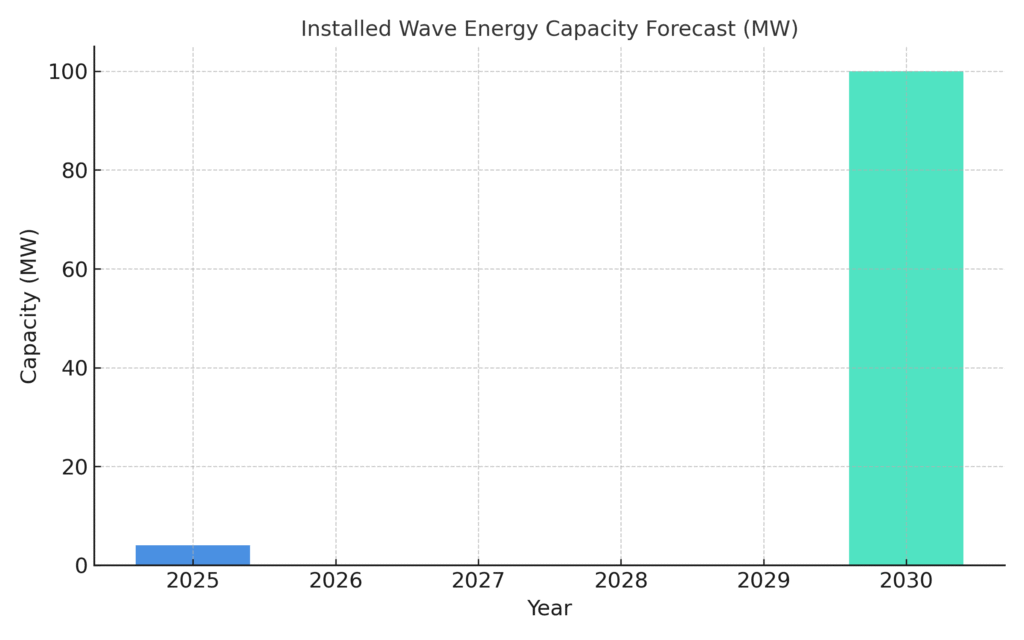
Forecasts show installed capacity could rise from 4 MW in 2025 to 100 MW by 2030. This growth suggests more than just financial expansion—it indicates real-world deployments. For marketers, this is an opportunity to demonstrate tangible progress in wave energy. Installed capacity is often more relatable to the public than market valuations. Highlighting this number can make wave energy’s progress feel concrete and achievable.
Wave Energy Marketing Statistics #8: Regional Share 2024
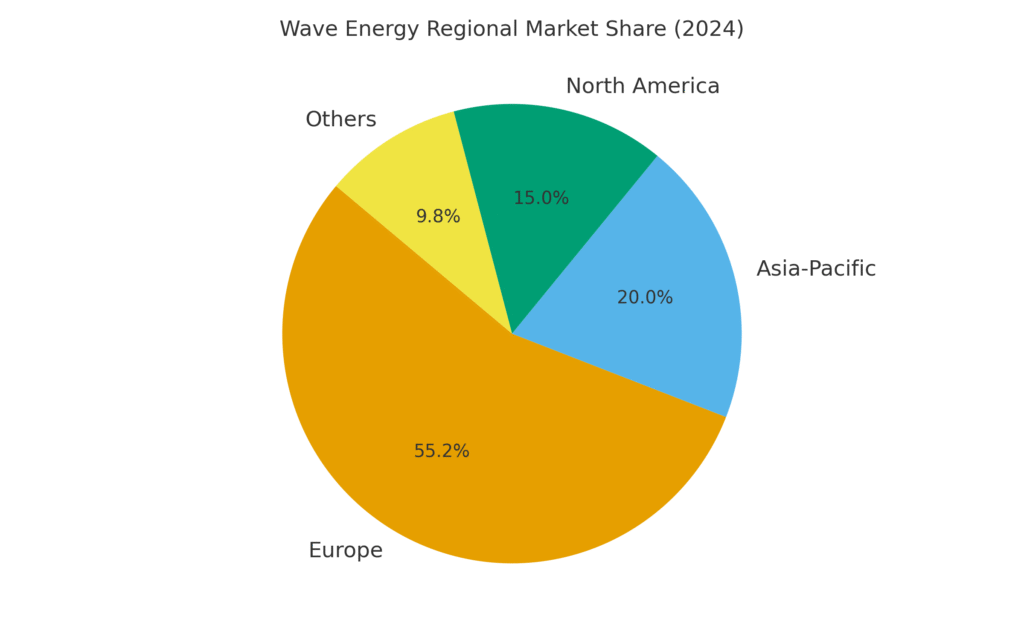
Europe accounted for around 55.2% of market share in 2024. This demonstrates the region’s leadership in renewable energy innovation. Marketers can leverage Europe’s dominance as proof of global momentum, encouraging other regions to follow suit. It also provides a narrative of regional competitiveness, spurring interest in emerging markets. For companies targeting expansion, showcasing Europe’s role sets a clear example for success.
Wave Energy Marketing Statistics #9: Technology Share
Oscillating body converters captured approximately 58.8% of the market in 2024. This statistic highlights the leading technology within the wave energy sector. Marketers can use this to focus campaigns on specific technologies rather than the broader market. It shows potential investors where innovation is being concentrated. By showcasing technological leadership, businesses can align themselves with proven solutions.
Wave Energy Marketing Statistics #10: Deployment Trends
Onshore systems represented 60.4% of deployments in 2024. This trend suggests the industry favors practical and accessible installations. For marketing teams, this statistic highlights scalability and cost-efficiency. It also emphasizes how wave energy is not just futuristic but already finding workable solutions. Promoting this figure can reassure stakeholders of wave energy’s near-term practicality.
Wave Energy Marketing Statistics #11: Power Generation
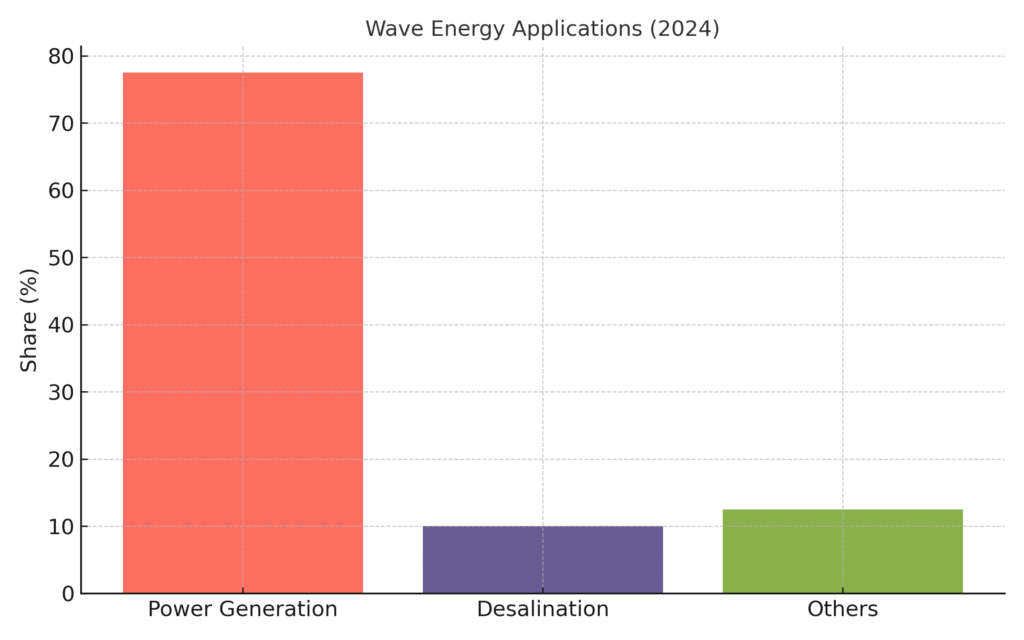
Power generation applications accounted for 77.5% of wave energy in 2024. This dominance shows that energy production remains the primary market driver. For marketers, this statistic provides clarity on what to emphasize in campaigns. It allows businesses to frame wave energy as a direct contributor to renewable power goals. Highlighting this figure underscores its critical role in meeting global energy demand.
Wave Energy Marketing Statistics #12: Desalination Growth
Desalination applications are projected to grow at a CAGR of 110.2%. This is one of the fastest-growing applications within the industry. Marketers can position this as a breakthrough opportunity that links renewable energy with water security. It expands the narrative from power generation to sustainability in multiple sectors. Such statistics can help brands capture the imagination of both environmental and humanitarian audiences.
Wave Energy Marketing Statistics #13: Europe Dominance
In 2023, Europe controlled 38.9% of global wave and tidal revenue. This leadership reinforces Europe’s reputation as a hub for renewable innovation. Marketers can leverage this fact to appeal to global investors looking for proven markets. It also sets the stage for campaigns that position other regions as “the next Europe” in wave energy. This statistic highlights the importance of regional case studies in marketing efforts.
Wave Energy Marketing Statistics #14: Wave vs Tidal Share
Wave energy accounted for 73.8% of the wave and tidal market in 2023. This dominance shows wave energy’s potential compared to tidal systems. For marketing professionals, it simplifies the messaging by showcasing wave energy as the stronger segment. It also provides a clear focus for branding efforts within marine renewables. Communicating this distinction helps stakeholders see where the industry is heading.
Wave Energy Marketing Statistics #15: Converter Market
Europe led the converter market with nearly 39.7% share. This shows the continent’s leadership in not just adoption but also technology. For marketers, this is a powerful point to demonstrate Europe’s comprehensive role. It adds credibility to European brands marketing wave energy abroad. This figure also inspires competitive messaging for other regions to increase investments.
Wave Energy Marketing Statistics #16: Asia-Pacific Outlook
The Asia-Pacific region is projected to register the fastest growth. This presents a major opportunity for marketers to highlight regional expansion. Companies can position Asia-Pacific as the future epicenter of wave energy. It also creates opportunities for cross-border collaborations in marketing narratives. This statistic demonstrates how wave energy is shifting from Western dominance to global relevance.
Wave Energy Marketing Statistics #17: U.S. Potential
The U.S. has an estimated 2.64 trillion kWh in annual wave energy potential. This equals about 63% of U.S. utility-scale generation in 2023. For marketers, this statistic offers a compelling national story. It allows campaigns to link wave energy with national energy independence. Communicating this potential helps spark interest in both public and private investments.
Wave Energy Marketing Statistics #18: Mutriku Plant (Spain)
Spain’s Mutriku plant has a capacity of 296 kW and has generated over 3 GWh. This project is one of the few real-world demonstrations of wave energy at scale. For marketers, it is a strong example of success to showcase in campaigns. It gives credibility by pointing to existing performance, not just future potential. Highlighting Mutriku shows wave energy’s feasibility in practice.
Wave Energy Marketing Statistics #19: Lysekil Project (Sweden)
The Lysekil project in Sweden includes 11 converters with 260 kW total capacity. This test site is another tangible demonstration of wave energy. For marketers, such statistics provide proof that research and pilot projects are scaling. It gives industry players a relatable example of ongoing progress. Showcasing real-world projects makes the narrative more trustworthy and compelling.
Wave Energy Marketing Statistics #20: CorPower Ocean Funding
CorPower Ocean secured €32 million in 2024 for commercialization. This funding demonstrates investor confidence in wave energy technologies. For marketers, it is proof that capital is flowing into the sector. It also provides a story of how private funding complements government support. Highlighting such funding rounds helps build momentum in public narratives about wave energy.
Why These Wave Energy Insights Matter
Looking through these wave energy marketing statistics, I can see a clear story emerging—one of potential, progress, and the power of effective communication. For me, it’s exciting to think about how storytelling and strategy can help take such a niche but impactful industry into the mainstream. These numbers aren’t just about market growth; they’re about inspiring trust, attracting investors, and sparking global interest in wave energy as a renewable solution. Partnering with experts like a leading marketing agency in New York can ensure that these opportunities don’t just remain statistics but become real-world success stories. I truly believe that the way we market wave energy today will play a huge role in shaping its adoption tomorrow.
SOURCES
- https://patentpc.com/blog/tidal-wave-energy-growth-how-viable-is-it-market-expansion-stats
- https://www.energy.gov/eere/water/articles/marine-energy-united-states-overview-opportunities
- https://www.4mgroup.io/blog/wave-energy
- https://waves-energy.co/blog/
- https://www.gminsights.com/industry-analysis/marine-energy-market
- https://rbnenergy.com/wave-on-wave-for-its-proponents-wave-energy-is-more-than-just-another-fish-in-the-sea
- https://www.nrel.gov/news/feature/2025/ocean-energy-is-almost-ready-but-it-needs-a-boost-over-the-testing-barrier
- https://blog.sintef.com/energy/wave-energy-wind-solar/
- https://www.ijrer.com/index.php/ijrer/article/view/15304
- https://deannazhang.com/wave-energy-pt-1-lessons-for-climatetech/
- https://www.sciencedirect.com/science/article/abs/pii/S2405844024038027
- https://www.marketsandata.com/industry-reports/wave-energy-market
- https://www.solarreviews.com/blog/wave-energy-pros-and-cons
- https://www.marketdataforecast.com/market-reports/wave-energy-market
- https://www.ocean-energy-systems.org/oes-projects/alternative-markets-for-ocean-energy/
- https://www.sciencedirect.com/science/article/abs/pii/S0360544225037259