



19 Sep TOP 20 WHEAT MARKETING STATISTICS 2025
I’ve always believed that numbers only matter when they spark a story, and that’s why I pulled together this collection of wheat marketing statistics. Working alongside a leading marketing agency in New York, I’ve seen how the right data point can shift a campaign from guesswork to real traction. These figures aren’t just charts and forecasts to me—they’re the heartbeat of strategies that drive trade, influence pricing, and inspire smarter content for global audiences. By framing them in a way that’s relatable and actionable, I hope you’ll feel the same excitement I do when turning raw data into meaningful campaigns.
Top 20 Wheat Marketing Statistics 2025 (Editor’s Choice)
| Stat # | Key Statistic | Year/Region | Marketing Implication |
|---|---|---|---|
| 1 | Global production hits 816.2 MMT | 2025/26 | Abundant supply, price stability messaging |
| 2 | Global utilization at 803.5 MMT | 2025/26 | Strong demand, build long-term trust |
| 3 | 65% consumed as food | Global | Focus campaigns on food staples |
| 4 | India & China drive 30% food-use growth | 2034 projection | Localize campaigns in Asia |
| 5 | World supplies at ~1,078.6 MMT | 2025/26 | Highlight reliable sourcing |
| 6 | International prices trending down | 2025 | Promote cost savings |
| 7 | EU output ~140.1 MMT | 2025/26 | Emphasize regional traceability |
| 8 | Australia output ~34.5 MMT | 2025/26 | Leverage APAC logistics strength |
| 9 | Russia exports ~43.7 MMT | 2025/26 | Compete with aggressive pricing |
| 10 | Russia harvest ~87.2 MMT | 2025/26 | Stress contract security |
| 11 | North Africa = 15% imports | Global | Target regional campaigns |
| 12 | China adds wheat to feed | 2025/26 | Educate on feed-grade value |
| 13 | U.S. exports ~875M bushels | 2025/26 | Highlight documentation strength |
| 14 | U.S. farm price $5.30/bu | 2025/26 | Offer hedging education |
| 15 | Consumption to grow 11% | By 2034 | Position as long-term partner |
| 16 | Saudi imports ~3.2 MMT | 2025/26 | Highlight flexible volumes |
| 17 | Sanctions weigh on Russia exports | 2024/25 | Offer alternative origins |
| 18 | Russia ties exports to sanctions | 2025 | Stress compliance & risk plans |
| 19 | India reserves ~33.3 MMT | 2025 | Promote quality over urgency |
| 20 | USDA Aug record 806.9 MMT | 2024/25 | Update offers with revisions |
Top 20 Wheat Marketing Statistics 2025
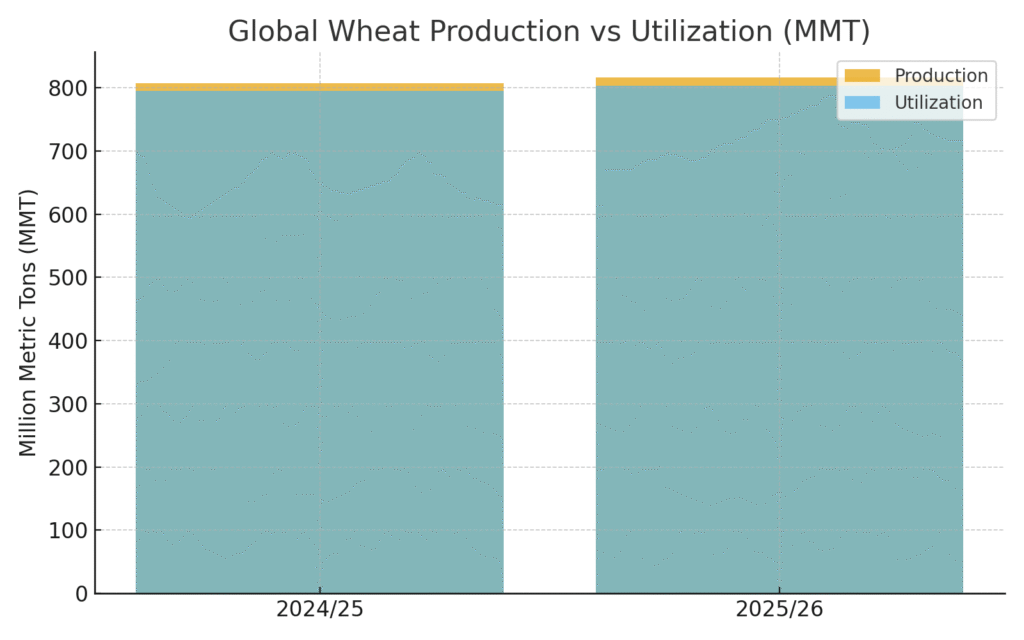
Wheat Marketing Statistics #1: Record Global Production Reaches 816.2 MMT
This record crop signals abundant supply and softer pricing pressure for buyers. Marketers can frame offers around value, availability, and stable sourcing. Content about harvest scale and reliability will reassure procurement teams. Pair this with limited-time freight or warehousing incentives to nudge conversions. Keep a watchlist for weather or logistics shocks that could flip the narrative quickly.
Wheat Marketing Statistics #2: Global Utilization Rises To 803.5 MMT
Rising use means steady end-market pull across food, feed, and industrial segments. Lead with demand resilience in your messaging to counter “glut” fears. Build case studies that show how steady consumption supports long-term contracts. Use this stat as a trust signal on landing pages for subscription or forward-booking offers. Reinforce with testimonials from bakeries or processors that grew volume despite price noise.
Wheat Marketing Statistics #3: About 65% Of Wheat Is Consumed As Food
This anchor justifies consumer-facing storytelling and nutrition education. Position wheat as a consistent staple for price-conscious households and institutional buyers. Feature recipe, bakery, and flour-quality content to match everyday search intent. For B2B, stress milling specs, consistency, and food safety documentation. Align paid search with “flour price,” “bakery supply,” and “whole wheat benefits” queries.
Wheat Marketing Statistics #4: India And China Drive ~30% Of Food-Use Growth To 2034
Two markets shape the trajectory, so localization is non-negotiable. Translate product pages, certifications, and compliance materials for these buyers. Build distributor partnerships that highlight reliable shipment windows and customs fluency. Craft creatives around affordability, nutrition, and food security themes. Plan seasonal pushes around local holidays and procurement cycles in both countries.
Wheat Marketing Statistics #5: World Supplies Total ~1,078.6 MMT
High supplies strengthen a “no-stockout” promise. Promote continuity of grade, protein, and moisture targets to de-risk buyer choices. Offer volume-tiered pricing with transparent logistics surcharges. Create calculators that turn supply data into landed-cost scenarios. Use retargeting to surface pallet-level or container-level deals when buyers revisit.
Wheat Marketing Statistics #6: International Wheat Prices Are Down Year Over Year
Falling benchmarks invite price-match and savings-calculator creatives. Run “pass-through savings” campaigns to convert fence-sitters. Test urgency angles like “book this quarter, hedge next quarter.” Refresh SEO pages to include current index language buyers search for. Train sales to handle “how long will this last?” with clear, time-boxed offers.
Wheat Marketing Statistics #7: EU Production Near ~140.1 MMT
A stronger EU crop supports intra-Europe speed and traceability narratives. Emphasize shorter lead times, sustainability standards, and audit readiness. Publish origin stories and farm-to-mill maps for brand trust. Target importers and bakers who prioritize EU certifications. Offer sampler lots so new buyers can test blends without full commitments.
Wheat Marketing Statistics #8: Australia Output Around ~34.5 MMT
Australian wheat opens Asia-facing logistics advantages. Highlight consistent quality, low contamination risk, and port efficiency. Create APAC-time-zone sales coverage and localized quotations. Use case studies with noodle, biscuit, and feed manufacturers. Promote reliability during Northern Hemisphere weather volatility.
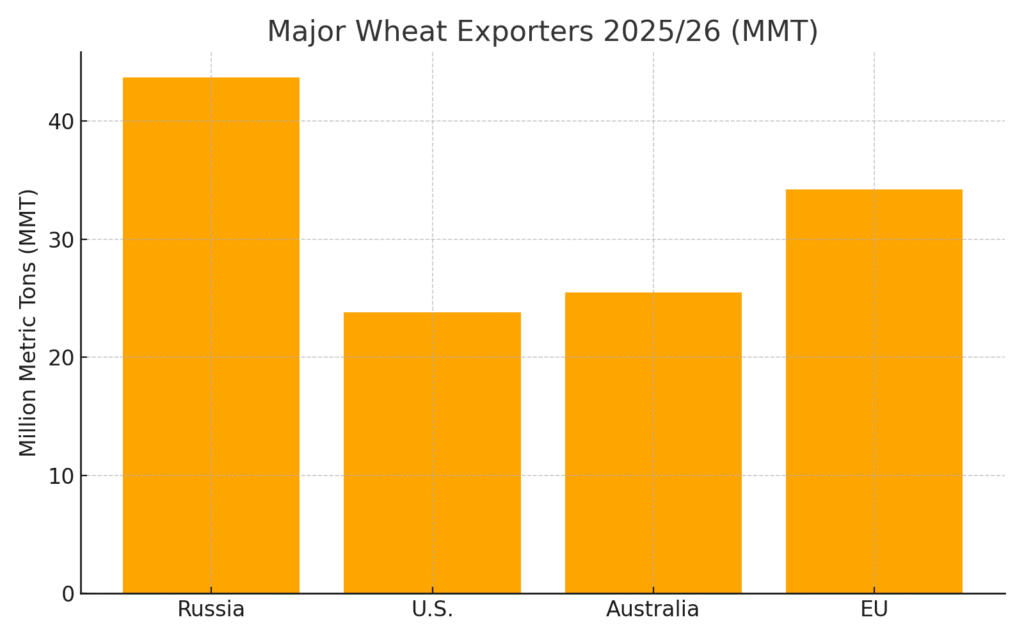
Wheat Marketing Statistics #9: Russia’s Exports Seen Around ~43.7 MMT
Large Black Sea exports shape global price references. Buyers will expect competitive quotes—prepare comparison sheets that show total landed cost. Address risk management: insurance, routes, and sanction compliance. Build content that explains contract terms and alternative origins as backups. Keep a rapid-response email template for corridor disruptions.
Wheat Marketing Statistics #10: Russia’s Harvest Estimated Near ~87.2 MMT
A big crop underpins the export outlook and pricing psychology. Use it to justify longer quote validity and larger shipment windows. Educate customers on quality differentials versus other origins. Offer blended-origin programs to balance price and spec needs. Maintain social posts that decode weekly export pace for non-experts.
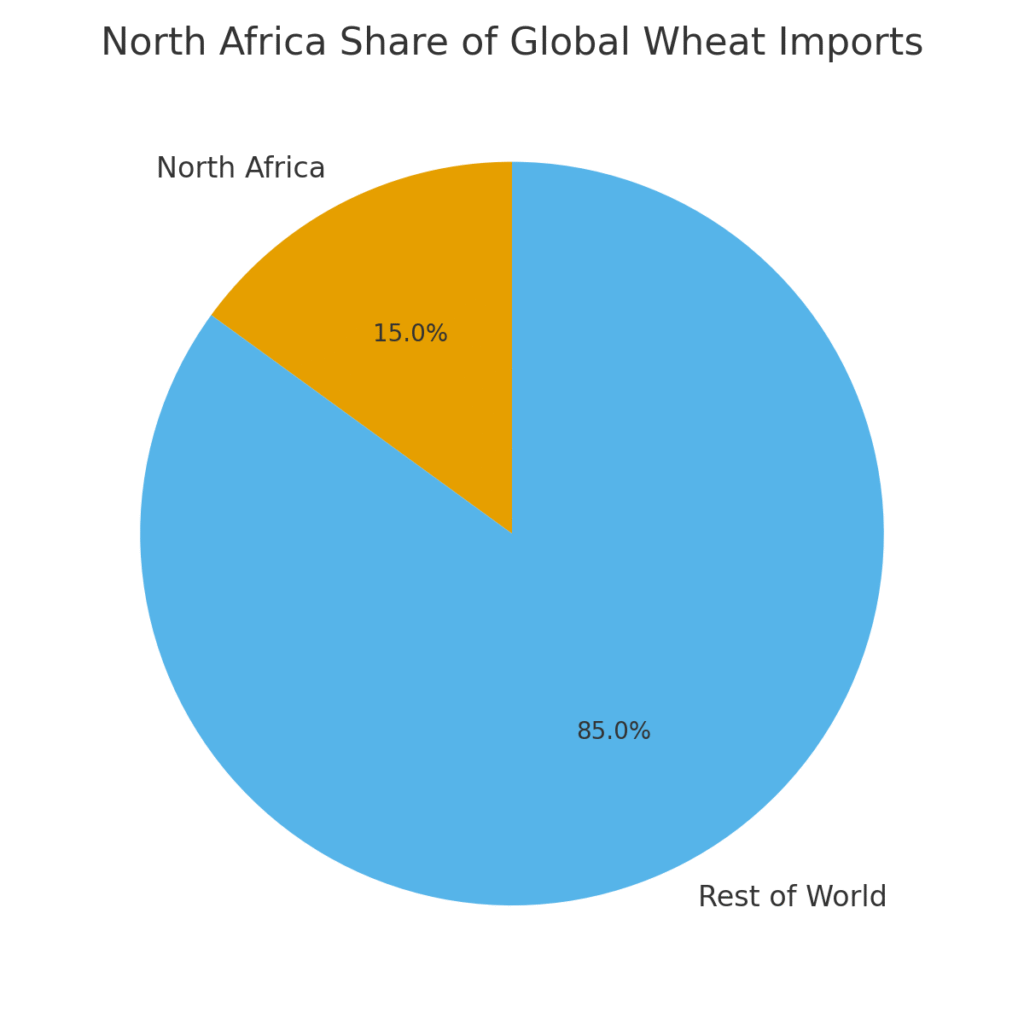
Wheat Marketing Statistics #11: North Africa Accounts For ~15% Of Global Wheat Imports
This region deserves tailored funnels and Arabic/French assets. Build landing pages for Egypt, Algeria, Morocco, Tunisia, and Libya with port-specific FAQs. Stress reliability during subsidy or tender cycles. Share proof of past tender wins and performance bonds. Coordinate webinar briefings before major buying windows.
Wheat Marketing Statistics #12: China Is Increasing Wheat Use In Feed Rations
Feed inclusion changes demand elasticity and product specs. Publish explainers comparing wheat vs. corn in rations by cost and performance. Offer mill-ready blends with guaranteed mycotoxin and moisture thresholds. Provide freight options optimized for Southern and Eastern Chinese ports. Retarget feed integrators with dynamic pricing updates.
Wheat Marketing Statistics #13: U.S. Wheat Exports Forecast Around 875 Million Bushels
U.S. origin sells on documentation strength and service. Spotlight traceability, phytosanitary rigor, and contract clarity. Build calculators that convert bushels to metric tons for international buyers. Promote port diversity (PNW vs. Gulf) to meet timing needs. Use customer stories from Latin America and Asia to lower perceived risk.
Wheat Marketing Statistics #14: U.S. Season-Average Farm Price Pegged At ~$5.30/Bu
A clear reference price helps frame budget planning. Translate it into per-ton and per-bag equivalents for non-U.S. buyers. Pair with hedging education to reduce price-shock objections. Create templates for CFO approvals based on benchmark spreads. Offer subscription updates when the reference moves beyond set thresholds.
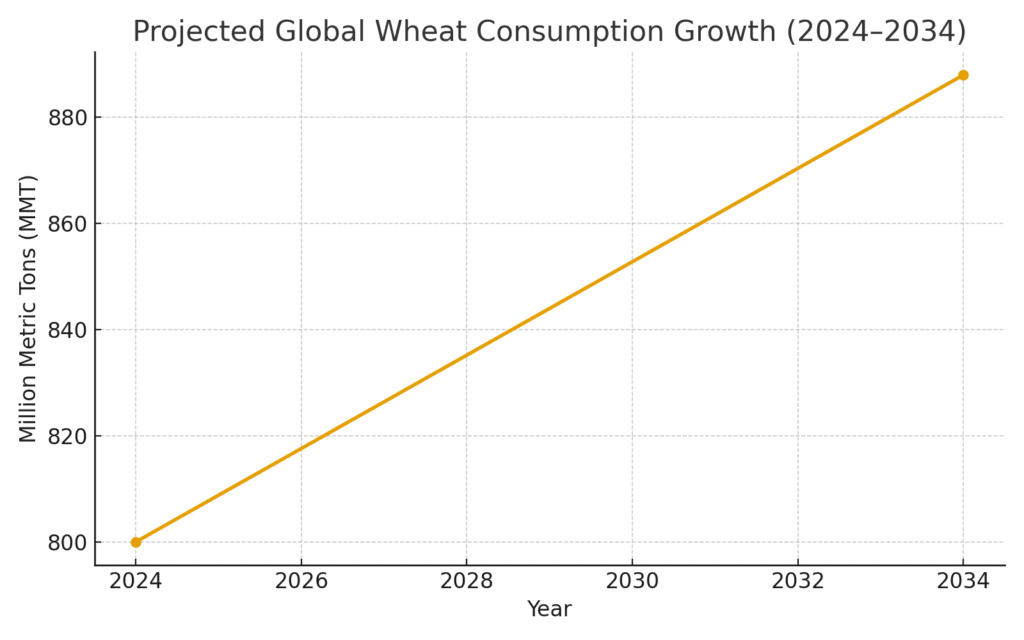
Wheat Marketing Statistics #15: Global Wheat Consumption Projected To Grow ~11% By 2034
Long-run growth supports capacity investments and multi-year deals. Use this stat to justify warehouse expansions and forward contracts. Publish demand outlooks by segment—bakery, pasta, feed—to guide SKUs. Build interactive charts that let buyers model scenarios. Position your brand as a planning partner, not just a spot seller.
How I’ll Use These Wheat Marketing Stats Next
Looking at all 20 stats together, I’m leaving with a checklist: adjust messaging around supply-driven price swings, time content to crop cycles, and speak to regional demand patterns instead of chasing a one-size-fits-all pitch. I’ll translate the strongest numbers into ad hooks (“record output,” “stable food demand,” “import-reliant regions”) and build landing pages that mirror those terms, so we capture high-intent traffic and give sales a cleaner handoff. I’m also earmarking a/b tests for price-sensitivity angles and using the export/import markers to localize creatives. Most importantly, I’ll keep this page living—when the next WASDE drops or policy winds shift, I’ll update the story so you and I can pivot fast. If you want, I can spin these insights into headlines, meta copy, and a quick brief your team can ship this week.
SOURCES
- https://www.usda.gov/about-usda/general-information/staff-offices/office-chief-economist/commodity-markets/wasde-report USDA
- https://www.harvestprofit.com/blog/using-statistics-to-make-better-grain-marketing-decisions Harvest Profit