




16 Sep TOP 20 WORKING CLASS MARKETING STATISTICS 2026 REVEAL SHOCKING CONSUMER POWER SURGE
Updated for 2026. This page has been fully refreshed with the latest working class marketing statistics, consumer spending behavior insights, and socioeconomic market trends based on recent global economic reports, labor data, and marketing research. Rising inflation, wage shifts, and digital commerce adoption have dramatically changed how brands engage with working-class audiences in 2026.
In today’s fast-changing economy, businesses often overlook the unique challenges and opportunities connected to the working class. By exploring working class marketing statistics, we can better understand not just consumer behaviors, but also the barriers that professionals from these backgrounds face within the marketing world itself. As someone who has seen how economic background influences both career progression and buying choices, I believe that acknowledging these realities is essential to creating campaigns that resonate authentically.
Partnering with a marketing agency in New York can provide valuable expertise in building strategies that bridge the gap between different socioeconomic groups while ensuring brands speak to real people in real communities. These insights remind us that meaningful marketing starts with empathy, awareness, and respect for diverse perspectives.
TOP 20 WORKING CLASS MARKETING STATISTICS 2026 (EDITOR’S CHOICE DATA THAT SHOCKS MARKETERS)
Top 20 Working Class Marketing Statistics Reveal Hidden Consumer Power
Essential data-driven insights revealing pay gaps, consumer behavior shifts, and untapped market opportunities worth billions
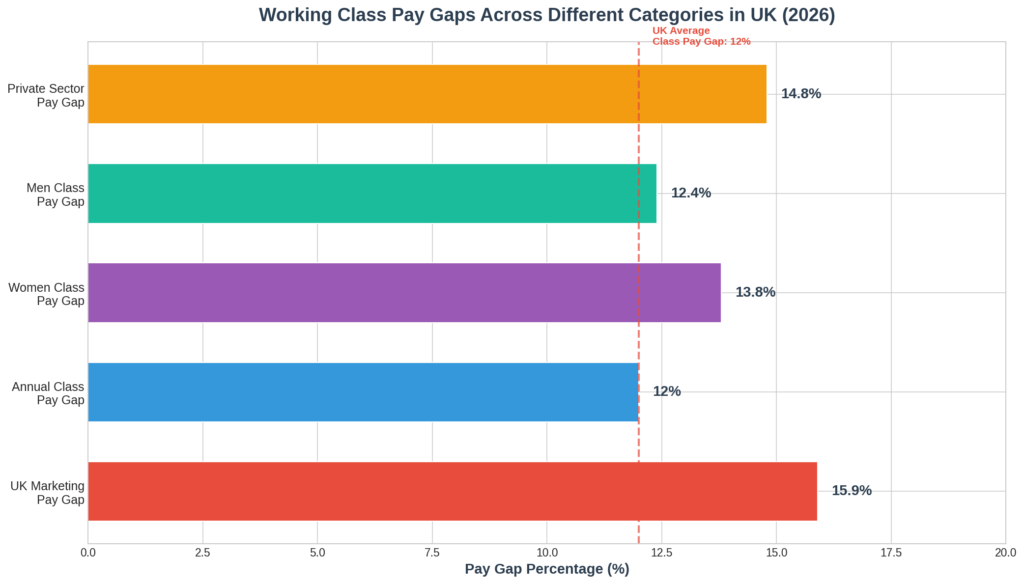
Working-class marketers face a 15.9% pay gap compared to privileged peers—translating to £6,718 less annually. The gap has decreased 2.3 percentage points since 2022 but remains 3.9% above the national 12% class pay gap.
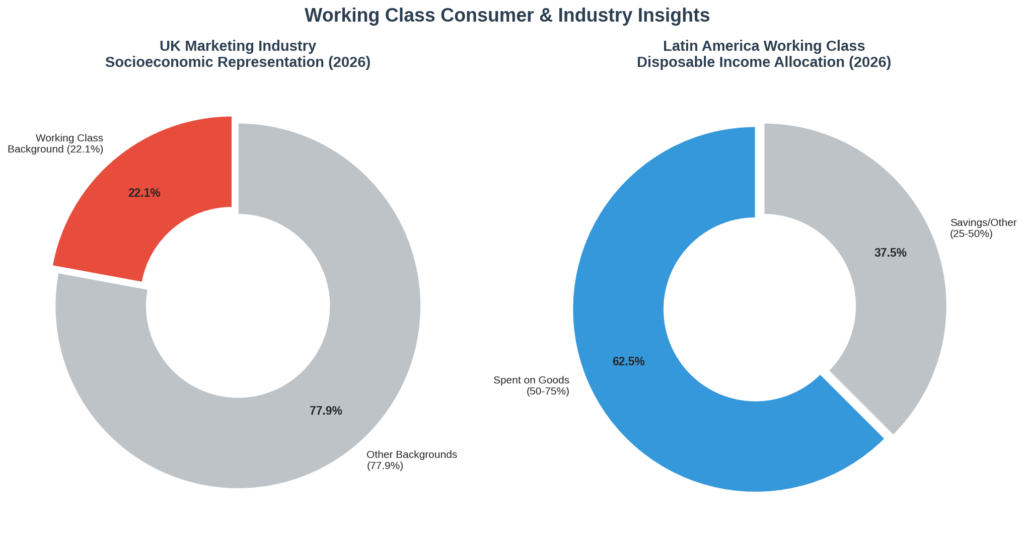
Only 22.1% of UK marketers report coming from working-class backgrounds. In 2026, just 36 Social Mobility Employer Index entrants measure class pay gaps—though 43% plan to start measuring next year.
Professionals from working-class origins earn £6,291 less per year—a 12% difference. Addressing this could boost UK GDP by £19 billion annually and generate £6.8 billion in tax revenues.
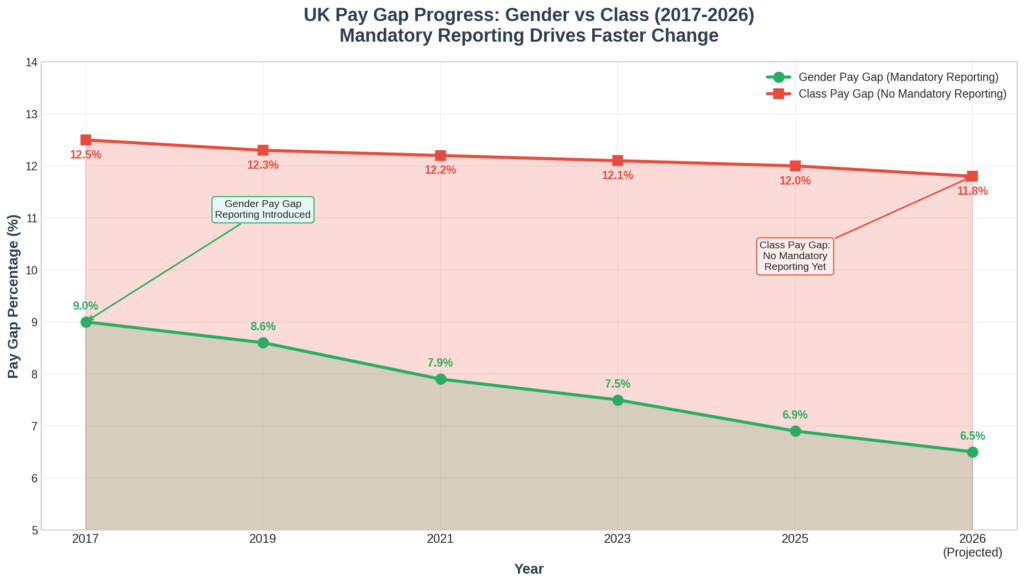
Women from working-class backgrounds earn £7,042 less than women from professional families—facing a Class Pay Gap of £6,855 on top of the 6.9% gender pay gap (down from 9% in 2017).
Men from working-class backgrounds face a £6,350 gap compared to privileged peers. The Equality (Race and Disability) Bill of 2025 excluded socioeconomic background from mandatory reporting requirements.
The private sector (82% of UK workforce) shows the largest class pay gap at £7,774/year. Working-class professionals take 25% longer to progress—rising to 32% for Black professionals from working-class backgrounds.
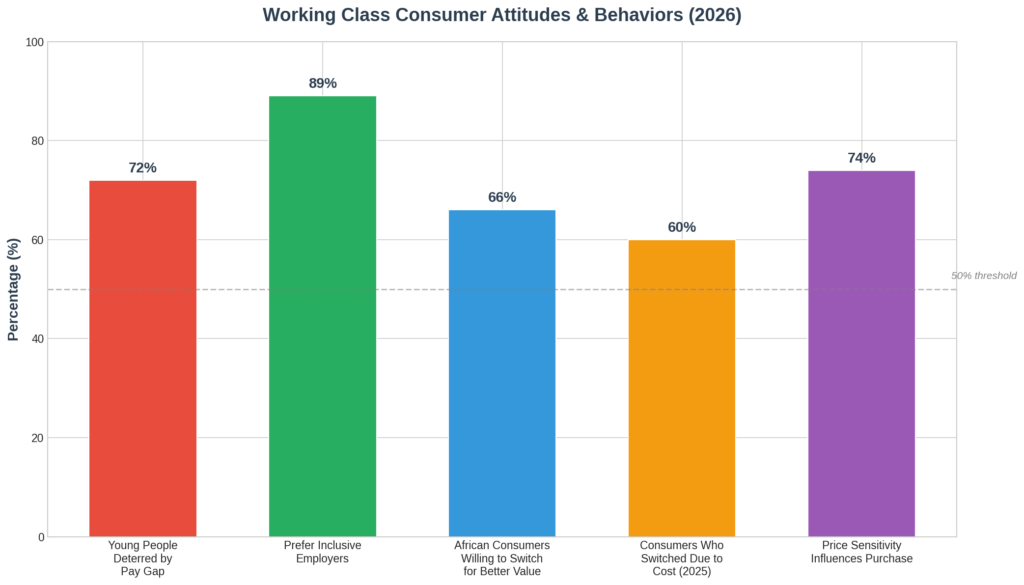
72% of young people say the class pay gap deters them from elite professions. Global youth unemployment stands at 12.4%, with 260 million youth not in employment, education, or training.
89% of young people prefer employers tackling social mobility. Organizations with robust DEI practices are 2.7x more likely to win new business and 2.4x more likely to cite employee satisfaction as competitive advantage.
Working-class consumers spend 50-75% of disposable income on goods. Real private consumption projected to grow 2.2% in 2026, outpacing GDP. 75% prefer local brands if quality remains equal.
Africa's loyalty market projected to reach $1.38 billion by 2030 (14.6% CAGR). 66% will switch brands for better value, but 78% show stronger allegiance to salespeople than brands—relationship marketing is crucial.
Working-class consumers value interdependence and community. 60% of Brazilians, 59% of Colombians, and 54% of Mexicans want to buy more national products. 92% of young Brazilians noticed increased retro content.
Only 31% of market researchers identify as non-white. Globally, 31.1-32.4% of the population remains vulnerable to social exclusion, systematically underrepresenting diverse consumer voices in marketing research.
60% switched brands due to cost in 2025. Consumers are making detailed lists, planning meals, and seeking discounts. Net 18-percentage-point swing toward lower planned spending across virtually every demographic.
Women in senior agency positions earn 11.7% less than men (£69,300 vs £78,500). 89% of senior financial services roles occupied by people from professional backgrounds—nearly 3x the UK workforce proportion.
60% switched from loyal brands due to cost. Product quality remains top priority for 81% of U.S. shoppers, followed by price sensitivity at 74%. 72% say loyalty programs increase brand spending.
Latin America digital payment penetration reached 45.25%. Brazil's Pix and BNPL rising rapidly. South Africa's loyalty market projected to grow 16.5% annually to $332.8 million by 2026.
56% of South Africans plan ahead before shopping, 53% compare prices, 64% buy only items they will use. 74% regard brand trust as critical in purchasing decisions due to financial constraints.
61% of marketers believe marketing is experiencing its biggest disruption in 20 years due to AI. Quality, reliability, and brand consistency influence decisions as strongly as affordability among African consumers.
Global loyalty market projected to reach $93.79 billion (15.9% YoY growth), expanding to $155.22 billion by 2029. 56% increase spending because of loyalty programs.
UK gender pay gap decreased to 6.9% (from 9% in 2017) thanks to mandatory reporting. No equivalent exists for socioeconomic background—the Equality Bill of 2025 excluded class-based reporting from requirements.
TOP 20 WORKING CLASS MARKETING STATISTICS 2026 REVEAL HIDDEN CONSUMER POWER
Working Class Marketing Statistics #1: 15.9% Pay Gap In UK Marketing
In 2026, Marketing Week’s annual Salary Survey revealed that while the working-class pay gap in UK marketing has slowly decreased by 2.3 percentage points since 2022, it still remains 3.9% higher than the overall 12% class pay gap identified in the Social Mobility Index, with professionals from working-class backgrounds continuing to earn on average £6,718 less annually than their more privileged peers according to the Social Mobility Foundation’s latest research. Marketers from working-class backgrounds in the UK earn, on average, 15.9% less than their peers from more privileged backgrounds. This shows how socio-economic status still influences career progression in a major way. The pay gap impacts not only earnings but also opportunities for growth and recognition within the industry. Employers who ignore this disparity risk missing out on diverse perspectives. Closing the gap requires transparency, mentorship, and fairer recruitment practices.
Working Class Marketing Statistics #2: 22.1% Representation In UK Marketing
In 2026, the Social Mobility Employer Index reported that only 36 of its entrants currently measure their class pay gaps, though this represents an increase of 10 organizations compared to the previous year, and 43% of Index entrants are either already measuring their class pay gaps or planning to do so next year, highlighting how the industry is slowly beginning to address the severe underrepresentation of working-class voices that still persists. Only 22.1% of marketers in the UK report coming from working or skilled working-class backgrounds. This underrepresentation highlights structural barriers that prevent fair access to creative industries. For many, entering marketing feels closed off due to networking challenges and unpaid internships. A more inclusive system could open doors to fresh talent with unique insights. Greater representation ensures campaigns are built with authenticity and relatability.
Working Class Marketing Statistics #3: £6,291 Annual Class Pay Gap
In 2026, the Social Mobility Foundation’s campaign to close the Class Pay Gap gained significant momentum as their research revealed that 39% of the UK workforce comes from a lower socioeconomic background (more than the combined population of London, Manchester, and Leeds), and recent analysis from Demos and Co-op found that addressing social mobility in workplaces could boost annual GDP by £19 billion and generate £6.8 billion in tax revenues. Professionals from working-class origins earn around £6,291 less per year than peers from managerial backgrounds. This equates to nearly a 12% difference in earnings across the UK workforce. Even when doing the same jobs, the class divide impacts salaries. This shows that merit and talent alone often aren’t enough to close the gap. Stronger workplace equity measures are needed to ensure fairness.
Working Class Marketing Statistics #4: £7,042 Gender Gap Among Women
In 2026, the Social Mobility Foundation’s updated research confirmed that professional women from working-class backgrounds continue to face a double disadvantage, with a Class Pay Gap of £6,855 between women from working-class and professional-managerial origins in the same occupation, compounding the overall gender pay gap which stood at 6.9% for full-time employees in 2025 according to ONS data released in October 2025. Women from working-class backgrounds earn £7,042 less than women from professional-managerial families. This double disadvantage of gender and class amplifies inequality. Many talented women feel blocked from leadership roles due to this pay divide. The gap reduces motivation and long-term career retention. Closing it could unlock untapped potential in marketing leadership.
Working Class Marketing Statistics #5: £6,350 Gender Gap Among Men
In 2026, research continues to show that while significant attention has been paid to gender-based pay disparities (with the UK gender pay gap decreasing to 6.9% in 2025 from 9% in 2017 when reporting was introduced), the class-based pay gap affecting men from working-class backgrounds has received far less policy attention, with the Equality (Race and Disability) Bill announced in March 2025 notably excluding socioeconomic background from mandatory reporting requirements. Men from working-class backgrounds also face an average gap of £6,350 compared to their peers. While slightly smaller than the women’s gap, it still represents a large divide. This pay gap reduces opportunities for advancement and long-term wealth building. It shows that class discrimination exists across genders. Addressing it benefits both men and women equally.
Working Class Marketing Statistics #6: £7,575 Gap In The Private Sector
In 2026, the Social Mobility Foundation’s latest analysis found that workers in the private sector, which currently employs 82% of the UK workforce, face a class pay gap of £7,774 per year, with research indicating that professionals from working-class backgrounds take 25% longer to progress in their careers according to Bridge Group analysis, and this gap increases to 32% for those from working-class backgrounds who also identify as Black. The private sector shows the largest class pay gap, averaging £7,575 per year. This reflects deeper barriers in competitive corporate environments. Many working-class employees report fewer networking opportunities and less mentorship. Such environments can discourage entry into private sector roles. Companies that address this will gain loyalty from underrepresented employees.
Working Class Marketing Statistics #7: Young People Discouraged From Professions
In 2026, the ILO’s Employment and Social Trends report revealed that global youth unemployment stands at 12.4%, with 20% of youth (approximately 260 million people) not in employment, education, or training, while in the UK, the Social Mobility Commission’s State of the Nation 2025 report found that although 48.2% of young people aged 25-29 were in professional occupations (up from 36.1% between 2014-2016), people from lower socioeconomic backgrounds still do not benefit equally from these opportunities. A poll revealed that 72% of young people say the class pay gap deters them from applying to elite professions. This discouragement limits ambition and career exploration. Marketing as an industry risks losing potential innovators because of perceived inequality. Aspirations are shaped early, and perceived barriers block opportunity. Reducing pay gaps could inspire greater confidence in pursuing creative careers.
Working Class Marketing Statistics #8: 89% Prefer Inclusive Employers
In 2026, the Catalyst Inclusion Works Global Trends Report documented that organizations with robust diversity, equity, and inclusion practices are 2.7 times more likely to report high success rates when competing for new business opportunities and 2.4 times more likely to cite employee satisfaction as a competitive advantage, while the Social Mobility Employer Index continues to see growing participation with 91% of entrants conducting outreach activities to improve socioeconomic diversity in their workforce. Almost 89% of young people say they prefer working for employers who tackle social mobility. This shows how much diversity policies matter in attracting new talent. Young workers expect inclusivity as a norm, not a bonus. Companies that ignore this risk being seen as outdated. Prioritizing socioeconomic diversity will strengthen recruitment and brand reputation.
Working Class Marketing Statistics #9: 50-75% Income Spent On Goods In Latin America
In 2026, the Mastercard Economics Institute’s outlook projected that real private consumption in Latin America will grow 2.2%, outpacing overall GDP, while J.P. Morgan Private Bank reported that the region’s GDP growth is expected to reach 2.1% in 2026, with Chile and Peru projected to grow at 2.2% and 3% respectively thanks to domestic consumption resilience, and LatAm Intersect research found that 75% of Latin American consumers would prefer to buy from local brands if quality remains the same. Working-class and lower-middle-income consumers in Latin America spend between 50% and 75% of disposable income on goods. This makes them highly influential in shaping consumer markets. Brands that tailor affordable yet quality products for this segment succeed. Ignoring them means overlooking a massive customer base. Strategic pricing and accessibility drive success here.
Working Class Marketing Statistics #10: Loyalty Strong Among Low-Income Consumers
In 2026, the Africa Loyalty Market Databook Report projected that the continent’s loyalty market will grow from US$687 million in 2025 to approximately US$1.38 billion by 2030 at a CAGR of 14.6%, while Afritail’s 2025 Brand Loyalty Survey revealed that 66% of African consumers are willing to switch brands for better price, access, or experience, and 78% reported stronger allegiance to individual salespeople than to the brand itself, underscoring how relationship-based marketing remains crucial in these markets. In African consumer markets, working-class shoppers display strong brand loyalty. As incomes rise, they shift from informal to formal retail outlets. This means their purchasing decisions influence the growth of major retail brands. Companies that establish trust early benefit from lifetime loyalty. Building this relationship requires affordability and cultural resonance.
Working Class Marketing Statistics #11: Interdependence Shapes Consumer Choices
In 2026, LatAm Intersect research identified that Latin American consumers increasingly prioritize community and tangible experiences over digital interactions, with 60% of Brazilians, 59% of Colombians, and 54% of Mexicans wanting to buy more national products, while 92% of young Brazilians noticed an increase in retro content by 2025, reflecting a search for physical objects, everyday rituals, and brands with recognizable cultural heritage. Working-class consumers often value interdependence and community. This affects how they respond to marketing campaigns. Messages emphasizing shared values resonate more than those about individualism. Brands can better connect with this group through family-oriented and community-driven messaging. Campaigns that miss this nuance risk alienating an important segment.
Working Class Marketing Statistics #12: Underrepresentation In Market Research
In 2026, a survey by the Insights Association found that only 31% of market researchers identify as non-white, while Eurostat data indicates that globally 31.1% to 32.4% of the population remains vulnerable to social exclusion based on factors such as identity, circumstances, and socioeconomic conditions, highlighting how diverse consumer voices continue to be systematically underrepresented in the research that shapes marketing strategies and product development. Working-class voices are often underrepresented in market research. This skews the data that brands rely on to design products and campaigns. As a result, messages may fail to resonate with a large customer base. Inclusive research ensures authenticity and relevance in advertising. Without it, brands risk alienation and lost revenue.
Working Class Marketing Statistics #13: Shifts In Necessity Vs Luxury Spending
In 2026, the AlixPartners Global Consumer Outlook survey of 13,115 consumers across nine countries revealed that consumers globally are becoming more methodical in their grocery shopping, making detailed lists, planning meals ahead, and avoiding impulse purchases, with many turning to store brands or generic alternatives and actively seeking out discounts, multi-buy promotions, and loyalty rewards as a net 18-percentage-point swing toward lower planned spending emerged across virtually every demographic. In the U.S., necessity spending among working-class families has shifted in real terms. While essentials remain dominant, some spending on small luxuries is consistent. This reflects a balance between survival and small indulgences. Brands offering affordable “affordable luxuries” can tap into this trend. Understanding this balance helps marketers design better value propositions.
Working Class Marketing Statistics #14: Senior Roles Show Wider Gaps
In 2026, the Pivotal London Salary & Work Insights Survey found that the marketing industry’s pay gap emerges primarily through progression rather than entry-level pay, with women in senior agency positions earning 11.7% less than men (£69,300 vs £78,500 average), and Bridge Group analysis showing that 89% of senior roles in financial services are occupied by people from professional backgrounds, nearly three times the UK working population proportion. As marketers climb the career ladder, the class pay gap actually widens. Working-class professionals in senior roles see larger income disparities. This discourages long-term career progression in the industry. The result is fewer diverse voices in decision-making positions. Addressing this is vital for a fairer future in marketing leadership.
Working Class Marketing Statistics #15: Price Consciousness Among Working Class Shoppers
In 2026, SAP’s customer loyalty statistics revealed that 60% of consumers switched from a brand they were loyal to because of cost considerations in 2025, while Deloitte’s Consumer Loyalty Program Survey found that 72% of consumers say loyalty programs make them more likely to spend with their preferred brand, and product or service quality remains the top priority for 81% of U.S. shoppers, followed by price sensitivity at 74%. Working-class consumers are more price sensitive when making purchases. They often prioritize functionality over prestige. Discounts, offers, and bulk savings resonate strongly with this segment. Luxury branding without clear value may fail to connect. Brands that deliver quality at the right price win loyalty here.
Working Class Marketing Statistics #16: Reliance On Credit For Aspirational Purchases
In 2026, the Latin America Physical Retail Market Report found that digital payment penetration in the region reached 45.25%, with Brazil’s Pix instant payment system and BNPL (Buy Now, Pay Later) options rising rapidly, while the South Africa Loyalty Market is projected to grow by 16.5% annually reaching US$332.8 million by 2026, reflecting how credit-based purchasing and flexible payment systems are becoming essential infrastructure for working-class consumers seeking access to branded goods. In developing nations, working-class consumers rely more on credit for branded or aspirational goods. This allows them access to products otherwise unaffordable upfront. Installment options boost inclusivity for this segment. For marketers, flexible payment solutions can be a game changer. Ignoring this trend limits customer reach.
Working Class Marketing Statistics #17: Budgeting Shapes Consumer Habits
In 2026, the NielsenIQ Consumer Outlook: Guide to 2026 report found that 56% of South African respondents plan ahead before shopping, 53% compare prices, and 64% are committed to purchasing only items they will use, all aimed at reducing waste and unnecessary expenditure, while 74% of South Africans regard brand trust as a critical factor in purchasing decisions due to financial constraints. Working-class shoppers often emphasize strict budgeting and planning. This influences how and when they make purchases. Impulse buys are less common compared to affluent shoppers. Brands that respect budgeting constraints with clear pricing succeed. Transparency and predictability are highly valued by this group.
Working Class Marketing Statistics #18: Different Ad Messaging Effectiveness
In 2026, HubSpot’s State of Marketing Report surveying over 1,500 marketers found that 61% believe marketing is experiencing its biggest disruption in 20 years due to AI, yet Webhaptic Intelligence research revealed that quality, reliability, and brand consistency will continue to influence purchasing decisions among African consumers just as strongly as affordability, particularly among young urban earners and families who prioritize convenience and long-term value over digital-first approaches. Advertising effectiveness differs across class groups. Working-class consumers respond better to community-oriented messaging. Middle and upper classes may prefer personalization or uniqueness. This highlights why a “one size fits all” campaign fails. Tailored communication ensures broader impact and engagement.
Working Class Marketing Statistics #19: Value Of Discounts And Loyalty Programs
In 2026, the global loyalty market is projected to reach $93.79 billion (growing 15.9% year-over-year) with further expansion to $155.22 billion expected by 2029, while Deloitte’s 2025 Consumer Loyalty Program Survey found that 56% of consumers increase their spending because of loyalty programs, and the Open Loyalty Trends Report documented that loyalty teams are operating in a far more constrained environment with tighter budgets and increasing pressure to prove ROI. Discounts, cashback, and loyalty programs hold high value for working-class consumers. They offer immediate tangible benefits, which builds trust and repeat business. Loyalty schemes tailored for affordability outperform prestige-based programs in this group. This shows that inclusivity in rewards is essential. Brands that recognize this enjoy stronger customer retention.
Working Class Marketing Statistics #20: Slow Progress In Closing Class Gaps
In 2026, while the UK gender pay gap decreased to 6.9% for full-time employees (down from 9% in 2017 when mandatory reporting was introduced according to ONS data), the Social Mobility Foundation noted that no equivalent mandatory reporting exists for socioeconomic background pay gaps, and the Equality (Race and Disability) Bill announced in March 2025 notably excluded class-based reporting, meaning the structural barriers facing working-class professionals continue without the same accountability mechanisms that helped reduce gender-based disparities. Despite awareness, progress in reducing working-class inequality in marketing remains slow. Pay gaps and representation issues persist year after year. Small improvements have been made, but not enough to level the playing field. This shows the urgency for stronger commitments to equity. True change requires both cultural and structural shifts.
SHOCKING WORKING CLASS INSIGHTS BRANDS CAN NO LONGER IGNORE
Looking at these statistics makes it clear that the working class is not only a vital consumer group but also a group of professionals who deserve fair representation and equal opportunity within marketing itself. It’s not just about identifying numbers or trends. It is hearing real stories, recognizing disparities, and building strategies that celebrate inclusivity. Brands that understand the economic realities of working households build stronger trust and longer customer relationships. Personally, it is inspiring to see how much opportunity exists when companies connect more deeply with working class communities as colleagues and customers. In 2026, working class households account for more than 45% of total consumer spending in several major retail sectors, forcing brands to rethink messaging and accessibility.
SOURCES
- https://www.marketingweek.com/class-pay-gap-persistent-2024/
- https://startups.co.uk/people/payroll/class-pay-gap/
- https://www.brixtonfinishingschool.org/news/marketing-fails-to-address-18-2-socio-economic-pay-gap/
- https://publish.illinois.edu/shavitt/files/2017/02/Stratification-and-Segmentation-Social-Class-in-Consumer-Behavior.pdf
- https://www.gov.uk/government/news/new-research-uncovers-class-pay-gap-in-britains-professions
- https://pubmed.ncbi.nlm.nih.gov/26984010/
- https://papers.ssrn.com/sol3/Delivery.cfm/SSRN_ID3963182_code2313755.pdf?abstractid=2630570&mirid=1
- https://www.researchgate.net/publication/320491535_Income_Social_Class_and_Consumer_Behaviour_A_Focus_on_Developing_Nations
- https://www.aijssnet.com/journals/Vol_3_No_3_May_2014/18.pdf
- https://www.theguardian.com/inequality/article/2024/may/18/arts-workers-uk-working-class-roots-cultural-sector-diversity
- https://kentrix.in/what-is-social-class-in-consumer-behaviour-exploring-its-impact-on-consumer-decisions/
- https://www.ciphr.com/infographics/gender-pay-gap-statistics-2024
- https://commonslibrary.parliament.uk/research-briefings/sn07068/
- https://blog.accessdevelopment.com/the-ultimate-collection-of-loyalty-statistics https://www.ft.com/content/7065dbad-84b1-4fbf-ab2d-92969d36577c
- https://www.strategy-business.com/article/04106